Business Analytics has become a catch all word for any thing to do with data.
So if you are new to this field and don’t understand what people refer to as “Business Analytics”, don’t worry!
Even after spending more than 6 years in this industry, there are times when it is difficult for me to understand the work a person has done by reading his CV.
Here is how an excerpt from a typical JD might look like:
- Analyze, prepare reports and present to Leadership team on a defined frequency
or
- Lead multiple analytical projects and business planning to assist Leadership team deliver business performance.
On one hand, this creates confusion in mind of person applying for a particular role. On the other hand, it leaves the selectors with a difficult role to understand and judge what a person has done in past.
Now, if I got this as description for one of the jobs I had applied to, I would be scared! Scared, not because I don’t know the subject, but because, these could mean anything. The work could refer to preparing basic reports at a junior level to performing multi-variate deep dives on various subjects.
So, what do you do when you are in such a situation?
Well, the first thing you should do is understand Business Analytics spectrum. Once you have understood it, ask which part of the spectrum, the role applies to and then decide whether it suits your skills or not.
Following is a good representation of this spectrum:
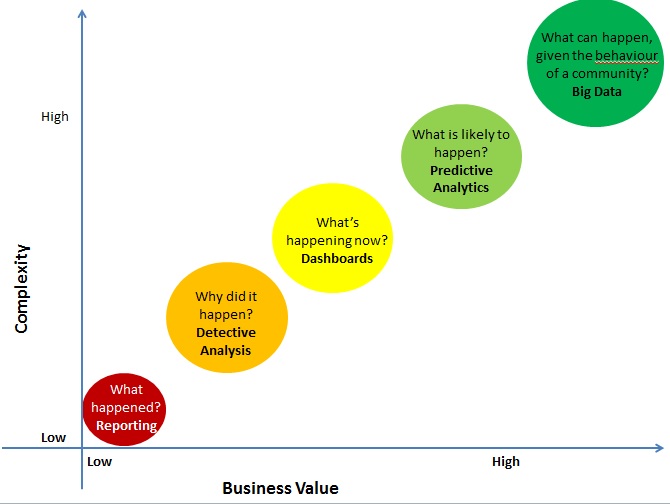
Let me explain each of these areas in a bit more detail.
[stextbox id=”section”]Reporting – Answer to What happened?[/stextbox]
The domain of Analytics starts from answering a simple question – What happened? This activity is typically known as reporting. These are typically the MIS which people want to receive first thing in the morning. It is a snapshot of what has happened. Following is an example of how a typical report might look like:

Tools used in reporting:
Majority of elementary reporting happens on MS Excel across the globe. More evolved Organizations might pull the data through databases using tools like SQL, MS Access or Oracle. But typically, the dissemination of reports happens through Excel.
Skills required for reporting:
- MS excel
- Business understanding
- Ability to perform monotonous task with diligence
[stextbox id=”section”]Detective Analysis – Answer to Why did it happen?[/stextbox]
Detective Analysis starts where reporting ends. You start looking for reasons for unexpected changes. Typical problems you work on are “Why did the Sales drop in last 2 months?” or “Why did the latest campaign under-perform or over-perform?”. In order to find out answers to these questions, you look at past trends or you look at distribution changes to find out the reasons for the changes. However, all of this is backward looking.
Some of these insights, which you find out after looking at backward analysis can be used for business planning, but the purpose of analysis is typically to find out what has worked and what has not.
Tools used in detective analysis:
Typically used tools are MS excel, MS Access, Minitab, R (basic regression). You tend to use advanced Excel and Pivot tables while dealing with these problems and typically creating time series graphs helps a lot.
Skills required for detective analysis:
- Structured thinking
- MS Access, Excel, basic regression
- Business understanding
[stextbox id=”section”]Dashboards – Answer to What’s happening now?[/stextbox]
Dashboard is an Organized and well presented summary of key business metrics. They are usually interactive so that the user can find out the exact information he is looking for. Dashboard, in ideal state should provide real time information about performance. Following is an example of how a dashboard might look like:
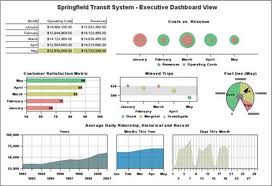
The whole science of creating data model, dashboards and reports based on this data is also known as “Business Intelligence“.
Tools used for creating dashboards:
For limited size of data, dashboards can be made using Advanced excel. But, typically Organizations use more advanced tools for creation and dissemination of tools. Business Objects, Qlikview, Hyperion are names of some such softwares.
Skills required for creating dashboards:
- Strong structured thinking: The person will need to create the entire architecture and data model
- Business Understanding: If you don’t understand what you want to represent, God help you!
[stextbox id=”section”]Predictive Modeling – Answer to What is likely to happen?[/stextbox]
This is where you take all your historical trends and information and apply it to predict the future. You try and predict customer behaviour based on past information. Please note that there is a fine difference in forecasting and predictive modeling. Forecasting is typically done at aggregate level, where as predictive modeling is typically done at a customer / instance level
Tools used for Predictive modeling:
SAS has the highest market share among tools used for predictive modeling followed by SPSS, R, Matlab.
Skills required for Predictive modeling:
- Strong structured thinking
- Business Understanding
- Problem Solving
[stextbox id=”section”]Big data – Answer to What can happen, given the behaviour of the community?[/stextbox]
Imagine applying predictive modeling with a microscope in hand. What if you can store, analyze and make sense out of every information about the customer. What kind of social media community he is attached to? What kind of searches is he performing? Big data problems arise when data has grown on all three Vs (Volume, Velocity and Variety). You need data scientists to mine this data.
Tools used in Big data:
This is a very dynamic domain right now. A tool which used to be market leader 6 months back is no longer the best. Hence, it is difficult to pin down specific tools. These tools typically work on Hadoop to store the data.
Skills required for harnessing big data:
- Strong structured thinking
- Advanced Data Architecture knowledge
- Ability to work with unstructured data
So, now that you understand the Analytics spectrum, if you come across a role which is not clear to you, please spend the necessary time understanding which domain does it refer to and does it fit right with what you want to achieve.
If you have come across this confusion on understanding “Business Analytics“, this article should have helped you. In case there are any further confusion, do let me know.
If you like what you just read & want to continue your analytics learning, subscribe to our emails or like our facebook page
Kunal Jain
27 Aug, 2021
Kunal is a post graduate from IIT Bombay in Aerospace Engineering. He has spent more than 10 years in field of Data Science. His work experience ranges from mature markets like UK to a developing market like India. During this period he has lead teams of various sizes and has worked on various tools like SAS, SPSS, Qlikview, R, Python and Matlab.


Hi Kunal, This is a great article to understand the different domains of analytics. Thanks ! Jay
Hi Kunal, I had come across your website through a blog page from Jigsaw academy and I must say that your articles are extremely insightful and easy too read. Please continue to share such knowledge for us aspiring analysts. Many thanks again.
this was great article and really helpfull tome i was looking for more such article….. thanks for sharing………..
Excellent sharing! Thanks a lot.
Kunal, To enter into Data Analytics, should we go these steps? Understand Reporting and move upwards? Can we directly start with Business Intelligence? Or Can we start with BigData directly? Any suggestions.
YV, You can start at any step you want as long as you understand what is happening in each domain. Regards, Kunal
Hi Kunal, It is a great learning for me, but i just want to know what course i have to prefer at the initial stage. I am well known with execl and I am working as a business analyst from last 1.5 year but want to use some some other professiona tools And what is the scope of Hadoop in term money
Hi Kunal, This article is very good. It gives a clear picture of in layman terms. Appreciate your effort to write such a blog. Thanks, Mani
Thanks Mani!
I dont know higher maths at all. I scored 95% in CAT QA, or 51 in GMAT QA. Please tell me whether I have potential to crack technical test for a good Analytics firm? What are the general maths topics one should know for a career in analytics?
Jigar, You need to understand and love Probability and statistics to be a good business analyst. Also, there is no point in drawing correlation from CAT or GMAT. They should be treated just as indicators. If you prepare well and are really excited by the subject, you can do good irrespective. It is not correct to judge people on score of a few tests. Regards, Kunal
A very concise description, thanks.
Kunal sir, Thanks a lot sir it's really help me to take my decision, now I decided to go for the BI i.e Dashboard This article clear my all doubts. Thanx :D :D
Hi Kunal, How much excel knowledge is required prior to taking BA course? Regards, Aditya
Hi Kunnal, Thanks for this very good work, I really appreciate it. Please I want to develop my career in Business Analytics but I have no technical skill except excel. Please where do you recommend that I start from and how do I start. I look forward to your response.
Hi Mr. Kunal, Thank you very much for your article it is really useful for me and i would like to now which course do i need to do to get in to the "Business analyst " role. am from electronics background.
Hi Kunal, You have done a good job. Thanks for the insight into Biz Analytics...
Great article.... very clear and informative :) thanks kunal :)
Can you please suggest how fresher can start in roles like predictive modelling and big data analytic because as we move further work exp.starts playing important role.
Yogesh, Before moving into Analytics, you must read the following articles: 1. “How to start a career in Business Analytics?” 2. “All you need to know to start a career in analytics”. 3. “How to choose the right data science / analytics / big data training?”. For a fresher, I would recommend learning SAS. SAS itself covers the Predictive modelling techniques. You can look at our SAS learning path. You can also look at the SAS-Institute for short term certification course in predictive modelling. For gaining work experience, apply your learnings to datasets. Regards, Kunal
Hi Kunal , Thank you very much for the article. I have more than 6 Years experience in the Branch Banking. I want to shift my career to Analytics. Is any company will take banking professional directly. Please suggest me what i have to take into consideration for pursuing career in Analytics. Thanks
Hi Kunal, I have completed course on SAS,EXCEL,Macro,Dashboard,VBA,Automation. But i am working in insurance sector now from the past 20 months. I have done with my MBA(finance) and BSC(statistics). I am very much interested in Statistics related job, but experienced in insurance. Please assist me how to enter into analytics in this situation. I have knowledge about all tools but i dont know how to proceed. I went to interview recently and they said we should have at least 6 month experience in related domain.
Thank you for a very informative post. I would also stress that the differences between "business intelligence" and "business analytics" are often not entirely clear cut. The distinction between dashboarding reporting (BI) and advanced predictive analysis (BA) is possible, but is hardly universally used - both vendors and analysts could easily use these terms interchangeably, or adopt different terminology altogether. It is similar to the inflation of "data scientists", who would previously have been referred to as "data analyst" or "business analyst". In short: the field is young, and as such its terminology is still being developed. In a few years there will probably be something closer to universally accepted terminology.
Hi Kunal, Great article brother. I am a MBA (ITBM) and B.Tech (CS). Currently working in Risk Analytics. I have couple of questions - 1. How can I make a transition to Business Analyst role (more generic profile)? 2. How can I use Risk Analytics (or if possible Business Analytics) to solve business problems in my profile as a Business Analyst?
Hi Kunal, Very useful information for all who are aspiring for Business Analytics jobs. I have been BFSI domain which involves some sort of BA kind of role. I know only fair amount of Excel, Access knowledge and I am also working on VBA automation (Not very extensively). My question1 to you is for BA profile what all core technical skill set is must for anyone to survive in this domain for long run? Question2 - Is there anymore programming languages need to learn in future? I am not very quick to learn programming languages. Question3 - Tools currently popular in this domain. I am waiting for your reply. Many thanks in Adv. Regards, Anirudh
Very well written article. Clears all fog about Data Analytics road map.
Awesome post. After reading this I got a clear cut idea regarding BA. Thanks for sharing this.