Build a Predictive Model in 10 Minutes (using Python)
Introduction
I came across this strategic virtue from Sun Tzu recently:

What has this to do with a data science blog? This is the essence of how you win competitions and hackathons. You come in the competition better prepared than the competitors, you execute quickly, learn and iterate to bring out the best in you.
Last week, we published “Perfect way to build a Predictive Model in less than 10 minutes using R“. Any one can guess a quick follow up to this article. Given the rise of Python in last few years and its simplicity, it makes sense to have this tool kit ready for the Pythonists in the data science world. I will follow similar structure as previous article with my additional inputs at different stages of model building. These two articles will help you to build your first predictive model faster with better power. Most of the top data scientists and Kagglers build their first effective model quickly and submit. This not only helps them get a head start on the leader board, but also provides a bench mark solution to beat.

Table of contents
Breaking Down the process of Predictive Modeling
I always focus on investing quality time during initial phase of model building like hypothesis generation / brain storming session(s) / discussion(s) or understanding the domain. All these activities help me to relate to the problem, which eventually leads me to design more powerful business solutions. There are good reasons why you should spend this time up front:
- You have enough time to invest and you are fresh ( It has an impact)
- You are not biased with other data points or thoughts (I always suggest, do hypothesis generation before deep diving in data)
- At later stage, you would be in a hurry to complete the project and not able to spend quality time
This stage will need a quality time so I am not mentioning the timeline here, I would recommend you to make this as a standard practice. It will help you to build a better predictive models and result in less iteration of work at later stages. Let’s look at the remaining stages in first model build with timelines:
- Descriptive analysis on the Data – 50% time
- Data treatment (Missing value and outlier fixing) – 40% time
- Data Modelling – 4% time
- Estimation of performance – 6% time
P.S. This is the split of time spent only for the first model build
Let’s go through the process step by step (with estimates of time spent in each step):
Stage 1: Descriptive Analysis / Data Exploration:
In my initial days as data scientist, data exploration used to take a lot of time for me. With time, I have automated a lot of operations on the data. Given that data prep takes up 50% of the work in building a first model, the benefits of automation are obvious. You can look at “7 Steps of data exploration” to look at the most common operations of data exploration.
Tavish has already mentioned in his article that with advanced machine learning tools coming in race, time taken to perform this task has been significantly reduced. Since this is our first benchmark model, we do away with any kind of feature engineering. Hence, the time you might need to do descriptive analysis is restricted to know missing values and big features which are directly visible. In my methodology, you will need 2 minutes to complete this step (Assumption, 100,000 observations in data set).
The operations I perform for my first model include:
- Identify ID, Input and Target features
- Identify categorical and numerical features
- Identify columns with missing values
Stage 2: Data Treatment (Missing values treatment):
There are various ways to deal with it. For our first model, we will focus on the smart and quick techniques to build your first effective model (These are already discussed by Tavish in his article, I am adding a few methods)
- Create dummy flags for missing value(s) : It works, sometimes missing values itself carry a good amount of information.
- Impute missing value with mean/ median/ any other easiest method : Mean and Median imputation performs well, mostly people prefer to impute with mean value but in case of skewed distribution I would suggest you to go with median. Other Intelligent methods are imputing values by similar case mean and median imputation using other relevant features or building a model. For Example: In Titanic survival challenge, you can impute missing values of Age using salutation of passengers name Like “Mr.”, “Miss.”,”Mrs.”,”Master” and others and this has shown good impact on model performance.
- Impute missing value of categorical variable: Create a new level to impute categorical variable so that all missing value is coded as a single value say “New_Cat” or you can look at the frequency mix and impute the missing value with value having higher frequency.
With such simple methods of data treatment, you can reduce the time to treat data to 3-4 minutes.
Stage 3. Data Modelling :
I recommend to use any one of GBM / Random Forest techniques, depending on the business problem. These two techniques are extremely effective to create a benchmark solution. I have seen data scientist are using these two methods often as their first model and in some cases it acts as a final model also. This will take maximum amount of time (~4-5 minutes).
Stage 4. Estimation of Performance:
There are various methods to validate your model performance, I would suggest you to divide your train data set into Train and validate (ideally 70:30) and build model based on 70% of train data set. Now, cross-validate it using 30% of validate data set and evaluate the performance using evaluation metric. This finally takes 1-2 minutes to execute and document.
Intent of this article is not to win the competition, but to establish a benchmark for our self. Let’s look at the python codes to perform above steps and build your first model with higher impact.
Let’s start putting this into action
I have assumed you have done all the hypothesis generation first and you are good with basic data science using python. I am illustrating this with an example of data science challenge. Let’s look at the structure:
Step 1 : Import required libraries and read test and train data set. Append both.
import pandas as pd
import numpy as np
from sklearn.preprocessing import LabelEncoder
import random
from sklearn.ensemble import RandomForestClassifier
from sklearn.ensemble import GradientBoostingClassifier
train=pd.read_csv('C:/Users/Analytics Vidhya/Desktop/challenge/Train.csv')
test=pd.read_csv('C:/Users/Analytics Vidhya/Desktop/challenge/Test.csv')
train['Type']='Train' #Create a flag for Train and Test Data set
test['Type']='Test'
fullData = pd.concat([train,test],axis=0) #Combined both Train and Test Data set
Step 2: Step 2 of the framework is not required in Python. On to the next step.
Step 3: View the column names / summary of the dataset
fullData.columns # This will show all the column names
fullData.head(10) # Show first 10 records of dataframe
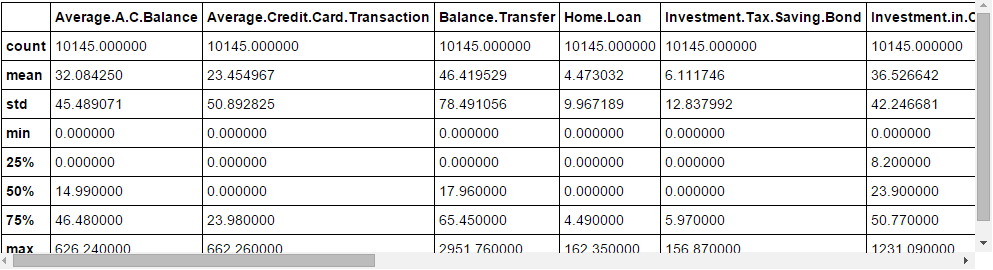
fullData.describe() #You can look at summary of numerical fields by using describe() function
Step 4: Identify the a) ID variables b) Target variables c) Categorical Variables d) Numerical Variables e) Other Variables
ID_col = ['REF_NO']
target_col = ["Account.Status"]
cat_cols = ['children','age_band','status','occupation','occupation_partner','home_status','family_income','self_employed', 'self_employed_partner','year_last_moved','TVarea','post_code','post_area','gender','region']
num_cols= list(set(list(fullData.columns))-set(cat_cols)-set(ID_col)-set(target_col)-set(data_col))
other_col=['Type'] #Test and Train Data set identifier
Step 5 : Identify the variables with missing values and create a flag for those
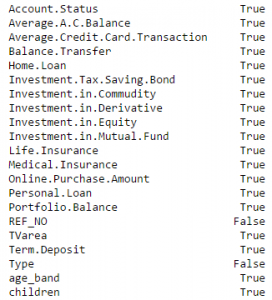
fullData.isnull().any()#Will return the feature with True or False,True means have missing value else False

num_cat_cols = num_cols+cat_cols # Combined numerical and Categorical variables

#Create a new variable for each variable having missing value with VariableName_NA
# and flag missing value with 1 and other with 0

for var in num_cat_cols:
    if fullData[var].isnull().any()==True:
        fullData[var+'_NA']=fullData[var].isnull()*1
num_cat_cols = num_cols+cat_cols # Combined numerical and Categorical variables
#Create a new variable for each variable having missing value with VariableName_NA
# and flag missing value with 1 and other with 0
for var in num_cat_cols:
if fullData[var].isnull().any()==True:
fullData[var+'_NA']=fullData[var].isnull()*1
Step 6 : Impute Missing values
#Impute numerical missing values with mean
fullData[num_cols] = fullData[num_cols].fillna(fullData[num_cols].mean(),inplace=True)
#Impute categorical missing values with -9999
fullData[cat_cols] = fullData[cat_cols].fillna(value = -9999)
Step 7 : Create a label encoders for categorical variables and split the data set to train & test, further split the train data set to Train and Validate
#create label encoders for categorical features
for var in cat_cols:
 number = LabelEncoder()
 fullData[var] = number.fit_transform(fullData[var].astype('str'))

#Target variable is also a categorical so convert it
fullData["Account.Status"] = number.fit_transform(fullData["Account.Status"].astype('str'))

train=fullData[fullData['Type']=='Train']
test=fullData[fullData['Type']=='Test']

train['is_train'] = np.random.uniform(0, 1, len(train)) <= .75
Train, Validate = train[train['is_train']==True], train[train['is_train']==False]
Step 8 : Pass the imputed and dummy (missing values flags) variables into the modelling process. I am using random forest to predict the class
features=list(set(list(fullData.columns))-set(ID_col)-set(target_col)-set(other_col))
x_train = Train[list(features)].values
y_train = Train["Account.Status"].values
x_validate = Validate[list(features)].values
y_validate = Validate["Account.Status"].values
x_test=test[list(features)].values
random.seed(100)
rf = RandomForestClassifier(n_estimators=1000)
rf.fit(x_train, y_train)
Step 9 : Check performance and make predictions
status = rf.predict_proba(x_validate)
fpr, tpr, _ = roc_curve(y_validate, status[:,1])
roc_auc = auc(fpr, tpr)
print roc_auc

final_status = rf.predict_proba(x_test)
test["Account.Status"]=final_status[:,1]
test.to_csv('C:/Users/Analytics Vidhya/Desktop/model_output.csv',columns=['REF_NO','Account.Status'])
And Submit!
Frequently Asked Questions
A. A prediction model in Python is a mathematical or statistical algorithm used to make predictions or forecasts based on input data. It utilizes machine learning or statistical techniques to analyze historical data and learn patterns, which can then be used to predict future outcomes or trends. Python provides various libraries and frameworks for building and deploying prediction models efficiently.
A. The three types of prediction are:
1. Classification: Predicting the class or category that an input belongs to, based on training data with labeled examples.
2. Regression: Predicting a continuous numerical value as an output, aiming to find a relationship between input variables and the target variable.
3. Time series forecasting: Predicting future values based on the patterns and trends observed in historical time series data.
End Notes
Hopefully, this article would give you a start to make your own 10-min scoring code. Most of the masters on Kaggle and the best scientists on our hackathons have these codes ready and fire their first submission before making a detailed analysis. Once they have some estimate of benchmark, they start improvising further. Share your complete codes in the comment box below.
Did you find this article helpful? Please share your opinions / thoughts in the comments section below.
If you like what you just read & want to continue your analytics learning, subscribe to our emails, follow us on twitter or like our facebook page.
I am a Business Analytics and Intelligence professional with deep experience in the Indian Insurance industry. I have worked for various multi-national Insurance companies in last 7 years.


Hello I'm completely new, and I'm a bit lost. 1. By example, where I can find the train.csv and test.csv ? 2. This instruction "fullData.describe() #You can look at summary of numerical fields by using describe() function" ought to show me a resume of dataset but I can't see nothing. 3. When I try the code I get an error in line num_cols= list(set(list(fullData.columns))-set(cat_cols)-set(ID_col)-set(target_col)-set(data_col)) because the data_col is not defined. It's an error ? Sorry for my silly question.
Beauuuuuuuutiful! Just what I was looking for; practical application. I can't wait to give it a try. Thank you
Hi Sunil, Thanks for the neat workflow, which I am sure will be helpful to many. But I couldnt get the logic behind encoding the target variable with LabelEncoder as well. How does it help in better prediction? Can you explain the same please? Thanks.
hi,sunil.. Can you tell me where i can download the 'challenge\train.csv' and 'challenge\test.csv' datasets? Thank you.
The line roc_auc = auc(fpr, tpr) is giving me an error when I tried to run the code. I do not see any auc() function being defined. Is it an inbuild function? Can you please explain?