“The biggest religion in the world is not even a religion.” – Fernando Torres
Spanish footballing giant Sevilla FC together with FC Bengaluru United, one of India’s most exciting football teams have launched a Football Hackathon – Data-Driven Player Performance Assessment. This Hackathon will be a unique opportunity to effectively use data science in the space of professional football scouting and player performance analysis and enhancement and are excited to have you on the journey.
Register for Football Hackathon NOW!
Introduction
Football is loved by all and its beauty lies in its Unpredictable nature. One thing which is strongly associated with this game is its fans, brooding and debating before a game over who will win the game. And some fans even go to the limit of speculating the scoreline before the match. So let`s try to answer some of these questions logically.
Getting to know Poisson
Well as I have said earlier football is an unpredictable game, a goal can occur at any moment in the match totally random having no dependencies on previous goals or teams or any other factors. Wait did I say “Random”. Because there is a distribution in statistics that is used for finding the probabilities of randomly occurring events, Poisson Distribution.
Suppose your friend says that on average 2 goals happen per game, well, is he right? If right then what are the actual chances of seeing two goals in a match? Here comes to our rescue Poisson distribution helps us to find the probability of observing ‘n’ events (read ‘n’ goals) in a fixed time period given that we provide it with the expectation of events occurring (average events per time period). Let`s see it mathematically once
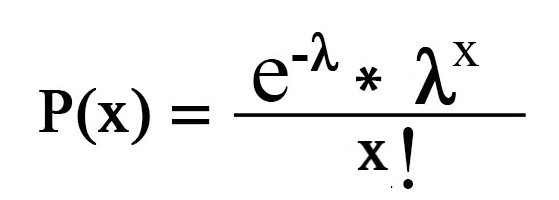
(where λ = average events per time period)
Chances of Scoring
Now let`s answer some questions with this equation, but first we need data, so for this I downloaded the International football results from 1872 to 2020 data from Kaggle. A sample of our dataset is shown below.
Let`s start with finding the average goals we can expect within 90 minutes.
For this, I have created a separate dataset filtering out data for matches played in the 21st century(2000-2020) and added the home_score and away_score to find out the total no. of goals occurring in each match and then taken the mean of the total goals column to get the average goals we can expect in a match.
Python Code:
import pandas as pd
data = pd.read_csv('data.csv')
print('First 5 rows:')
print(data.head())

data['total_goals']=data['home_score']+data['away_score']
data['date']=data['date'].apply(lambda x : int(str.split(x,'-')[0]))
rec_data=data.loc[(data['date']>=2000)]
rec_data.iloc[[rec_data.total_goals.argmax()]]
print('Mean of Total Goals:')
print(rec_data.total_goals.mean())
Now putting this expectation in Poissson Distribution formula let`s see what are the actual chances of seeing 3 goals in a match.
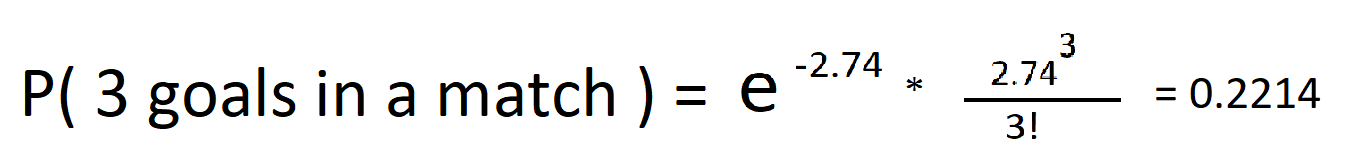
Wow, only a mere 22% chance. Let`s plot the probabilities of the no. of goals in a match to get a better picture.
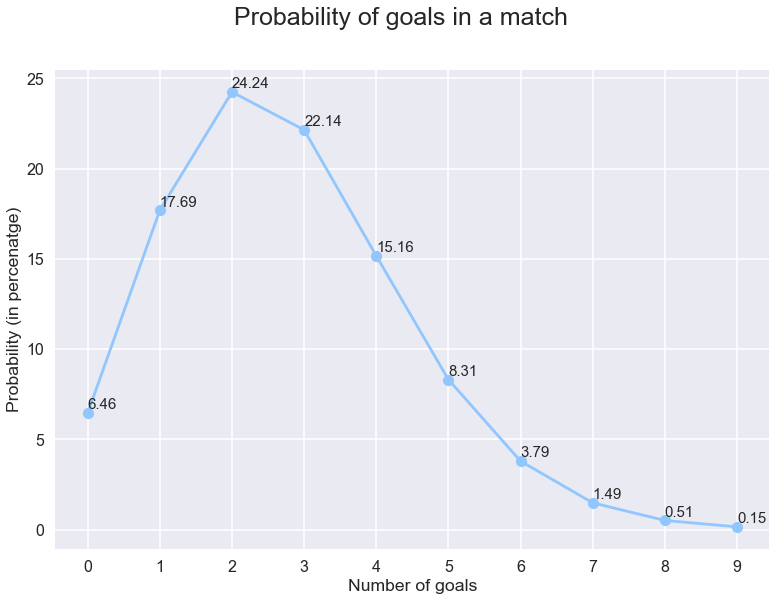
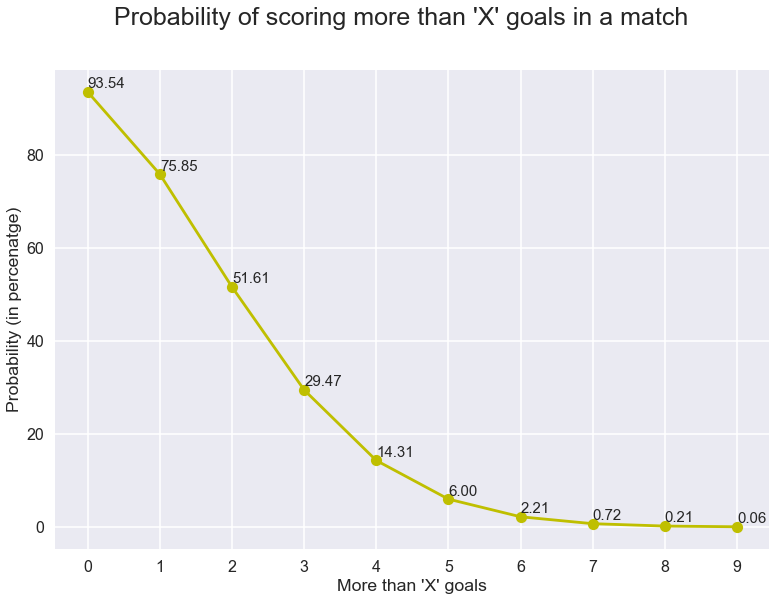
Now from this, we can calculate the probability of seeing ‘x ‘or fewer number of goals simply by adding the probabilities of ‘x’ and the numbers which are less than ‘x’.And by just subtracting this from 1 we can get the probability of seeing more than ‘x’ goals in a match. Let`s plot this too.
The wait is over…
Now suppose you have an impatient friend who does not want to sit for the whole game. And he comes to you during a match and asks how much time does he has to wait to see a goal. Woah, that`s a tough question right, but worry not, ask him to sit through 10000 games and note the time between each goal. Just kidding, obviously, he would freak out. Actually I simulated 10000 matches and found out the average time.
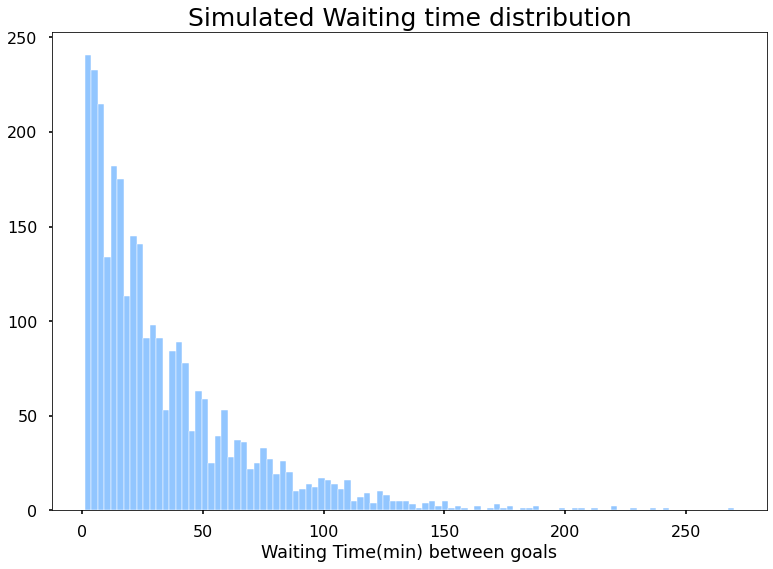
The most likely waiting time is 2 minutes. But wait this not actually what I was looking for, I want the average time that I have to wait to see a goal if I start watching the game at a random time. For that, I will take 10000 instances, where each instance is watching 10000 games and calculating the average waiting time between goals in that 10000 games and reporting us. Finally, I will be plotting those 10000 reports from each of my instances and find out the expected average waiting time.
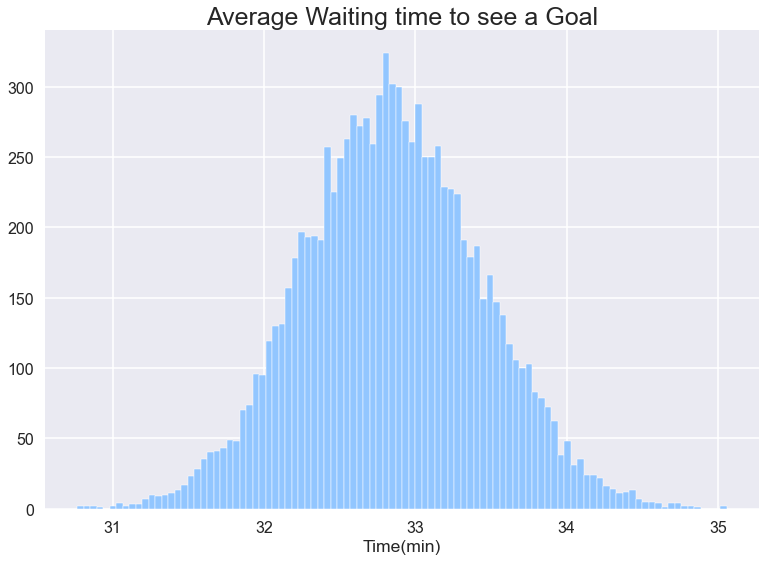
It looks like we have to wait for 33 minutes approx. However we may have to wait for more, this is a classic Waiting Time Paradox.
Predicting the scoreline
Finally, let`s do the question with which we started and the most exciting question that who will win and what will be the scoreline to be precise.
For this, I will use the history between two teams (let them consider as the home team and away team) and take the average_home_score as the expected goals for the home team and average_away_score as the expected goals for the away team and predict the scoreline using Poisson distribution. In case the teams have fewer encounters between them, we will consider a few factors
HS = Mean of home goals scored by the home team throughout history.
AS = Mean of away goals scored by away team throughout history.
HC = Mean of goals conceded in home matches by the home team.
AC = Mean of goals conceded in away matches by the away team.
So, the Home team’s expected score will be calculated as (HS + AC) / 2
So, the Away team’s expected score will be calculated as (AS + HC) / 2
Wait, the expected score is not the predicted score. The expected score is the average number of goals we expect them to score in a game between them.
code:
def PredictScore():

    home_team = input("Enter Home Team: ")
    ht = (''.join(home_team.split())).lower()
    away_team = input("Enter Away Team: ")
    at = (''.join(away_team.split())).lower()

    if len(data[(data.home_team ==ht) & (data.away_team ==at)]) > 20:

        avg_home_score = data[(data.home_team ==ht) & (data.away_team ==at)].home_score.mean()
        avg_away_score = data[(data.home_team ==ht) & (data.away_team ==at)].away_score.mean()

        home_goal = int(stats.mode(np.random.poisson(avg_home_score,100000))[0])
        away_goal = int(stats.mode(np.random.poisson(avg_away_score,100000))[0])

    else:
        avg_home_goal_conceded = data[(data.home_team ==ht)].away_score.mean()
        avg_away_goal_scored   = data[(data.away_team ==at)].away_score.mean()
        away_goal = int(stats.mode(np.random.poisson(1/2*(avg_home_goal_conceded+avg_away_goal_scored),100000))[0])

        avg_away_goal_conceded = data[(data.home_team ==at)].home_score.mean()
        avg_home_goal_scored   = data[(data.away_team ==ht)].home_score.mean()
        home_goal = int(stats.mode(np.random.poisson(1/2*(avg_away_goal_conceded+avg_home_goal_scored),100000))[0])

    avg_total_score = int(stats.mode(
        np.random.poisson((data[(data.home_team==ht) &    (data.away_team==at)].total_goals.mean()),100000))[0])

    print(f'Expected total goals are {avg_total_score}')
    print(f'They have played {len(data[(data.home_team ==ht) & (data.away_team ==at)])} matches')
    print(f'The scoreline is {home_team} {home_goal}:{away_goal} {away_team}')
Let`s try with Brazil as the home team and Mexico as the away team.
code:
PredictScore()
.png)
Poisson Distribution gives us a prediction of Brazil winning with a 2-0 scoreline. I searched the net and found that the last match between them was played on 2 Jul 2018 and the scoreline says Brazil won by 2-0. Well, I got lucky, you may not.
Conclusion
If you want to explore further no worry, here is my code. Furthermore, this is just a basic way of predicting the game, nowadays classification algorithms are used to predict the outcome and regression algorithms to predict the scoreline. But That`s the topic for another day, till then have fun playing with this. Adios!


hi, thanks for the sharing just wonder how you do the simulation to get the mean-waiting-time to see a gobal, base on the Lamda=2.74 ? thanks Johnny
hi thanks for sharing may i know the detail about how you do the simulation for geting the mean-wait-time to see one goal ? base on the landa=2.74 ? thanks Johnny