When we try to infer something from what we have heard or read, the first step we do is relate a few of the parameters or scenes, etc. with each other and then proceed. Correlation means to find out the association between the two variables and Correlation coefficients are used to find out how strong the is relationship between the two variables. The most popular correlation coefficient is Pearson’s Correlation Coefficient. It is very commonly used in linear regression.
This article was published as a part of the Data Science Blogathon.
Pearson Correlation Coefficient (r), often denoted as r, measures the strength and direction of a linear relationship between two continuous variables. It ranges from -1 to 1, where:

Consider the example of car price detection where we have to detect the price considering all the variables that affect the price of the car such as carlength, curbweight, carheight, carwidth, fueltype, carbody, horsepower, etc.
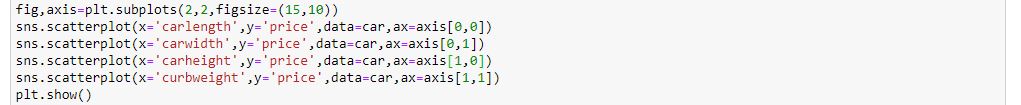
Correlation can be found out between continuous variables using python:
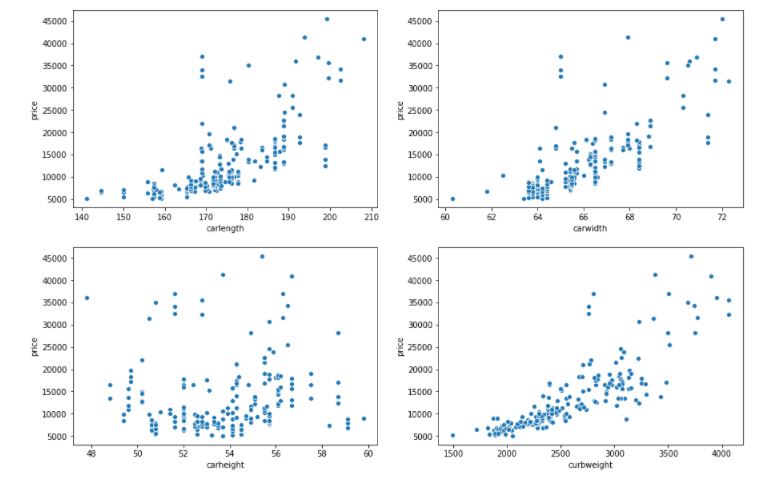
We can see in the above scatterplot, as the carlength, curbweight, carwidth increases price of the car also increases. So, we can say that there is a positive correlation between the above three variables with car price. Here, we also see that there is no correlation between the carheight and car price.
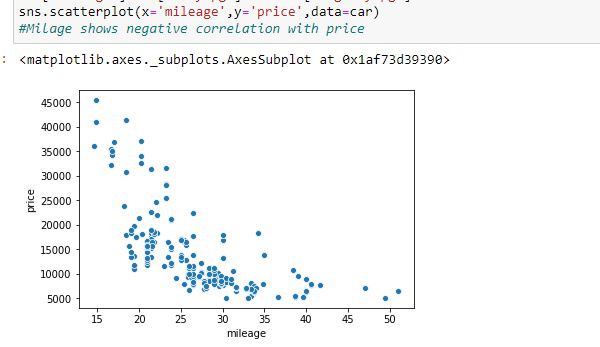
Cars with high prices have very low mileage as compared to the low range of cars. Hence, in this case, we can say that there is a negative correlation between car price and mileage.
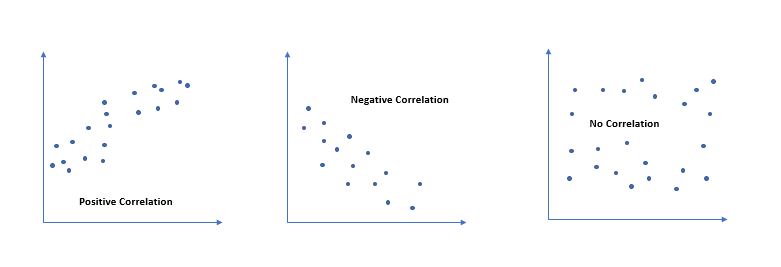
Value of ‘r’ ranges from ‘-1’ to ‘+1’. Value ‘0’ specifies that there is no relation between the two variables. A value greater than ‘0’ indicates a positive relationship between two variables where an increase in the value of one variable increases the value of another variable. Value less than ‘0’ indicates a negative relationship between two variables where an increase in the value of one decreases the value of another variable.
Pearson correlation draws a line of best fit through two variables, indicating the distance of data points from this line. A ‘r’ value near +1 or -1 implies all data points are close to the line. An ‘r’ value close to ‘0’ suggests data points are scattered around the line.
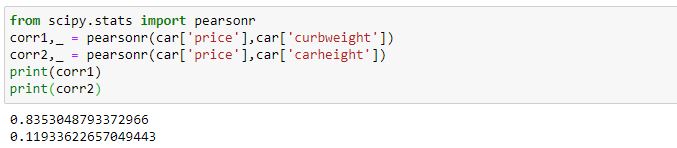
Considering the same example of the car price, let’s find out the ‘r’ value using ‘pearsonr’ function in python.
As stated earlier, the value of Pearson correlation for Price vs Curbweight is 0.835 and as there is no correlation between Price and Carheight, hence the Pearson Correlation value between Price & Carheight is near to 0 which is 0.12.
Understanding Pearson’s Correlation Coefficient is foundational for anyone delving into statistics or data analysis. This guide has demystified the calculation and interpretation of r, offering insights into the strength and direction of linear relationships between variables. Armed with this knowledge, beginners can make informed decisions about data relationships. As a widely used statistical tool, Pearson’s Correlation Coefficient provides a valuable entry point into quantitative analysis, unlocking possibilities for deeper exploration and comprehension of data patterns. Embrace the power of correlation to unravel meaningful insights from your datasets.
A. Pearson correlation measures the strength and direction of the linear relationship between two continuous variables. It provides a value between -1 and 1, where 1 indicates a perfect positive linear relationship, -1 indicates a perfect negative linear relationship, and 0 indicates no linear relationship.
A. Pearson correlation is used in research to assess the degree of association between two continuous variables. It helps researchers understand how changes in one variable correspond to changes in another, facilitating insights into patterns, trends, and potential dependencies within the data.
A. Pearson correlation measures the strength and direction of the linear relationship between two continuous variables, assuming that the relationship is linear and variables are normally distributed. Spearman correlation, on the other hand, measures the strength and direction of the monotonic relationship between two variables, making it suitable for non-linear relationships and ordinal data. While Pearson correlation assesses linear associations, Spearman correlation assesses monotonic associations.
A. The interpretation of the Pearson correlation coefficient (R) depends on the context and the field of study. Generally, an R value close to 1 or -1 indicates a strong linear relationship, while an R value close to 0 indicates a weak linear relationship or no linear relationship at all. However, what constitutes a “good” correlation can vary based on the specific research question, the nature of the variables being studied, and the domain-specific standards or guidelines.
The media shown in this article is not owned by Analytics Vidhya and is used at the Author’s discretion.
Lorem ipsum dolor sit amet, consectetur adipiscing elit,


