Beginner’s Guide To Decision Tree Classification Using Python
Introduction
There are various algorithms in Machine learning for both regression and classification problems, but going for the best and most efficient algorithm for the given dataset is the main point to perform while developing a good Machine Learning Model.
One of Such algorithms good for both classification/categorical and Regression problems is the Decision tree
Decision Trees usually implement exactly the human thinking ability while making a decision, so it is easy to understand.
The logic behind the decision tree can be easily understood because it shows a flow chart type structure /tree-like structure which makes it easy to visualize and extract information out of the background process
Learning Objective
- What Is Decision Classification Tree Algorithm
- How to build a decision tree from scratch
- Terminologies related to decision tree
- Difference between random forest and decision tree
- Python Code Implementation of decision trees
This article was published as a part of the Data Science Blogathon.
Table of contents
What is a Decision Tree?
A Decision Tree is a supervised Machine learning algorithm. It is used in both classification and regression algorithms. The decision tree is like a tree with nodes. The branches depend on a number of factors. It splits data into branches like these till it achieves a threshold value. A decision tree consists of the root nodes, children nodes, and leaf nodes.
Let’s Understand the decision tree methods by Taking one Real-life Scenario
Imagine that you play football every Sunday and you always invite your friend to come to play with you. Sometimes your friend actually comes and sometimes he doesn’t.
The factor on whether or not to come depends on numerous things, like weather, temperature, wind, and fatigue. We start to take all of these features into consideration and begin tracking them alongside your friend’s decision whether to come for playing or not.
You can use this data to predict whether or not your friend will come to play football or not. The technique you could use is a decision tree. Here’s what the decision tree would look like after implementation:
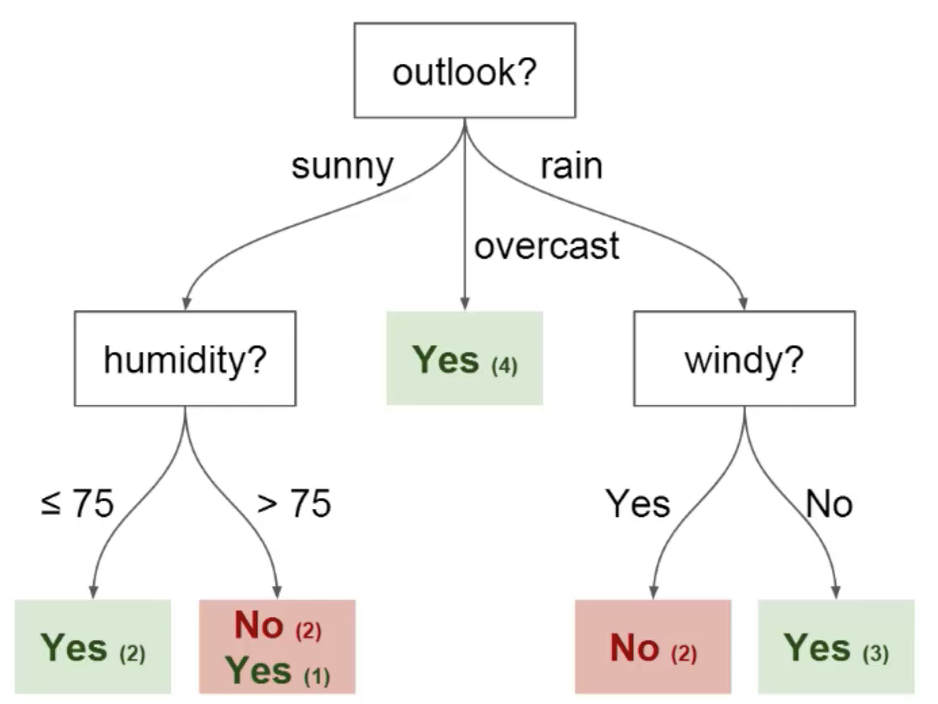
Elements Of a Decision Tree
Every decision tree consists following list of elements:
- Nodes: It is The point where the tree splits according to the value of some attribute/feature of the dataset
- Edges: It directs the outcome of a split to the next node we can see in the figure above that there are nodes for features like outlook, humidity and windy. There is an edge for each potential value of each of those attributes/features.
- Root: This is the node where the first split takes place
- Leaves: These are the terminal nodes that predict the outcome of the decision tree
How to Build Decision Trees from Scratch?
While building a Decision tree, the main thing is to select the best attribute from the total features list of the dataset for the root node as well as for sub-nodes. The selection of best attributes is being achieved with the help of a technique known as the Attribute selection measure (ASM).
With the help of ASM, we can easily select the best features for the respective nodes of the decision tree.
There are two techniques for ASM:
Information Gain
Information gain assesses entropy changes post dataset splitting by an attribute, indicating the information a feature provides. Based on this measure, nodes are split during decision tree building. The decision tree aims to maximize information gain, prioritizing nodes with the highest values. The information gain is calculated using the formula below:
Information Gain= Entropy(S)- [(Weighted Avg) *Entropy(each feature)
Entropy: Entropy signifies the randomness in the dataset. It is being defined as a metric to measure impurity. Entropy can be calculated as:
Entropy(s)= -P(yes)log2 P(yes)- P(no) log2 P(no)
Where,
- S= Total number of samples
- P(yes)= probability of yes
- P(no)= probability of no.
Gini Index
Gini index is also being defined as a measure of impurity/ purity used while creating a decision tree in the CART(known as Classification and Regression Tree) algorithm.
An attribute having a low Gini index value should be preferred in contrast to the high Gini index value.
It only creates binary splits, and the CART algorithm uses the Gini index to create binary splits.
Gini index can be calculated using the below formula:
Gini Index= 1- ∑jPj2
Where pj stands for the probability
How Does the Decision Tree Algorithm works?
The basic idea behind any decision tree algorithm is as follows:
- Select the best Feature using Attribute Selection Measures(ASM) to split the records.
- Make that attribute/feature a decision node and break the dataset into smaller subsets.
- Start the tree-building process by repeating this process recursively for each child until one of the following condition is being achieved :
- All tuples belonging to the same attribute value.
- There are no more of the attributes remaining.
- There are no more instances remaining.

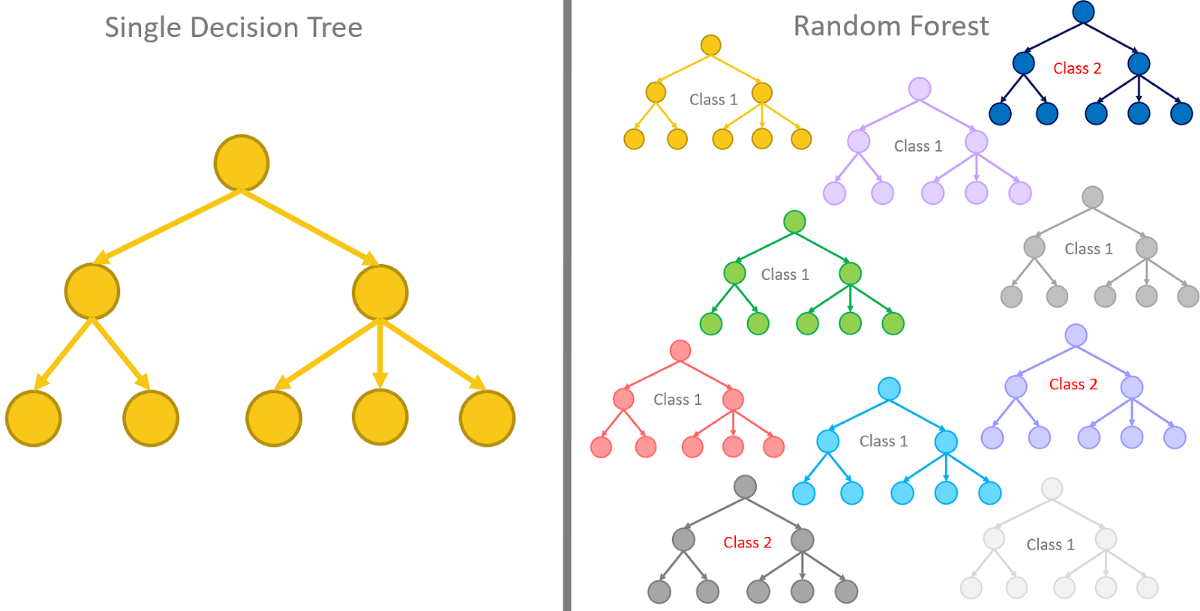
Decision Trees and Random Forests
Random Forest and Decision Trees are both the tree methods that are being used in Machine Learning.
Decision trees are the Machine Learning models used to make predictions by going through each and every feature in the data set, one-by-one.
Random forests on the other hand are a collection of decision trees being grouped together and trained together that use random orders of the features in the given data sets.
Instead of relying on just one decision tree, the random forest takes the prediction from each and every tree and based on the majority of the votes of predictions, and it gives the final output. In other words, the random forest can be defined as a collection of multiple decision trees.
Advantages of the Decision Tree
- It is simple to implement and it follows a flow chart type structure that resembles human-like decision making.
- It proves to be very useful for decision-related problems.
- It helps to find all of the possible outcomes for a given problem.
- There is very little need for data cleaning in decision trees compared to other Machine Learning algorithms.
- Handles both numerical as well as categorical values
Disadvantages of the Decision Tree
- Too many layers of decision tree make it extremely complex sometimes.
- It may result in overfitting ( which can be resolved using the Random Forest algorithm)
- For the more number of the class labels, the computational complexity of the decision tree increases.
Python Code Implementation
Numerical computing libraries and Loading Data
Exploratory Data Analysis
raw_data.info()
sns.pairplot(raw_data, hue = 'Kyphosis').png)
Split the Data Set into Training Data and Test Data
from sklearn.model_selection import train_test_split
x = raw_data.drop('Kyphosis', axis = 1)
y = raw_data['Kyphosis']
x_training_data, x_test_data, y_training_data, y_test_data = train_test_split(x, y, test_size = 0.3)
Train the Decision Tree Model
from sklearn.tree import DecisionTreeClassifier
model = DecisionTreeClassifier()
model.fit(x_training_data, y_training_data)
predictions = model.predict(x_test_data)
Measure the performance of the decision tree model
from sklearn.metrics import classification_report
from sklearn.metrics import confusion_matrix
print(classification_report(y_test_data, predictions))
print(confusion_matrix(y_test_data, predictions))
Conclusion
Decision trees stand out as a versatile and interpretable tool in machine learning, adept at both classification and regression tasks. Their human-like decision-making structure facilitates clear understanding and problem-solving. While advantageous for decision-related problems, decision trees may face challenges with complexity and overfitting.
For those eager to delve deeper into the intricacies of machine learning and decision tree algorithms, consider joining our AI/ML Blackbelt Plus Program. This program offers in-depth learning, hands-on projects, and expert guidance, providing an opportunity to master decision trees, explore advanced algorithms, and enhance your proficiency in data science. Elevate your career in artificial intelligence and machine learning through our comprehensive learning experience!
Frequently Asked Questions
A. Python decision tree classifier is a machine learning model for classification tasks. It segments data based on features to make decisions and predict outcomes.
A. Install scikit-learn library using “pip install scikit-learn” for Python decision tree classifier.
A. A decision tree in Python classifies data by recursively splitting it based on features, forming a tree structure for efficient classification.
A. Implement a decision tree classifier in Python using scikit-learn’s DecisionTreeClassifier, specifying parameters and fitting the model to training data.
The media shown in this article is not owned by Analytics Vidhya and is used at the Author’s discretion.


