This article was published as a part of the Data Science Blogathon.
Table of Contents
- Introduction
- About streamlit
- Prerequisite, Set up, and Installation
- Developing your first streamlit app
- Building blocks of streamlit
- Advanced Features
- Conclusion
Introduction
Data Science is one of the most trending search topics on google these days. Because of its high demand and exhaustive usage in real-world applications, more and more developers in the community are developing new frameworks and libraries that help data scientists and researchers complete everyday tasks. One such library is streamlit. With streamlit, one can build data apps in no time. It seamlessly integrates with other python libraries like NumPy, Pandas, Matplotlib, and many more.
About Streamlit
Streamlit is an open-source python library that is useful to create and share data web apps. It is slowly gaining a lot of momentum in the data science community. Because of the ease with which one can develop a data science web app, many developers use it in their daily workflow. The streamlit GitHub repository has more than 14.1k stars and 1.2k forks. Under the hood, it uses React as a frontend framework to render the data on the screen. So, React Developers can easily manipulate the UI with few changes in the code.
Prerequisite, Setup, and Installation
To follow the rest of the post, please make sure you are familiarized with Python and meet the following requirements in your local dev environment.
- Python version >= 3.XXX (3.7 recommended)
- pip
- virtualenv
- Pycharm or any other Code Editor
Setup
Create a virtual environment using virtualenv in any directory of your choice. You can skip the below step if you are using pycharm IDE or you already know how to set it up for your project.
virtualenv env
source ./env/bin/activate
Create a requirement.txt file by typing the following command in the terminal
pip freeze > requirements.txt
Create a new python file app.py in the same directory.
Installation
To install streamlit in your python application, write the command below in the terminal-
pip install streamlit
Developing your first Streamlit app
Open the app.py file and copy the below code –
# import statements
import streamlit as st
import numpy as np
import pandas as pd
# adding title and text in the app
st.title('Hello World')
st.write("Welcome to your first streamlit application")
Run the app by typing the following command in terminal –
streamlit run app.py
your output should look similar to the screenshot below-
.png)
Building Blocks of Streamlit
The complete code and data files can be found on my GitHub repository.
Link: Medium-Blogs/streamlitBlog at master · karanjagota/Medium-Blogs (github.com)
In a nutshell, we develop a streamlit app in the same way as we write any python script. Streamlit provides widgets for user interaction and easy-to-use functions to render data on the screen. In this section, for each question asked, we will implement a suitable answer code –
How to display data on the screen?
Data in any Data Science web app traditionally can be a data frame, texts, charts, code, or media. Let’s look at the code to implement all the above in our app.
Open the app.py file and add the below code –
Code (Github Gist): display_data.py (github.com)
import streamlit as st import pandas as pd
import matplotlib.pyplot as plt
import seaborn as sns
from PIL import Image
import requests
#Title and Subheader
st.title("Life Expectancy By Country")
st.write("Life Expectancy Data of India and USA from the year 1960 till 2016.")
# Multicolumn Support
col1, col2 = st.beta_columns(2)
IN_flag = Image.open(r"c:UsersHPDesktopdataappIN.jpg")
col1.header("INDIA")
col1.image(IN_flag, use_column_width=True)
US_flag = Image.open(r"c:UsersHPDesktopdataappUS.png")
col2.header("USA")
col2.image(US_flag, use_column_width=True)
# reading a csv and displaying the first six rows on the screen.
df = pd.read_csv('lf.csv')
st.write(df.head())
# Display full data base on checkbox.
if st.checkbox('show full data'):
df
# Display Code
st.write('Displaying Code in Streamlit app')
with st.echo():
# square function
def square(x):
print(x*x)
# cube function
def cube(x):
print(x*x*x)
square(5) #output 25
cube(5) # output 125
|
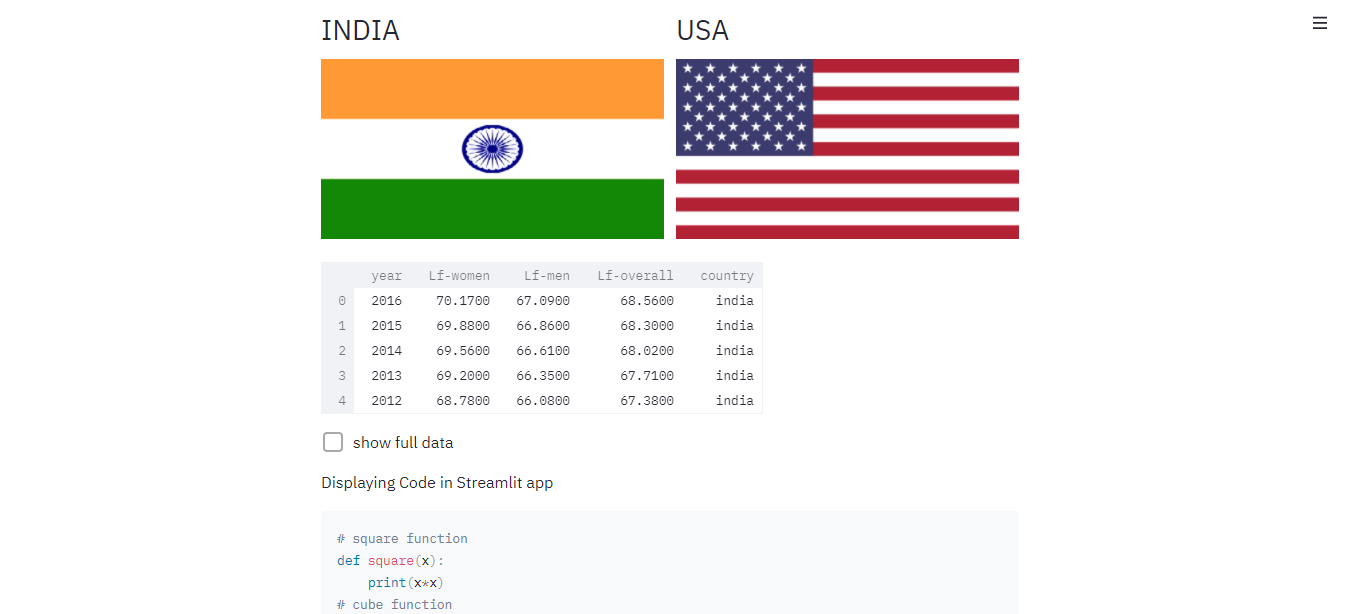
Streamlit provides easy-to-use functions to write data on the screen. We use the title and write method from the streamlit library to display it in the app. You can also see in the above code that we first load the dataset in a data frame from the CSV file using the Pandas package, then render the first six rows of the data frame onto the screen. We also display the Image using the pillow library. The echo command of the streamlit library provides us with a way to add code to our app.
How to add Interactive Widgets on the screen?
Widgets allow you to add interactivity to your Data web app. Streamlit provides buttons, checkboxes, input texts, sidebars, and many more as widgets that let users interact with the data through UI directly without implementing code. Let’s look at each in the below code. Add the below code in the app.py file.
Code (Github gist): streamlit_barplot.py (github.com)
# Display barplot and data on search Input
_input = st.text_input("Enter Year to Search")
if _input:
    _df = df[df['year'] == int(_input)]
    if len(_df['year'])>0:
        _df
    if len(_df['year'])>0:
        sns.set_theme(style="whitegrid")
        fig, ax = plt.subplots()
        fig = plt.figure(figsize=(7, 4))
        ax = sns.barplot(data=_df, y="Lf-overall", x="year", hue="country", palette="tab20_r")
        st.pyplot(fig)
    else:
        st.write('Data Does Not Exist in the Database')
output
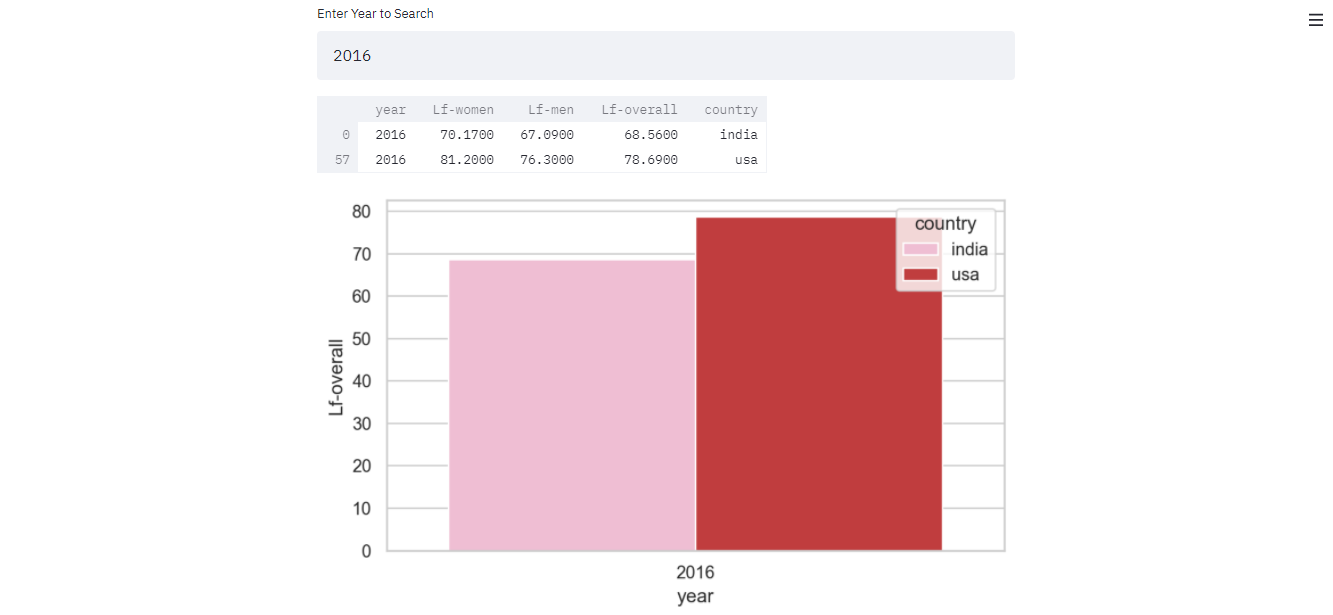
With the input text widget, we have created a search functionality within the Data Frame through which we can calculate and plot the graph of the Life Expectancy of India and the USA.
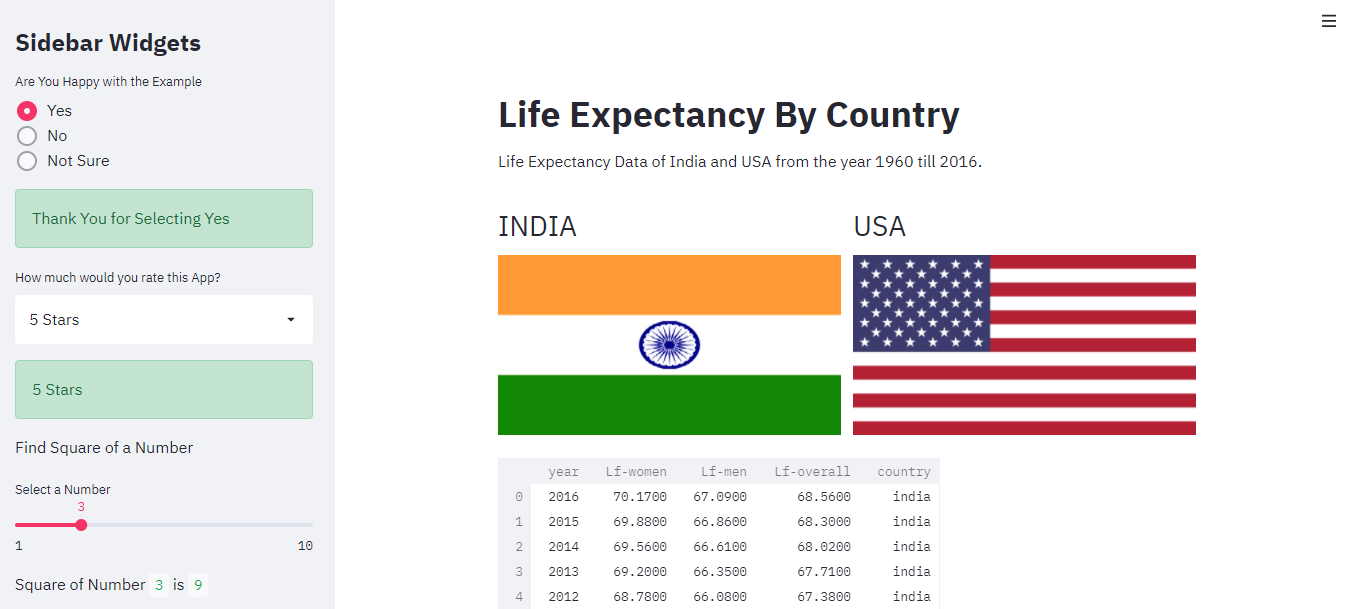
Streamlit also provides a way to add information and widgets on the sidebar, just like many modern-day web apps. Let’s add some more interactive widgets to the app on the sidebar. Add the below code in the app.py file.
Code (Github gist): sidebar_widget.py (github.com)
# Sidebar Column
st.sidebar.title('Sidebar Widgets')
#radio button
rating = st.sidebar.radio('Are You Happy with the Example',('Yes','No','Not Sure'))
if rating == 'Yes':
    st.sidebar.success('Thank You for Selecting Yes')
elif rating =='No':
    st.sidebar.info('Thank You for Selecting No')
elif rating =='Not Sure':
    st.sidebar.info('Thank You for Selecting Not sure')
#selectbox
rating = st.sidebar.selectbox("How much would you rate this App? ",
                     ['5 Stars', '4 Stars', '3 Stars','2 Stars','1 Star'])
st.sidebar.success(rating)
st.sidebar.write('Find Square of a Number')
#slider
get_number = st.sidebar.slider("Select a Number", 1, 10)
st.sidebar.write('Square of Number',get_number, 'is', get_number*get_number)
output
How to display API data on the screen?
With streamlit, it is also possible to fetch and display data from the restful APIs. If one knows a little bit of react.js, one can even use it to build web apps. But the relevance and implementation of that topic are beyond the scope of this post.
In this part, we will create a URL shortener app that takes the URL from the user and fetches the response from the cleanuri.com API and displays it to the screen. Add the code in the app.py file to get the desired output.
Code (Github gist): get_apidata.py (github.com)
# displaying API data
API_URL = 'https://cleanuri.com/api/v1/shorten'
st.subheader('URL SHORTNER')
_url = st.text_input('Enter URL')
pressed = st.button('Get Short Link')
if pressed:
    if _url !='':
        data = {'url': _url}
        r = requests.post(API_URL, data=data)
        st.write(r.json())
    else:
        st.write('Please enter the right URL first')
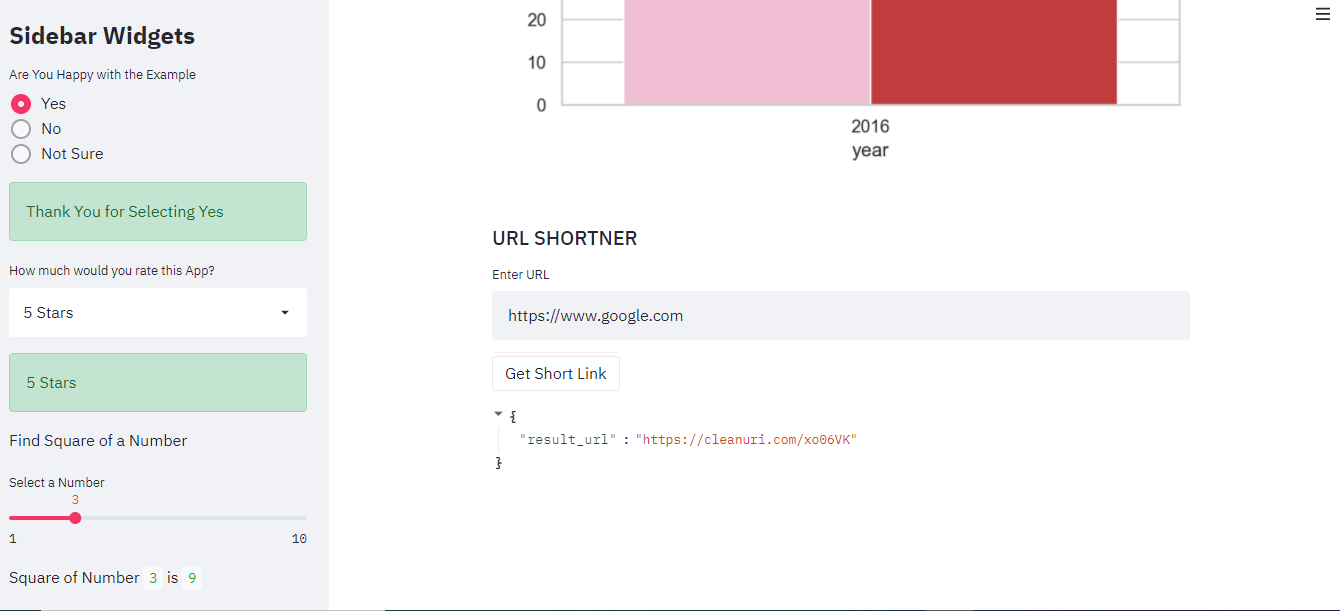
The code is pretty much self-explanatory. We use the requests package to make the post request to the ‘cleanuri.com’. Once we get the short URL, we display it as JSON in the app.
Conclusion
Streamlit is one of the fastest ways to develop and deploy machine Learning powered data-driven web apps. In the above post, we learned the following things-
- Building blocks of streamlit
- Briefly discussed some of the most common methods and widgets provided by the library.
- We also created a URL shortener feature using the free cleanuri.com API
The media shown in this article are not owned by Analytics Vidhya and is used at the Author’s discretion.


I have developed a streamlit application for AI/ML requriement. but i would like to deploy this application on to a linux server using NGINX i could not find any solid examples in the internet. It would be great if you can come up with detailed explanation regarding the same