Before making you understand the broad category of Supervised and Unsupervised Let me narrate a story. You have an exam, before the exam, you went to the teacher to ask hard questions so that you can prepare well. Your teacher replied, “All numerical questions in the paper are definitely hard”. You went back home, took all past year papers, and identified all questions with numerical ones as hard. You made a list that had the only hard questions.
“What did you do?”
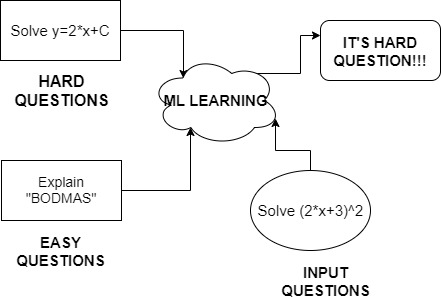
You did Supervised Learning. Supervised Learning involves learning features along with labels. Then analyzing features of unknown data and giving it a label. In our story you learned features such as questions with numerical values then you read the paper and gave a label of “hard” to every numerical question.
Now it’s time for the teacher to check papers. While checking she noticed a pattern that from 5 questions 2,3, and 1 are attempted by everyone while few had attempted 4th and 5th question. She figured out that “4th and 5th” questions are numerical whereas 1,2,3 are non-numerical ones.
This wasn’t mentioned anywhere so what did the teacher do? She did Unsupervised Learning.
Unsupervised Learning only has features but no labels. This learning involves latent features which imply learning from hidden features which are not directly mentioned. In our case, the latent feature was the “attempt of a question”.
Supervised Learning has Regression and Classification models. Unsupervised has Clustering algorithms.
This involves working with continuous data. We look at all features and they are said to be independent variables, the target is our dependent variable (which depends on all independent variables). Making it easy, we establish a relationship between features and a target value, and then to obtain a new target value we keep new features in our obtained relationship.
Let us assume the following data in series:
(x,y)={(5,30),(6,36),(7,42),(8,48)}
x=number of questions attempted
y=marks obtained
It can easily be analyzed that there is a linear relationship between data that is y=5*x
we can easily plot this data. Let’s take a second scenario in which you have features such as
“Questions attempted Subject, Name of teacher, Total Questions and others. You plot the values between “Marks Obtained and Questions Attempted”
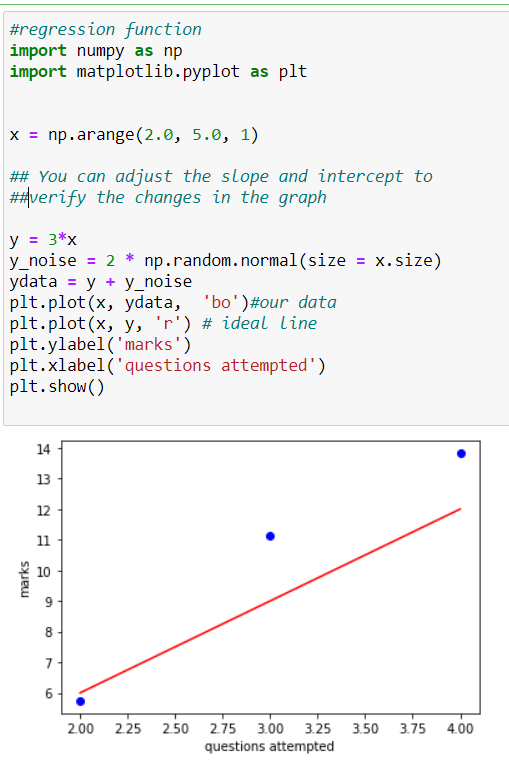
You notice some sort of relationship between the attempt of question and marks obtained, say,y=beta0*x+beta1. You will then assume a linear relationship and plot it(this will be an ideal line). Nextstep is to keep changing values of beta0 and beta1 to obtain the best fit line. This step should minimize errors between the ideal line and obtained line.
Here’s a code for you to try:
A Classifier is used to label an example as belonging to one of a finite set of categories. The categories are said to be classes. A binary class may involve whether the question is hard or not. Is e-mail spam or not
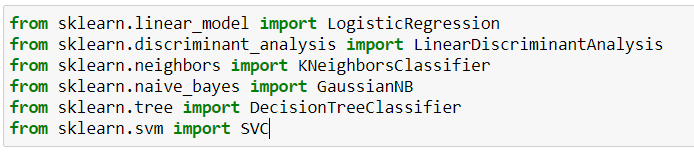
There are 6 types of classification algorithm:
The good news is you can import all these classifiers from Scikit-Learn. Here’s how:
Example: Predicting wine quality. For the bad quality, it is 0, for the good it is 1. Some pre-processing of data was done which is not shown in this code. This code will give you insight into how to use classification models.
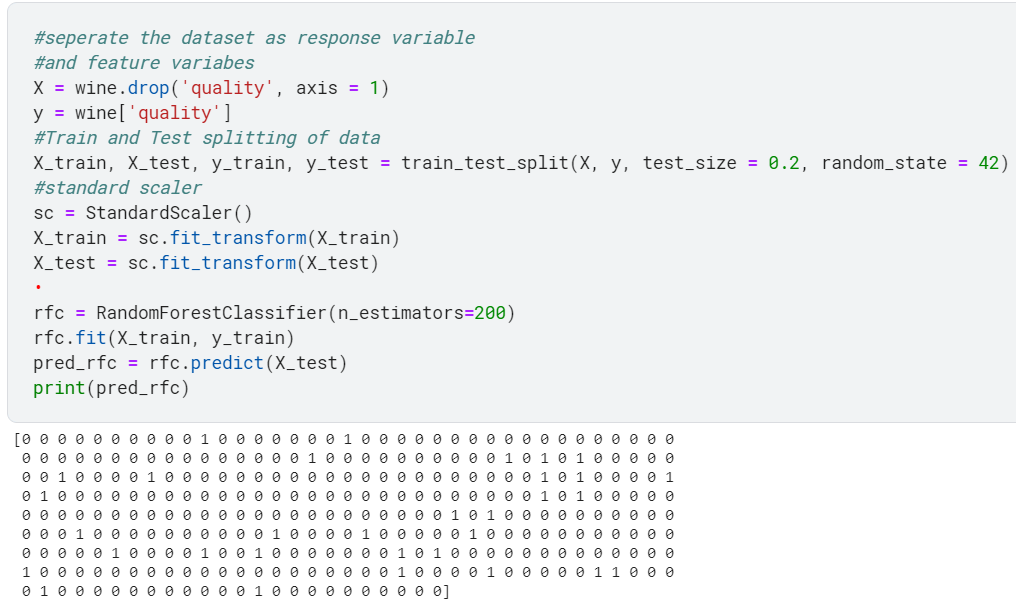
Our earlier example :Any question with numerical values in it is said to be hard.
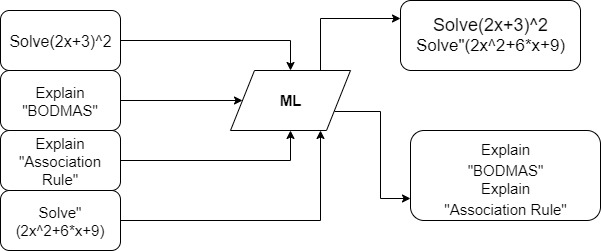
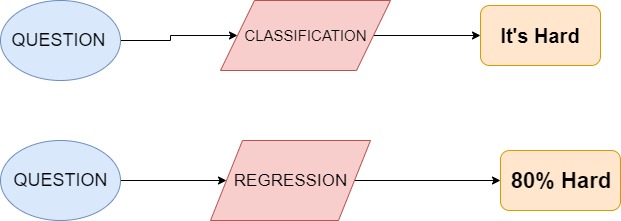
To understand the difference between Classification and Regression take a look at the picture below:
This makes groups of the available data. All data with similar features are put into the same group. The features of new data are analyzed and are given a group having matching features.
To gain insights into the paper patterns you decide to look at all past year papers while your friend talks to all seniors. You identify your strengths are theory questions and you need to work on numerical ones. On the other hand, your friend realizes he has strong command but needs revision. To understand the toughness of paper there were different approaches but there was some conclusion learned by both of you.
Similarly, In Machine Learning Algorithms, we group examples to understand datasets.
To make groups we need to figure out the similarity between examples. The similarity is obtained with the help of features in data and calculating the similarity between them.
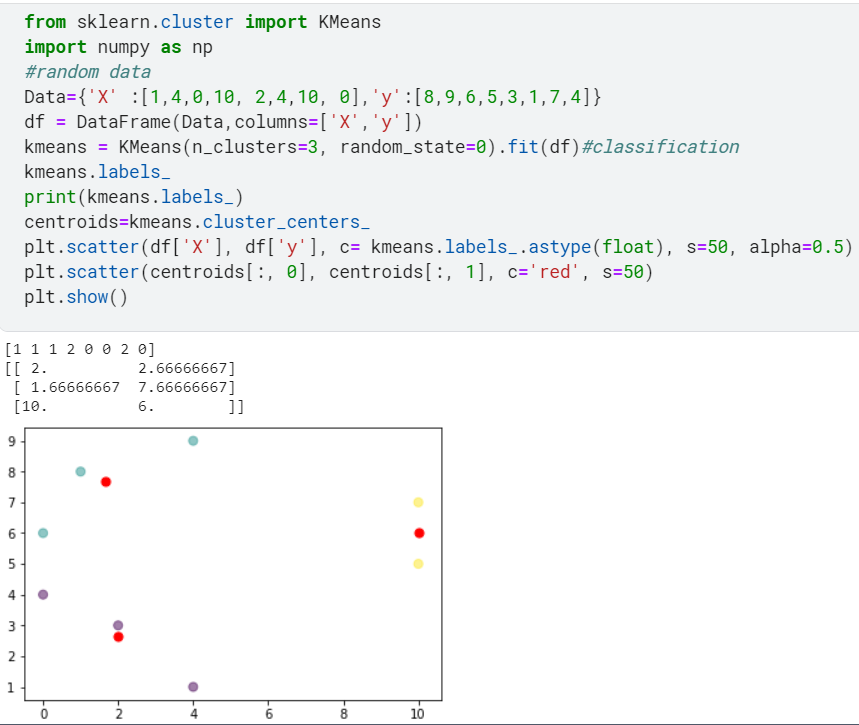
The given below code shows applying K-means on random data.
Now let’s know the difference between clustering and classification so that it doesn’t confuse you just like it did to me.
1.As Clustering is unsupervised we don’t have labels whereas in Classification we have labels.
2. Classification algorithms know the number of classes whereas Clustering isn’t aware of classes. It just makes new classes with new features.
This completes a basic understanding of Algorithms and you are set to work upon them and learn in-depth about other algorithms.
The media shown in this article are not owned by Analytics Vidhya and is used at the Author’s discretion.
Lorem ipsum dolor sit amet, consectetur adipiscing elit,


