5 Regression Algorithms you should know – Introductory Guide!
This article was published as a part of the Data Science Blogathon
Introduction
In Machine Learning, we use various kinds of algorithms to allow machines to learn the relationships within the data provided and make predictions based on patterns or rules identified from the dataset. So, regression is a machine learning technique where the model predicts the output as a continuous numerical value.

Source: https://www.hindish.com
Regression analysis is often used in finance, investing, and others, and finds out the relationship between a single dependent variable(target variable) dependent on several independent ones. For example, predicting house price, stock market or salary of an employee, etc are the most common
regression problems.
List of Top 5 Regression Algorithms
Here is a list of top 5 regression algorithms
- Linear Regression
- Decision Tree
- Support Vector Regression
- Lasso Regression
- Random Forest
Linear regression
Linear Regression is an ML algorithm used for supervised learning. Linear regression performs the task to predict a dependent variable(target) based on the given independent variable(s). So, this regression technique finds out a linear relationship between a dependent variable and the other given independent variables. Hence, the name of this algorithm is Linear Regression.
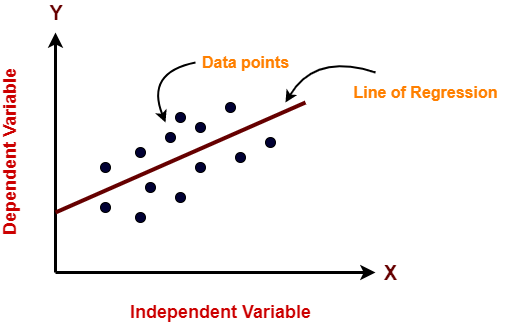
In the figure above, on X-axis is the independent variable and on Y-axis is the output. The regression line is the best fit line for a model. And our main objective in this algorithm is to find this best fit line.
Pros:
- Linear Regression is simple to implement.
- Less complexity compared to other algorithms.
- Linear Regression may lead to over-fitting but it can be avoided using some dimensionality reduction techniques, regularization techniques, and cross-validation.
Cons:
- Outliers affect this algorithm badly.
- It over-simplifies real-world problems by assuming a linear relationship among the variables, hence not recommended for practical use-cases.
Implementation
Python Code:
Decision Tree
The decision tree models can be applied to all those data which contains numerical features and categorical features. Decision trees are good at capturing non-linear interaction between the features and the target variable. Decision trees somewhat match human-level thinking so it’s very intuitive to understand the data.
Source: https://dinhanhthi.com
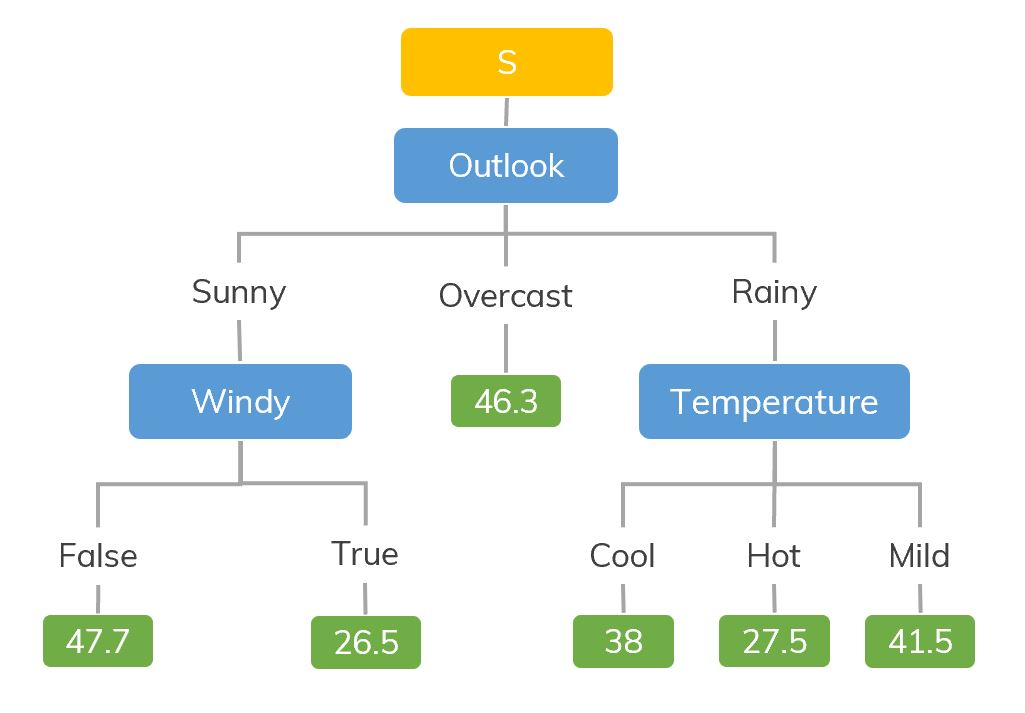
For example, if we are classifying how many hours a kid plays in particular weather then the decision tree looks like somewhat this above in the image.
So, in short, a decision tree is a tree where each node represents a feature, each branch represents a decision, and each leaf represents an outcome(numerical value for regression).
Pros:
- Easy to understand and interpret, visually intuitive.
- It can work with numerical and categorical features.
- Requires little data preprocessing: no need for one-hot encoding, dummy variables, etc.
Cons:
- It tends to overfit.
- A small change in the data tends to cause a big difference in the tree structure, which causes instability.
Implementation
import numpy as np
from sklearn.tree import DecisionTreeRegressor
rng = np.random.RandomState(1)
X = np.sort(5 * rng.rand(80, 1), axis=0)
y = np.sin(X).ravel()
y[::5] += 3 * (0.5 - rng.rand(16))
# Fit regression model
regr = DecisionTreeRegressor(max_depth=2)
regr.fit(X, y)
# Predict
X_test = np.arange(0.0, 5.0, 1)[:, np.newaxis]
result = regr.predict(X_test)
print(result)

Output:
[ 0.05236068  0.71382568  0.71382568  0.71382568 -0.86864256]
Support Vector Regression
You must have heard about SVM i.e., Support Vector Machine. SVR also uses the same idea of SVM but here it tries to predict the real values. This algorithm uses hyperplanes to segregate the data. In case this separation is not possible then it uses kernel trick where the dimension is increased and then the data points become separable by a hyperplane.
Source: https://www.medium.com
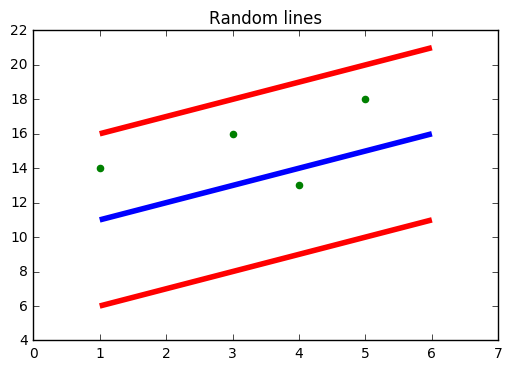
In the figure above, the Blue line is the Hyper Plane; Red Line is the Boundary Line
All the data points are within the boundary line(Red Line). The main objective of SVR is to basically consider the points that are within the boundary line.
Pros:
- Robust to outliers.
- Excellent generalization capability
- High prediction accuracy.
Cons:
- Not suitable for large datasets.
- They do not perform very well when the data set has more noise.
Implementation
from sklearn.svm import SVR
import numpy as np
rng = np.random.RandomState(1)
X = np.sort(5 * rng.rand(80, 1), axis=0)
y = np.sin(X).ravel()
y[::5] += 3 * (0.5 - rng.rand(16))
# Fit regression model
svr = SVR().fit(X, y)
# Predict
X_test = np.arange(0.0, 5.0, 1)[:, np.newaxis]
svr.predict(X_test)
Output:
array([-0.07840308,  0.78077042,  0.81326895,  0.08638149, -0.6928019 ])
Lasso Regression
- LASSO stands for Least Absolute Selection Shrinkage Operator. Shrinkage is basically defined as a constraint on attributes or parameters.
- The algorithm operates by finding and applying a constraint on the model attributes that cause regression coefficients for some variables to shrink toward a zero.
- Variables with a regression coefficient of zero are excluded from the model.
- So, lasso regression analysis is basically a shrinkage and variable selection method and it helps to determine which of the predictors are most important.
Pros:
- It avoids overfitting
Cons:
- LASSO will select only one feature from a group of correlated features
- Selected features can be highly biased.
Implementation
from sklearn import linear_model
import numpy as np
rng = np.random.RandomState(1)
X = np.sort(5 * rng.rand(80, 1), axis=0)
y = np.sin(X).ravel()
y[::5] += 3 * (0.5 - rng.rand(16))
# Fit regression model
lassoReg = linear_model.Lasso(alpha=0.1)
lassoReg.fit(X,y)
# Predict
X_test = np.arange(0.0, 5.0, 1)[:, np.newaxis]
lassoReg.predict(X_test)
Output:
array([ 0.78305084,  0.49957596,  0.21610108, -0.0673738 , -0.35084868])
Random Forest Regressor
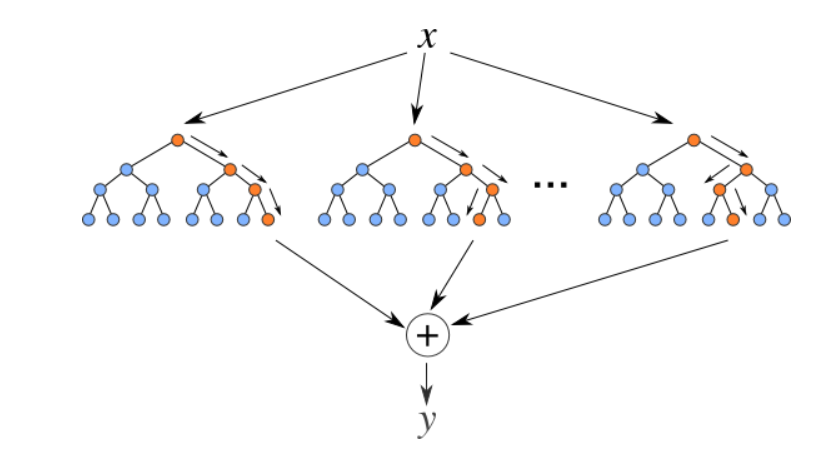
Random Forests are an ensemble(combination) of decision trees. It is a Supervised Learning algorithm used for classification and regression. The input data is passed through multiple decision trees. It executes by constructing a different number of decision trees at training time and outputting the class that is the mode of the classes (for classification) or mean prediction (for regression) of the individual trees.
Source: https://levelup.gitconnected.com
Pros:
- Good at learning complex and non-linear relationships
- Very easy to interpret and understand
Cons:
- They are prone to overfitting
- Using larger random forest ensembles to achieve higher performance slows down their speed and then they also need more memory.
Implementation
from sklearn.ensemble import RandomForestRegressor
from sklearn.datasets import make_regression
X, y = make_regression(n_features=4, n_informative=2, random_state=0, shuffle=False)
rfr = RandomForestRegressor(max_depth=3)
rfr.fit(X, y)
print(rfr.predict([[0, 1, 0, 1]]))

Output:
[33.2470716]
Frequently Asked Questions
A. Examples of regression algorithms include Linear Regression, Polynomial Regression, Ridge Regression, Lasso Regression, Elastic Net Regression, Support Vector Regression (SVR), Decision Tree Regression, Random Forest Regression, and Gradient Boosting Regression. These algorithms are used to predict continuous numerical values and are widely applied in various fields such as finance, economics, and engineering.
A. Regression algorithms are used for predicting continuous numerical values based on input features. They are widely applied in various fields such as finance for stock price forecasting, economics for predicting economic indicators, healthcare for disease progression estimation, and engineering for predicting product performance. Regression analysis helps uncover relationships between variables and make informed predictions for future data points.
End Notes
These are some popular regression algorithms, there are many more and advanced algorithms too. Explore them as well. You can also go through these classification algorithms to increase your machine learning knowledge.
Thanks for reading if you reached here 🙂
Let’s connect on LinkedIn
The media shown in this article are not owned by Analytics Vidhya and is used at the Author’s discretion.


I really enjoyed this post! It was informative and I learned a lot. Thank you for writing it.