This article was published as a part of the Data Science Blogathon.
Introduction
Machine Learning deals with two types of problems: Regression problems and Classification problems. Regression techniques or models are used when our dependent variable is continuous in nature whereas Classification techniques are used when the dependent variable is categorical.
When a Machine Learning model is built various evaluation metrics are used to check the quality or the performance of a model. For classification models, metrics such as Accuracy, Confusion Matrix, Classification report (i.e Precision, Recall, F1 score), and AUC-ROC curve are used.
In this article, we will deep dive into the most common and famous evaluation metric which is Confusion Matrix and will understand all the elements of it in detail. So keep on reading 🙂
Table of contents
Please jump on to the 4th part of the article if you already know Confusion Matrix.
What is Confusion Matrix?
Confusion Matrix is the visual representation of the Actual VS Predicted values. It measures the performance of our Machine Learning classification model and looks like a table-like structure.
This is how a Confusion Matrix of a binary classification problem looks like :

Elements of Confusion Matrix
It represents the different combinations of Actual VS Predicted values. Let’s define them one by one.
TP: True Positive: The values which were actually positive and were predicted positive.
FP: False Positive: The values which were actually negative but falsely predicted as positive. Also known as Type I Error.
FN: False Negative: The values which were actually positive but falsely predicted as negative. Also known as Type II Error.
TN: True Negative: The values which were actually negative and were predicted negative.
Understanding it with the help of an example
Taking an example of the Stock Market Crash prediction project. This is a binary classification problem where 1 means the stock market will crash and 0 means the stock market will not crash and suppose we have 1000 records in our dataset.
Let’s see the confusion matrix of the following :
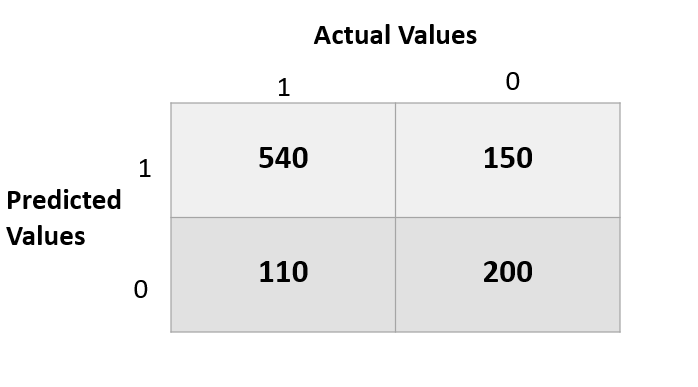
In the above matrix, we can analyze the model as :
True positive: 540 records of the stock market crash were predicted correctly by the model.
False-positive: 150 records of not a stock market crash were wrongly predicted as a market crash.
False-negative: 110 records of a market crash were wrongly predicted as not a market crash.
True Negative: 200 records of not a market crash were predicted correctly by the model.
Other Evaluation Metrics associated with it
Accuracy:
It is calculated by dividing the total number of correct predictions by all the predictions.
Recall / Sensitivity:
The recall is the measure to check correctly positive predicted outcomes out of the total number of positive outcomes.
Precision:
Precision checks how many outcomes are actually positive outcomes out of the total positively predicted outcomes.
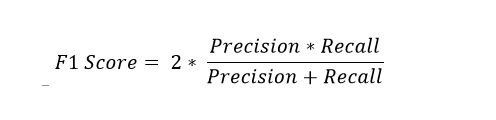
F beta score:
F beta score is the harmonic mean of Precision and Recall and it captures the contribution of both of them. The contribution depends on the beta value in the below formula.
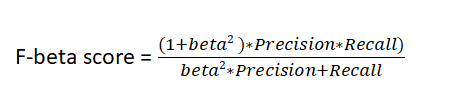
The default beta value is 1 which gives us the formula of F1score, where the contribution of Precision and Recall are the same. Higher the F1 score, the better the model.
The beta value < 1 gives more weight to Precision than Recall and the beta value>1 gives more weight to Recall.
You can calculate the values of all the above-mentioned metrics using the Stock market crash example provided above.
When to use which metrics for evaluation
Here comes the most important part of all of the above discussion i.e when to use which metric.
By this statement I mean to say which measure we should go for to evaluate our model, with Accuracy or with Recall or Precision or both.
Confusing ???? :p
It’s not, I’ll explain this by taking some examples which will clear your concepts even more. So let’s start.
Accuracy is the standard metric to go for to evaluate a classification machine learning model
But
We can not rely on Accuracy all the time as in some cases accuracy gives us a wrong interpretation of the quality of the model, for example in the case when our dataset is imbalanced.
Another case of not using Accuracy is when we are dealing with a domain-specific project or when our company wants a particular result from the model. Let’s get into more detail with some examples.
Example 1: Domain-Specific case
Taking our previous example of Stock Market Crash Prediction, our main aim should be to reduce the outcomes where the model was predicting as not a market crash whereas it was a market crash.
Imagine a situation where our model has wrongly predicted that the market will not crash and instead it crashed, the people have to go through a lot of losses in this case.
The measure which takes into account this problem is FN and therefore Recall. So we need to focus on reducing the value of FN and increasing the value of Recall.
In most medical cases, such as cancer prediction or any disease prediction we try to reduce the value of FN.
Example 2: Spam Detection
In the case of Email Spam detection, if an email is predicted as a scam but is not actually a scam then it can cause problems to the user.
In this case, we need to focus on reducing the value of FP (i.e when the mail is falsely predicted as spam) and as a result, increasing the value of Precision.
- In some cases of imbalanced data problems, both Precision and Recall are important so we consider the F1 score as an evaluation metric.
There is another concept of the AUC ROC curve for evaluation of a classification model, which is one of the most important metrics to learn. We will discuss that in some other blog of mine.
End Notes:
After reading this article, I hope your indecisiveness regarding choosing the best evaluation metrics for your model is resolved. Please let me know about your inputs and suggestion and connect with me on LinkedIn
FAQs
Q1. How do you score a confusion matrix?
To score a confusion matrix, various metrics can be used to evaluate the performance of a classification model. These metrics include accuracy, precision, recall, F1-score, ROC curve with AUC, error rates, and additional metrics specific to the application. The choice of metrics depends on the context and objectives of the classification task.
Q2. What is a perfect confusion matrix?
A perfect confusion matrix is a hypothetical scenario in which a classification model correctly classifies all data points. This would result in a matrix with all true positives (TP) and true negatives (TN) along the diagonal, and zero false positives (FP) and false negatives (FN) in the off-diagonal entries.
About the Author:
I am Deepanshi Dhingra currently working as a Data Science Researcher, and possess knowledge of Analytics, Exploratory Data Analysis, Machine Learning, and Deep Learning.
The media shown in this article are not owned by Analytics Vidhya and is used at the Author’s discretion.
Deepanshi
21 Nov, 2023


