This article was published as a part of the Data Science Blogathon

Introduction
This article will talk about Logistic Regression, a method for classifying the data in Machine Learning. Logistic regression is generally used where we have to classify the data into two or more classes. One is binary and the other is multi-class logistic regression. As the name suggests, the binary class has 2 classes that are Yes/No, True/False, 0/1, etc. In multi-class classification, there are more than 2 classes for classifying data. But, before we go let us first define the logistic regression:
” Logistic Regression is a classification algorithm for categorical variables like Yes/No, True/False, 0/1, etc.”
How is it different from linear regression?
You may have also heard about linear regression. Let me tell you that there is a big difference between both linear regression and logistic regression. Linear regression is used for generating continuous values like the price of the house, income, population, etc. In logistic regression, we generally compute the probability which lies between the interval 0 and 1 (inclusive of both). Then probability can be used to classify the data. For example, if the computed probability comes out to be greater than 0.5, then the data belonged to class A and otherwise, for less than 0.5, the data belonged to class B.
But my question to you is that can we still use linear regression for classification? My answer will be “Yes! why not? But sure it is an absurd idea.” My reason will be that you can assign a threshold value for linear regression, that is if the predicted value is greater than the threshold value, it belonged to class A otherwise class B. But it will give out a large error and a poor model with low accuracy, which we really don’t want. Right? I would suggest you use classification algorithms only.
Now let’s look at the graph of linear regression shown below
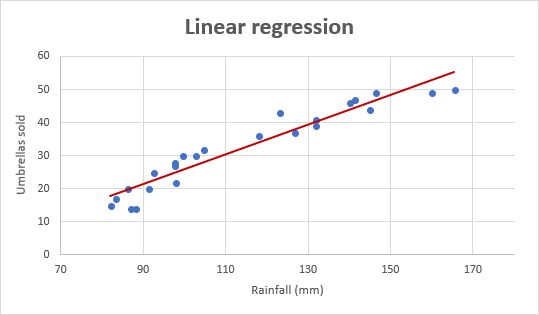
(Courtesy: https://www.ablebits.com/)
The graph is a straight line passing through some points since we always avoid underfitting and overfitting curves.
Now let’s have a look at the logistic regression graph:

The graph is a curved line instead of the straight line, unlike linear regression.
This is a major difference between the two types of regression that we just talked about. So my next question is.
Why do we have a curved line for logistic regression instead of a straight line?
To answer this question, we will walk through linear regression a bit and from there we will arrive at the logistic regression curve. Is that okay? Let’s begin.
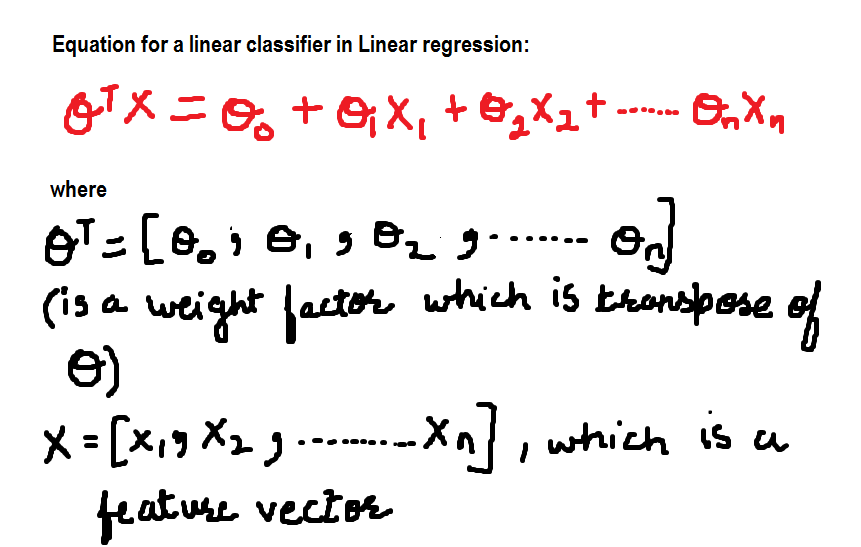
For now, the equation for the linear classifier is:
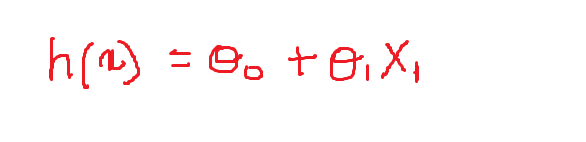
We will now define the values of the variable weights :
theta_0=-1 and theta=0.1
So our equation looks like this and the following is the graph representing the equation in the 2-D plane:
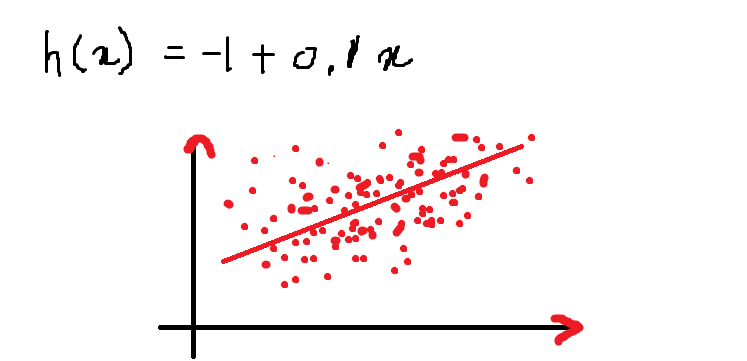
Above is an equation of a line for the given equation:
h(x)=-1 + 0.1x
The value of function h(x) when x=13 is:
h(13)=-1+ (0.1)*(13)= 0.3
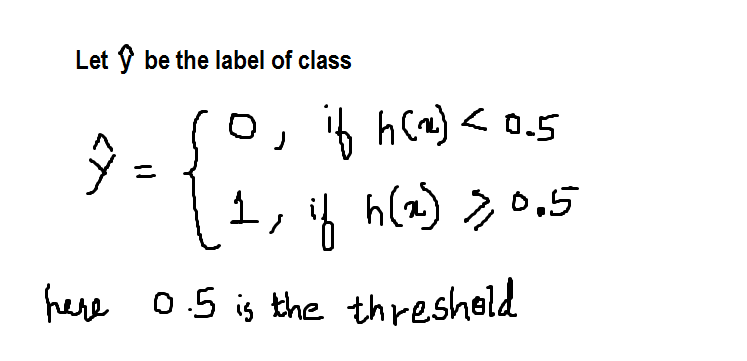
As described earlier in this article, I am defining the threshold to be 0.5 which is any value of h greater than (equal to) 0.5 will be labeled as 1 and otherwise 0. We can define it as follows in the form of step function:
Now according to this h has a value of 0.3, hence the value of y_hat= 0 as per the function defined above.
Now one thing you must note here that every value greater than 0.5, suppose I say the value of ‘h’ is 1000 for some value of x, then it will be labeled as 1 only, there is no difference between the value 1 and 1000 as both are classified as 1 only. Is it right? Can we accept this solution? Well, No! I would not accept it!!!
One more thing, what is the probability that the h has a value of 0.3? All these questions are left unanswered. For these reasons, data scientists do not prefer to use linear regression for classification purposes.
Before we move on I want to show you how the y_hat function behaves graphically:
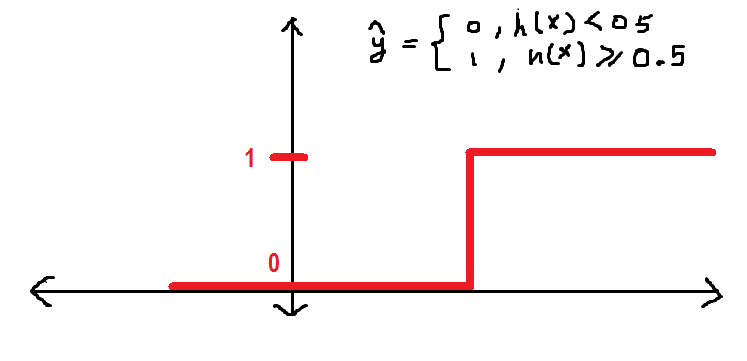
It will be better if we have a smoother curve instead of on given above. Let’s see:
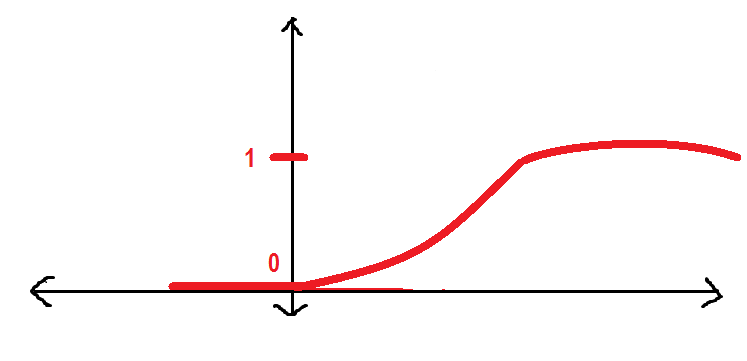
The above curve is known as the Sigmoid function which we will be using throughout this article. Here I will introduce the Sigmoid function.
What is Sigmoid Function?
The sigmoid function is represented by the symbol sigma. Its graphical behavior has been described in the above figure. The mathematical equation for the sigmoid function is described as follows:
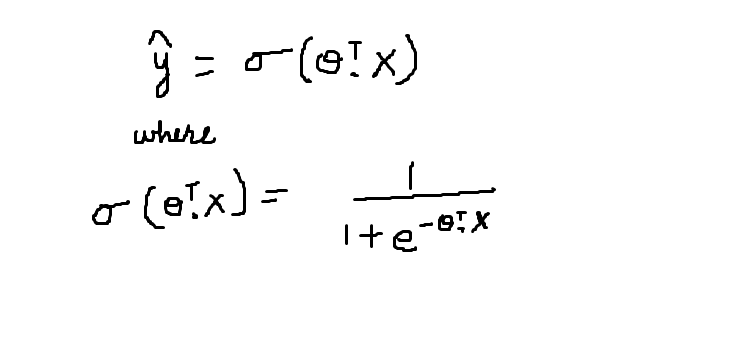
The sigmoid function gives out the probability of data belonging to a particular class which lies in the interval [0,1]. It accepts the dot product of transpose of theta and feature vector X as the parameter. The resulting value is the probability.
Hence when P(Y=1 | X)= sigmoid(theta*X)
P(Y=0 | X) =1- sigmoid(theta*X)
Also, I want you to note the behavior of the sigmoid function:
- When theta(transpose)*X becomes very bigger the value of the sigmoid becomes equal to 1
- When theta(transpose)*X becomes very small the value of the sigmoid becomes equal to 0
Applications of Logistic Regression
In this section, I would like to discuss some of the applications of logistic regression.
1. Predicting a probability of a person having a heart attack
2. Predicting a customer’s propensity to purchase a product or halt a subscription.
3. Predicting the probability of failure of a given process or product.
Before I end this article, I just want to recap when you should use logistic regression:
- When your data is binary: 0/1, True/False, Yes/No
- When you need probabilistic results
- When your data is linearly separable
- When you need to understand the impact of the feature.
Many other classification algorithms are widely used other than logistic regression like kNN, decision trees, random forest, and clustering algorithms like k-means clustering. But logistic regression is a widely used algorithm and also easy to implement.
So this was all about the logistic regression algorithm for a beginner. We have discussed everything you should know about the theory of Logistic Regression. Hope you enjoyed my article!
The media shown in this article are not owned by Analytics Vidhya and is used at the Author’s discretion.
Hi, I'm Sarvagya Agrawal, Software Engineer, with a strong passion for utilizing technology to drive positive change in society. I believe that technology is not just a skill, but an art form that can be leveraged to transform the world.
My primary focus lies in machine learning and web development, with strong programming skills in Python. I have worked on innovative projects, including developing an AI model to calculate cardiovascular risk factors from OCTA scans using computer vision algorithms and creating an AI-based web application for calculating financial risk based on an individual's spending trends.


Hello Sarvagya, Hope you are doing well. I was having some trouble with logistic regression and luckily I found your article. It is very well explained and really liked it. All the information was collectively present on one page. I still have some doubts and I was wondering if you could help me out. 1) Is there any derivation for the log loss function (from where did this function came)? 2) How does gradient descent work in logistic regression? Like in linear regression our y was (y = b0 + b1x) and what we did there was randomly select a value for b1 and then kept updating it until we get a minimum MSE or the global minima. Here, in Logistic regression, our (y = sigmoid function), just wanted to know how gradient descent will work here? In linear regression we used a random value for b1, what will be that random value in logistic regression? 3) After reading tons of articles I also got to know that logistic regression uses MLE(Maximum likelihood estimation). I couldn't figure out where exactly we use MLE in this algorithm I have read almost each and every article on google regarding these 3 topics but I couldn't get the perfect solution for this. It would be really helpful If you take out some time to help me out. Thanks Anshul Saini