The Data Science behind IPL
This article was published as a part of the Data Science Blogathon.
Introduction
Today’s article is on a very interesting and educational topic, “IPL”😅. When I mention the word IPL, I am sure that, things like fun, entertainment, and sports have come to your mind. I am sure that you never relate science and education with IPL, but even you must be surprised to know that science play a big role in things like IPL. How a winning IPL team can be formed by spending the least possible through Data Science. Let’s find out in today’s article.
In this article, I will explain the data science behind IPL and introduce an interesting career option behind it. Let’s start with the basic “What is Data🤔?”.
What is Data?
Data is basically information about anything. For example the no. of fruits on a tree or the flavor of your ice cream or even the no. of stars in the universe or how much % of peoples like the government. All of this is nothing but data. There is an immense amount of data all around us in our lives, but simply having data around us is of no use to us. It is important for us to know what data is useful and what data should analyze and how be recognizing patterns, we can make use of that data. Let’s think, What are we going to do by counting the no. of leaves on the tree? What use would that be😅? It is useless data and is of no use to us. But the % of peoples that favor the government is useful data. It would be useful in politics. It can help the government understand what they should change and how they can transform themselves. This data would come in handy during the elections but it isn’t sufficient to simply record that data if you don’t analyze it, compare it, and improve it. The recording, studying, and observing data and then using it to arrive at the decision, is called Data Science.
Using Data Science, we interpret any data and derive useful information from it, and use it in our decision-making process. It is possible to use Data Science in any aspect of life.
In cricket and IPL, Data Science is used in a somewhat unique and interesting manner. In 2008, IPL came, which completely revolutionized the cricket world, because before IPL never had such an immense amount of money invested into cricket. Considering the auction 2020, totaled ~400 crore INR spent on the players. So much money is being spent in IPL. Data Collection and Data Analysis in IPL has breached the next level, because as IPL spending lot of money on players, it has become necessary for IPL teams to find out that, “Should they spend on a particular player or not?” or “How valuable is the player going to be for the team?”
How should they judge in detail, “Which player should they buy and which one they shouldn’t it?”, “How much money should be spent on which player?” or “What are the values of the different players?”.
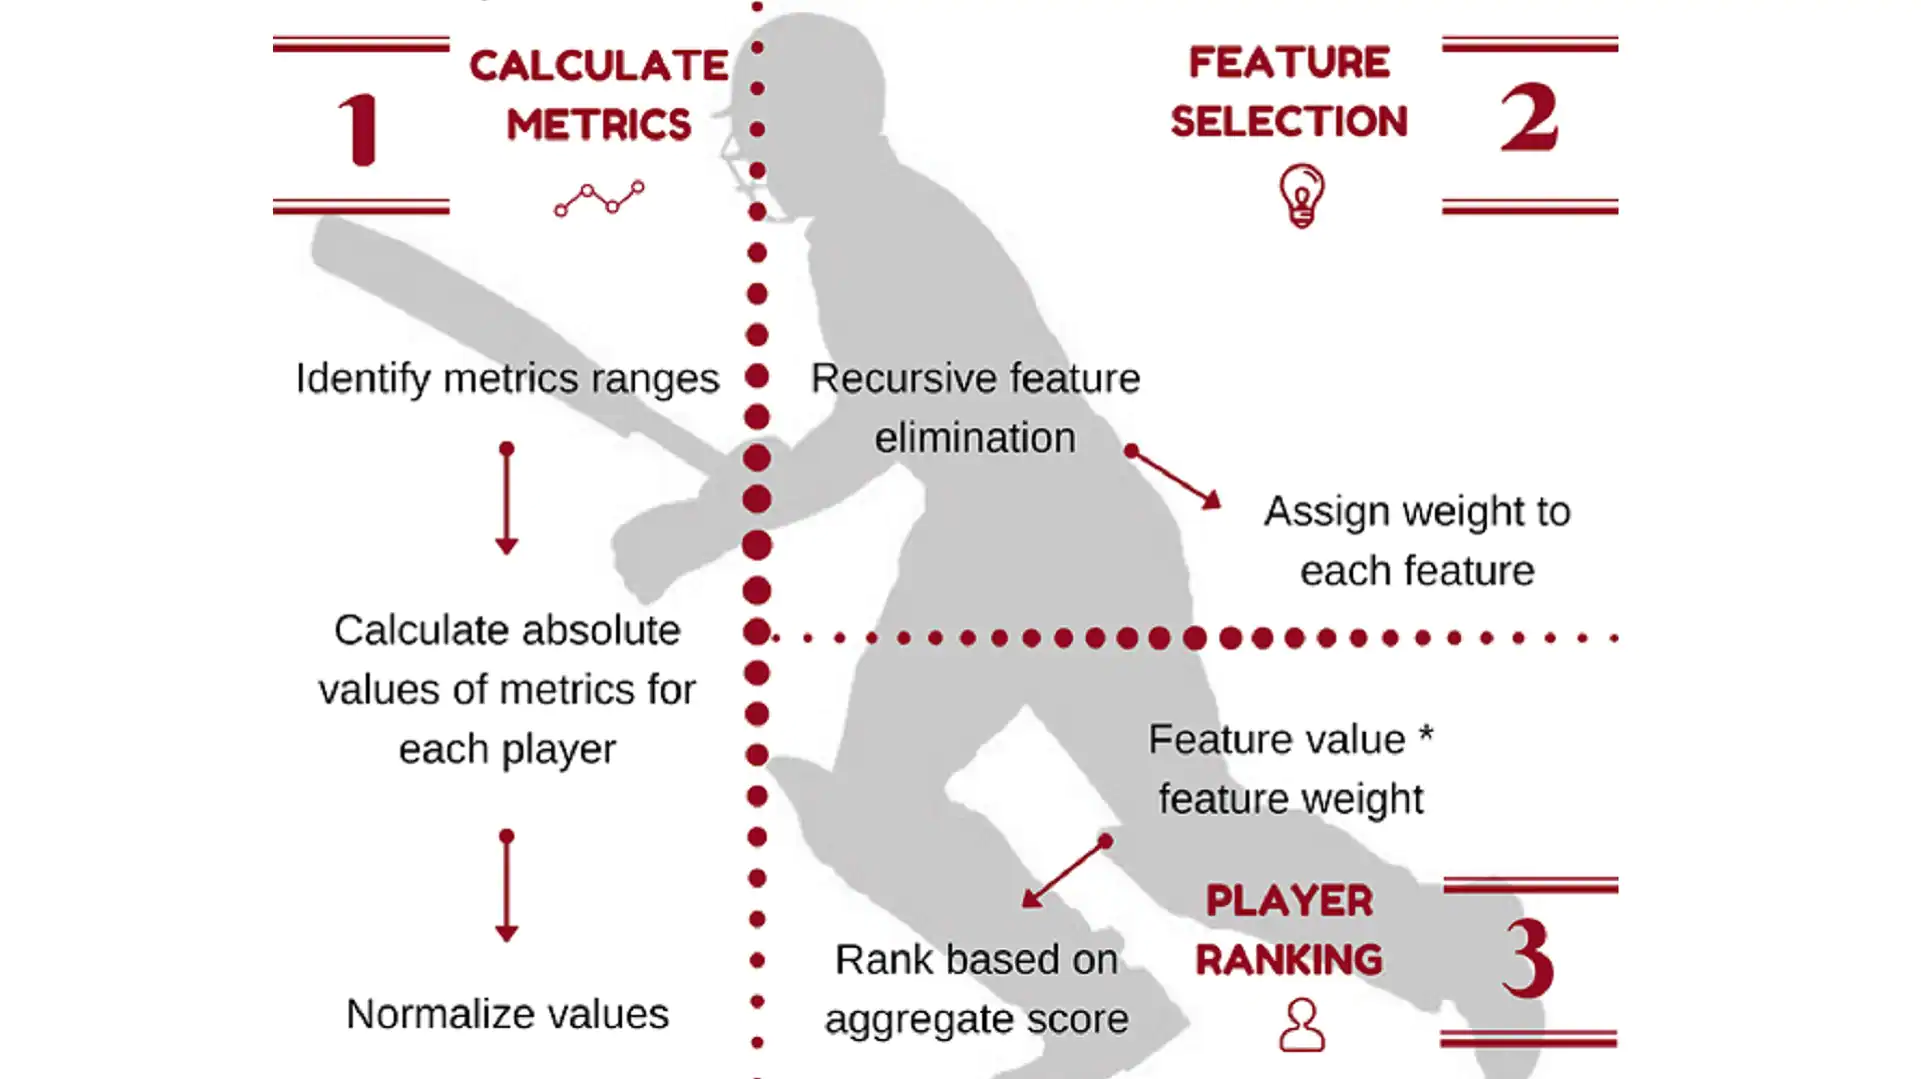
You will not believe that, but IPL teams have started hiring proper companies who are experts in such Data Analysis. Performance Analytics Companies that analyze how good players are, and develop strategies for that players. These Data Analysis companies analyze data about players in detail to understand who is good at what aspect. In IPL a metric that they use, is MVPI or The Most Valuable Player Index, which is a weighted composite score of the different attributes of a player.
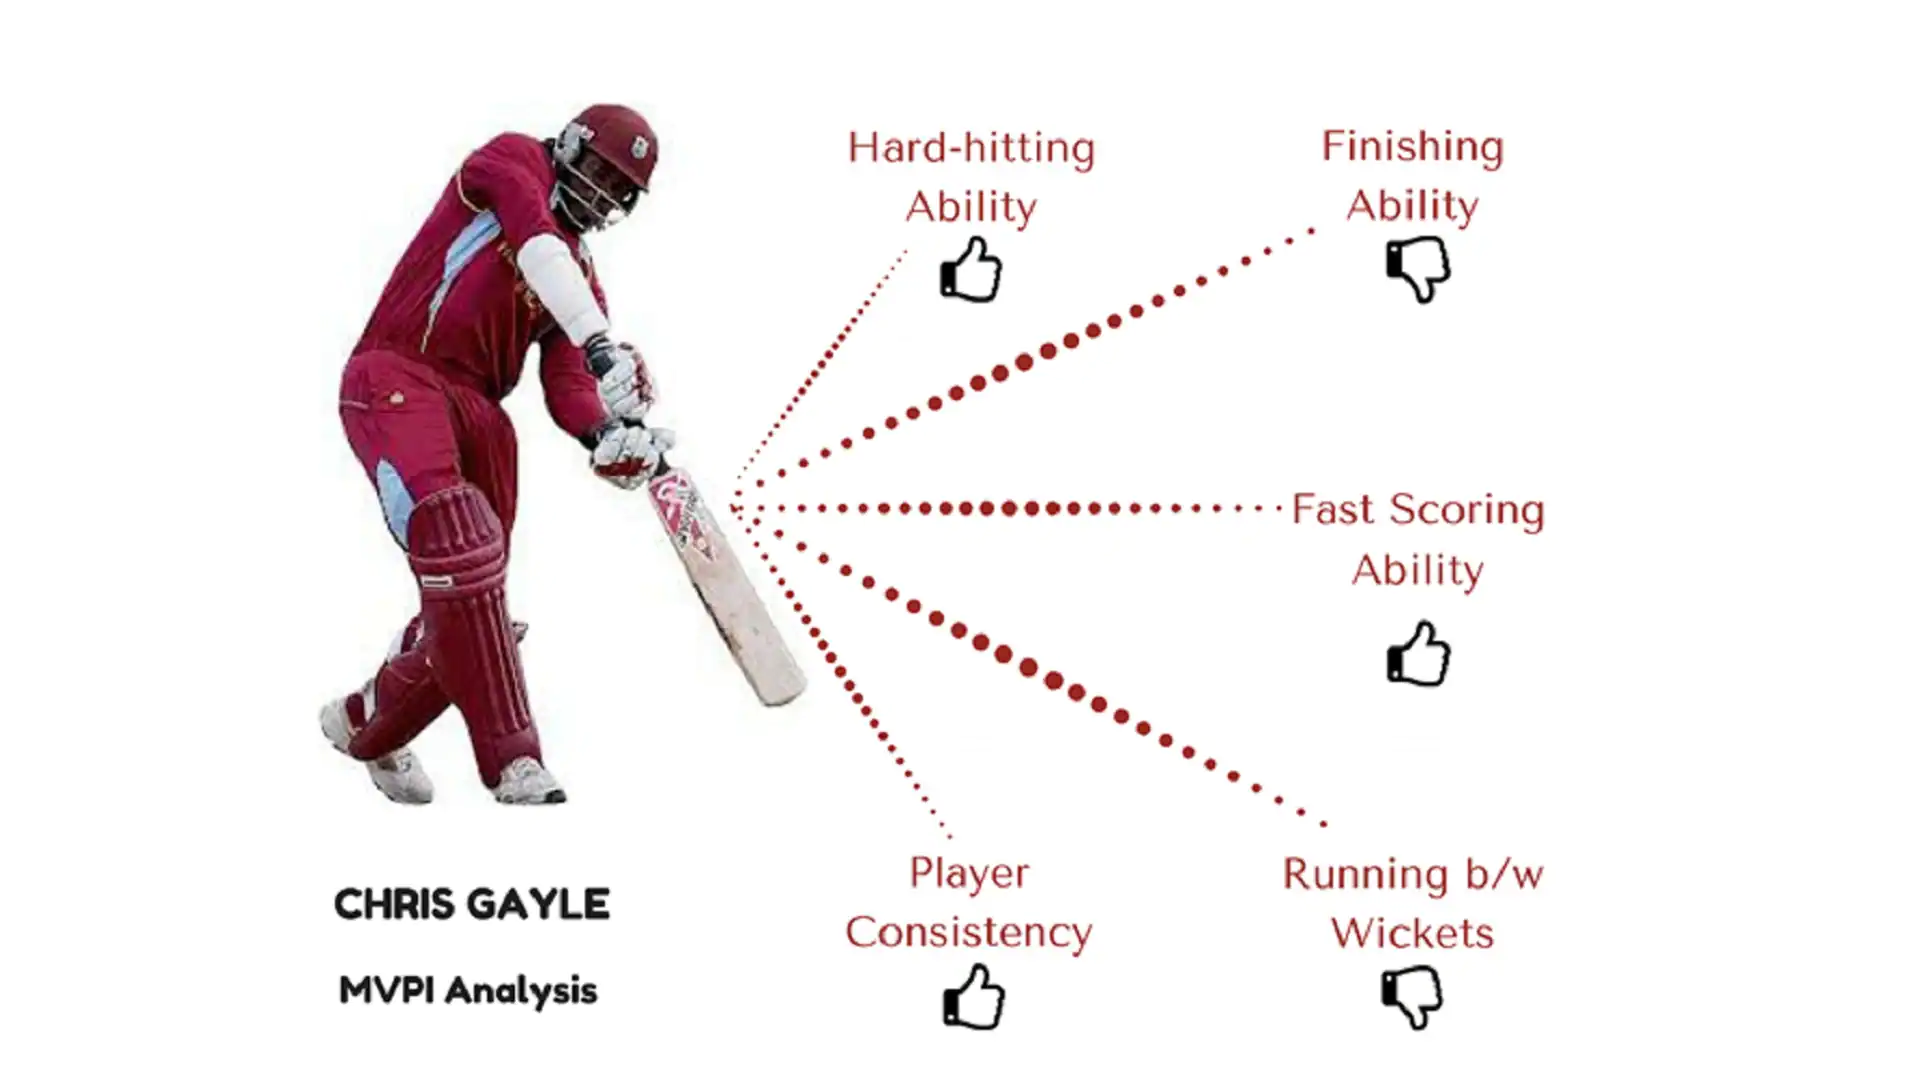
Let’s see some of the Batsman Metrics :
I. Hard-hitting Ability: How many sixes and fours a batsman scores, the following equation is used.
Hard-hitting Ability = (Fours + Sixes) / Ball played by batsman
How many fours and sizes has batsman hit in his IPL career divided by the no. of ball he played. This calculates the hard-hitting ability of the players.
II. Finishing Ability: Not out innings divided by the total innings played.
Finishing Ability = Not out innings / Total innings played.
III. Consistency of Player: Total Run / No. of times out.
IV. Running b/w the wickets: (Total run – (Fours + Sixes)) / (total ball played – boundry balls).
If this fourth metric is better in batsman than the hard-hitting metrics, then you can easily guess that he is not good at hitting boundaries but is good at getting singles, twos, and threes on other balls.
Similarly, some Bowling Metrics are :
I. Economy: Run scored / (No. of ball bowled by bowler / 6).
II. Wicket taking ability: No. of balls bowled / Wicket taken.
III. Consistency: Run conceded / Wicket taken.
IV. Crucial Wicket Taking Ability: No. of times four or five-wicket taken / No. of inning played.
This whole data help us to understand the weak and the strong area of different players, whether a player is good at hitting boundaries or at the running between the wickets, whether a bowler performs better against left-handed batsman or right-handed batsman, whether a batsman perform better against spinner or fast bowlers. Analysis can also work out in “What Stadium and in which weather does a player performs better?”
In one interview, Virender Sehwag encapsulated the importance of Data Science very nicely. He said that “Every game you play, they will record your good performance, your bad performance, you played against which bowler, you scored against which team and which bowler, and the whole data will easily show you that you are good against Pakistan but you’re not good performed against Bangladesh, you’re good against South Africa but you’re not good against England. In 2003 when our computer analytics guy come in and he showed me videos and different kinds of data analysis, I got amazed!!!😲”.
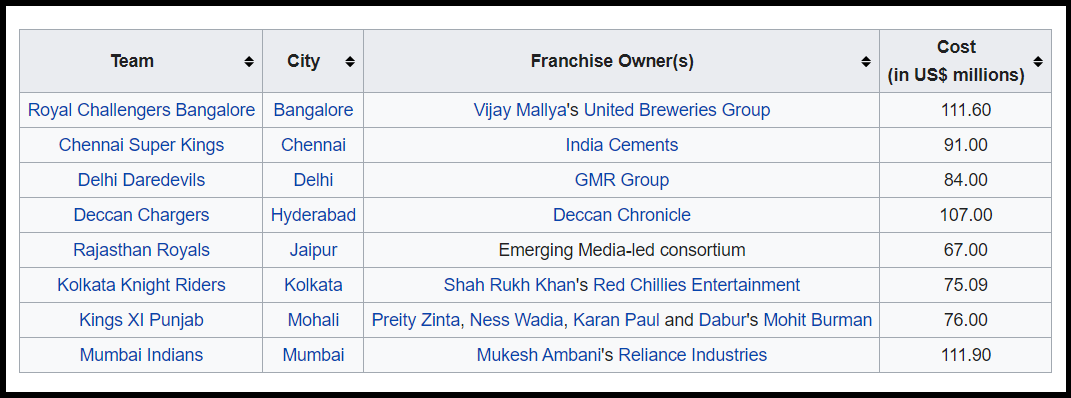
During the auctioning of players, the IPL teams that do not have a lot of money would definitely want to know whether the player that they are buying is worth the money, they spent for their team or not. Because more often it happens that the most expensive player in IPL auction is not the top-performing player of IPL always. The best example of this would be the first season of IPL that is 2008 where Rajasthan Royals had lifted the trophy and Rajasthan Royals was one of the cheapest teams in that season. It means that the money that they had spent on the players was way lesser than what others teams had spent. It was one the cheapest team, but they still won the IPL😎. Check out the IPL 2008 auction list below.
Auctioning of players and forming teams is not just one area where Data Science is used, after this Machine Learning techniques are also used to predict the match results. Different models are created with the help of programming and computers in which, inputs like the position of a player, location of the match, the weather of the day, etc are all added as variables and on the basis of previous matches, these models predict the future results of the matches. If you provide the data input of the previous matches, such as the venues of the matches as well as teams that played, players that were present as well as the type of players that were present, then in the future it could be predicted the result of the matches presently being played.
Obviously, it will not be 100% accurate but it could be quite useful. Programming languages like ‘Python’ and libraries like ‘Pandas’, ‘Matplotlib’, and ‘Seaborn’ are used for data preprocessing and data analysis.
Some Interesting Analysis⚡
I. One of the analyses that analyzed that IPL matches between 2008 – 2017, reveals that Eden Garden and M Chinnaswamy Stadium are the best venues for chasing the score, so if a match is being held in either of these two venues and a team wins the toss, fielding would be a better option. Let’s do the same analysis on IPL matches. You can download the dataset from here. Here we are using IPL Matches 2008-2020 dataset.
Dataset Description: It contains a total of 17 columns. Let’s take a look at them.
Attribute Information :
- id
- city
- date
- player_of_match
- venue
- neutral_venue
- team1
- team2
- toss_winner
- toss_decision
- winner
- result
- result_margin
- eliminator
- method
- umpire1
- umpire2
In the code section, I will directly show the main part of the code. To know detailed descriptions you can directly download the Jupyter Notebook.
Let’s load the libraries:
import pandas as pd
import numpy as np
import matplotlib.pyplot as plt
import seaborn as sns
%matplotlib inline
Read the dataset:
df = pd.read_csv(r'C:UserslenovoDownloadsIPL Matches 2008-2020.csv')
Let’s remove the useless columns from the dataset:
df.drop(labels = ['id', 'date', 'player_of_match', 'neutral_venue', 'result', 'result_margin', 'eliminator', 'method','umpire1', 'umpire2'], axis = 1,inplace = True)
Let’s analyze the better option after winning the toss:
match_win_target = match_loss_target = match_win_chassing = match_loss_chassing = 0
for i in range(len(df)) :
    if df.toss_decision.iloc[i] == 'bat' :    # target diya
        if df.toss_winner.iloc[i] == df.winner.iloc[i] :
            match_win_target += 1
        else :
            match_loss_target += 1
    else :          # target chase kiya or Fielding li
        if df.toss_winner.iloc[i] == df.winner.iloc[i] :
            match_win_chassing += 1
        else :
            match_loss_chassing += 1
print('{} times captain choose batting option and win the match.'.format(match_win_target))
print('{} times captain choose batting option but loose the match.'.format(match_loss_target))
print('{} times captain choose fielding option and win the match.'.format(match_win_chassing))
print('{} times captain choose fielding option but loose the match.'.format(match_loss_chassing))
Let’s create a specific column and describe, how the team wins the match(by giving the target or by chasing the score):
for i in range(len(df)) :
    if df.toss_decision.iloc[i] == 'bat' :
        if df.toss_winner.iloc[i] == df.winner.iloc[i] :
            # captain choose batting option and win the match then it will count as target.
            df['target'].iloc[i] = 1
        else :
            # captain choose batting option and loose the match then it will count as chasing.
            df['chase'].iloc[i] = 1
    else :
        if df.toss_winner.iloc[i] == df.winner.iloc[i] :
            # captain choose fielding option and win the match then it will count in chasing.
            df['chase'].iloc[i] = 1
        else :
            # captain choose fielding option and loose the match then it will count in target.
            df['target'].iloc[i] = 1
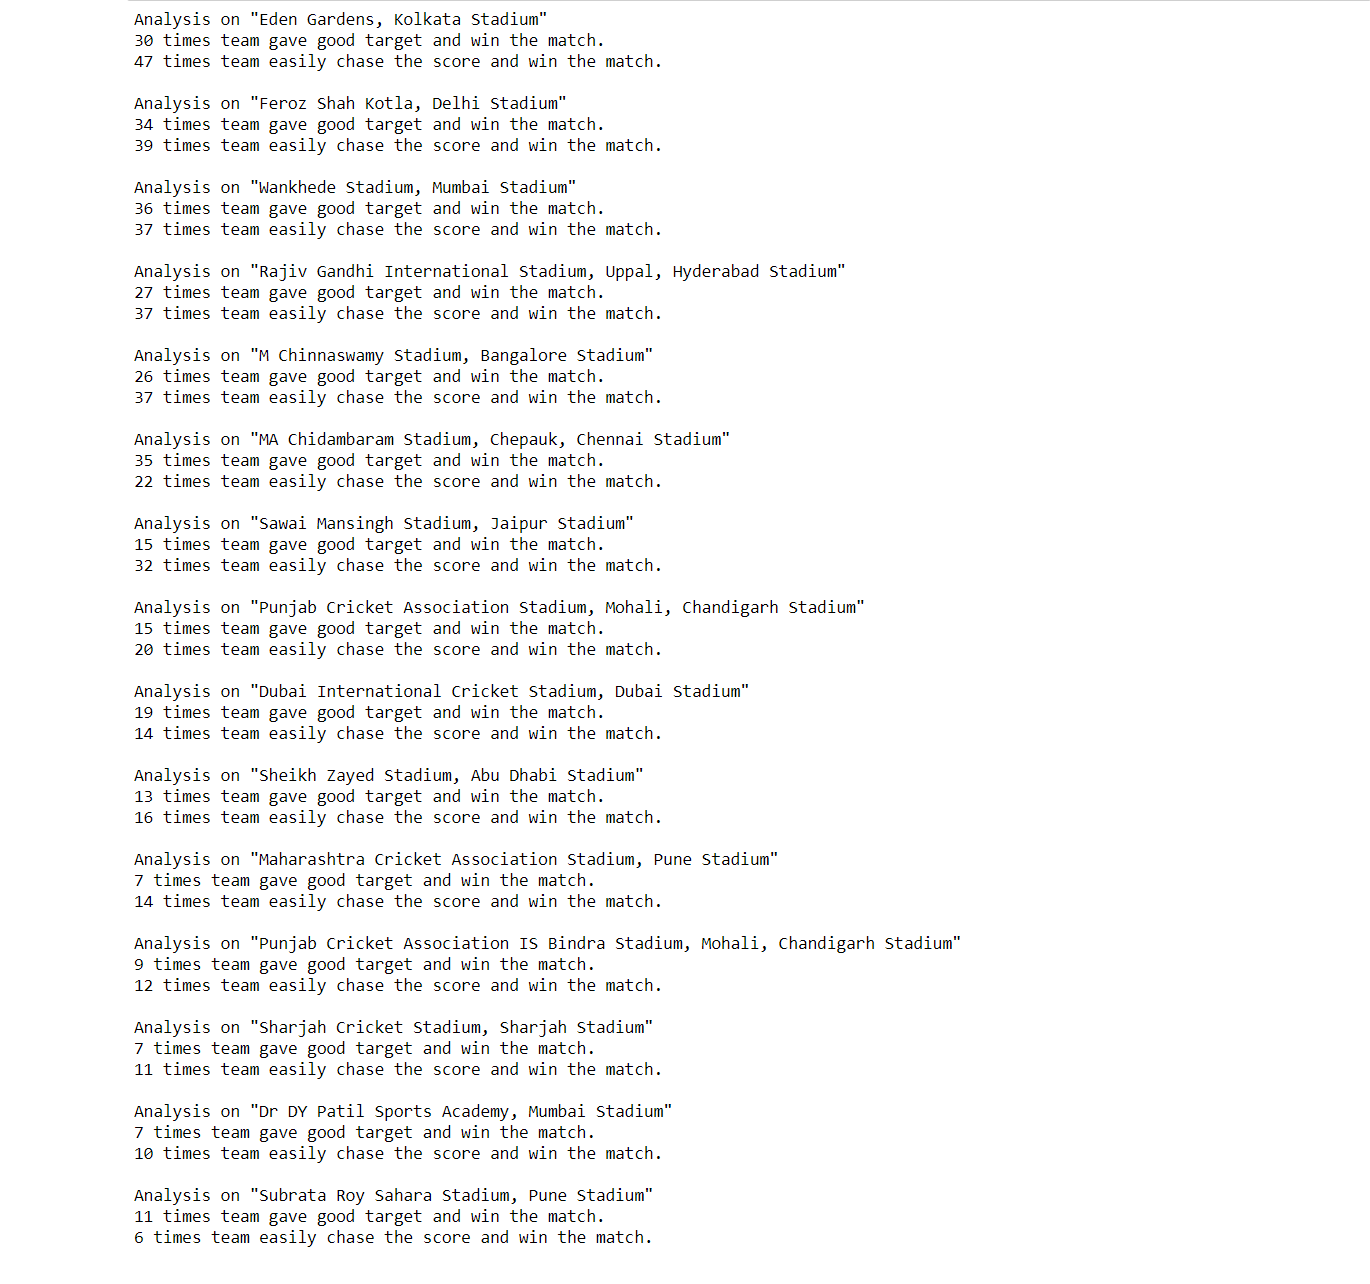
Let’s extract some more useful information from the data:
targetlist = []
chaselist = []
for i in top15_stadium :
    print('Analysis on "{} Stadium"'.format(i))
    x = np.sum(df[df.venue1 == i].target)
    y = np.sum(df[df.venue1 == i].chase)
    print(x, 'times team gave good target and win the match.')
    print(y, 'times team easily chase the score and win the match.')
    targetlist.append(x)
    chaselist.append(y)
    print()
Let’s visualize the above data for better understanding:
top15_stadium = ['Eden Gardens, Kolkata', 'Feroz Shah Kotla, Delhi', 'Wankhede Stadium, Mumbai',
                    'Rajiv Gandhi International Stadium, Uppal, Hyderabad',
                    'M Chinnaswamy Stadium, Bangalore',
                    'MA Chidambaram Stadium, Chepauk, Chennai',
                    'Sawai Mansingh Stadium, Jaipur',
                    'Punjab Cricket Association Stadium, Mohali, Chandigarh',
                 'Dubai International Cricket Stadium, Dubai',
                 'Sheikh Zayed Stadium, Abu Dhabi','Maharashtra Cricket Association Stadium, Pune',
                'Punjab Cricket Association IS Bindra Stadium, Mohali, Chandigarh', 'Sharjah Cricket Stadium, Sharjah',
                 'Dr DY Patil Sports Academy, Mumbai', 'Subrata Roy Sahara Stadium, Pune']
data = {'target': [30, 34, 36, 27, 26, 35, 15, 15, 19, 13, 7, 9, 7, 7, 11],
        'chase': [47, 39, 37, 37, 37, 22, 32, 20, 14, 16, 14, 12, 11, 10, 6]}
df1 = pd.DataFrame(data,columns=['target', 'chase'], index = top15_stadium)
df1.plot.barh(figsize = (15,10))
plt.style.use('seaborn-bright')
plt.title('Top-15 Stadiums')
plt.ylabel('Stadiums')
plt.xlabel('No. of Matches Win')
plt.xticks(np.arange(0, 54, 3))
plt.show()
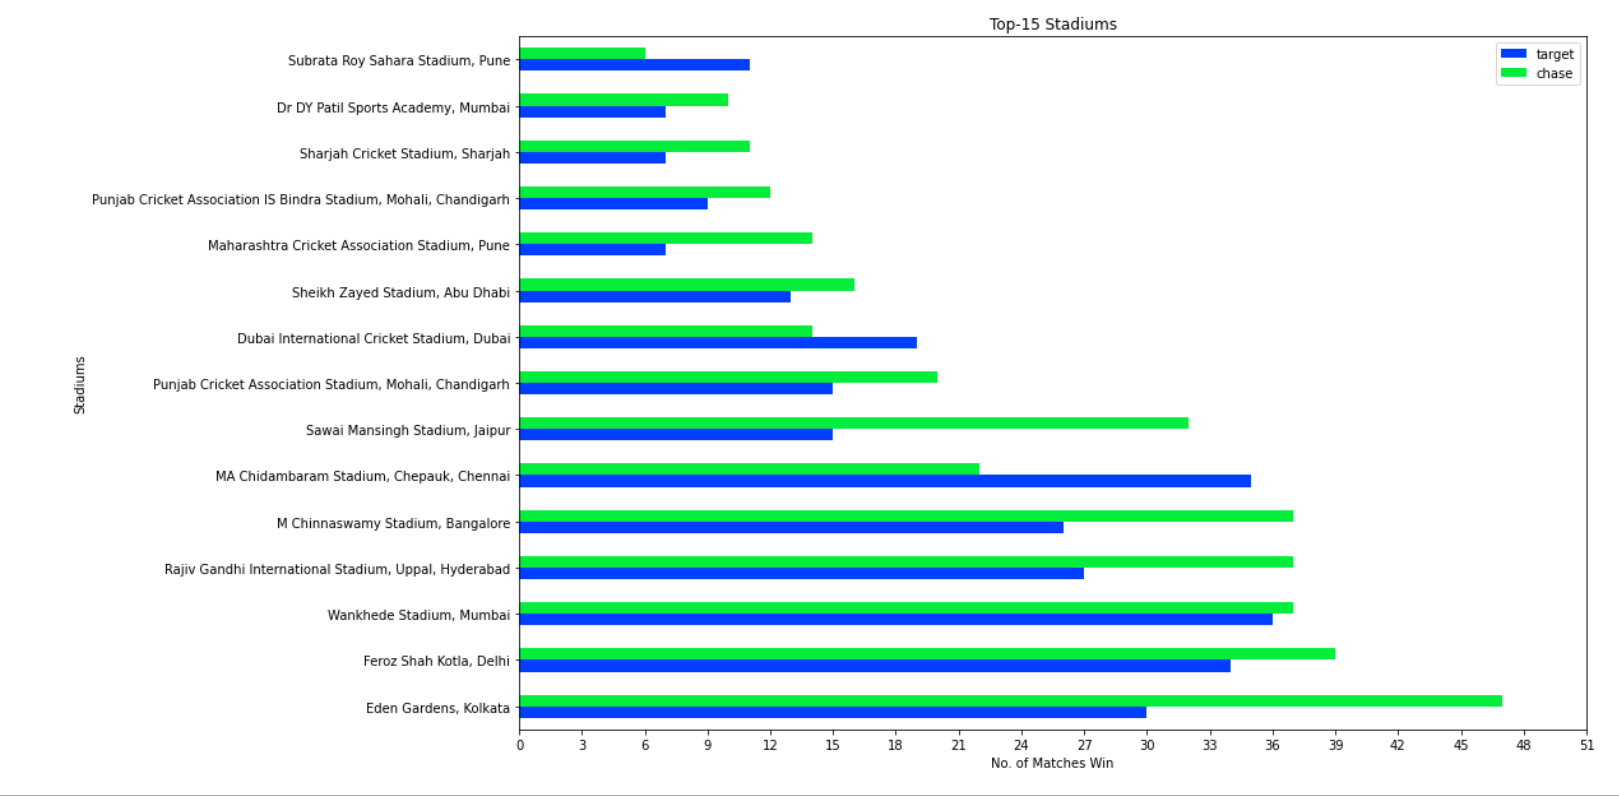
The above plot reveals that “How many times team give good target or easily chase the target in the particular stadium.” Let’s look at the horizontal bar of “Eden Garden, Kolkata” stadium, this bar reveals that more than 45 times easily chase the score and win the match and approx 30 times the team gave good target and win the match. From this, we can easily conclude that this stadium is better for chasing the score, so if a match is being held in this venue and a team wins the toss, fielding would be a better option. Similarly, we can easily analyze the whole plot.
Let’s convert the above data in terms of % for better understanding:
target1 = []
chase1 = []
for i in top15_stadium :
    print(i)
    x = np.sum(df[df.venue1 == i].target)
    y = np.sum(df[df.venue1 == i].chase)
    total = x + y
    t = ((x / total) * 100)
    c = ((y / total) * 100)
    target1.append(round(t, 2))
    chase1.append(round(c, 2))
    print('{:.2f}% probablity that if you choose to bat, then you will win the match.'.format((x / total) * 100))
    print('{:.2f}% probability that if you choose to field, then you will win the match.'.format((y / total) * 100))
    print()
.png)
Let’s visualize the above data for better understanding:
top15_stadium = ['Eden Gardens, Kolkata', 'Feroz Shah Kotla, Delhi', 'Wankhede Stadium, Mumbai',
                    'Rajiv Gandhi International Stadium, Uppal, Hyderabad',
                    'M Chinnaswamy Stadium, Bangalore',
                    'MA Chidambaram Stadium, Chepauk, Chennai',
                    'Sawai Mansingh Stadium, Jaipur',
                    'Punjab Cricket Association Stadium, Mohali, Chandigarh',
                 'Dubai International Cricket Stadium, Dubai',
                 'Sheikh Zayed Stadium, Abu Dhabi','Maharashtra Cricket Association Stadium, Pune',
                'Punjab Cricket Association IS Bindra Stadium, Mohali, Chandigarh', 'Sharjah Cricket Stadium, Sharjah',
                 'Dr DY Patil Sports Academy, Mumbai', 'Subrata Roy Sahara Stadium, Pune']
data = {'Bat_first': target1,
        'Field_first': chase1}
df2 = pd.DataFrame(data,columns=['Bat_first', 'Field_first'], index = top15_stadium)
df2
.png)
df2.plot.barh(figsize = (15,10))
plt.style.use('seaborn-bright')
plt.title('Top-15 Stadiums')
plt.ylabel('Stadiums')
plt.xlabel('Probability to win')
plt.xticks(np.arange(0, 75, 3))
plt.show()
Here the above plot reveals that “What is the probability of winning if you choose to bat first or field first in top-15 stadiums.” Let’s look at the horizontal bar of “Subrata Roy Sahara Stadium, Pune”, this bar reveals that in this stadium if you choose to bat first after winning the coin toss then more than 63% of chances that you will win that match, on the other hand, if you choose to field first then there is only 35% chance that you will win the match.
From this, we can easily conclude that this stadium is better for giving the target to the opposition team, so if a match is being held in this venue and a team wins the toss, batting would be a better option. Similarly, we can easily analyze the whole plot. For more details, you can directly download the jupyter notebook.
II. Another analysis took into account the batting average and strike rate of all the IPL players, and concluded that all the players below the age of 35 had a batting avg. of 24.51 and an avg. strike rate of 126.84 and on the other hand players above 35 years had an avg. strike rate of 112.1 much lesser and batting avg. of 21.34. This show that younger player should be preferred if a team has to improve its performance.
The final conclusion🤩
You might wonder with all the data we are analyzing, how much of this data and its analysis is actually useful? and How much of it is random? Previously we talk about which stadium is better for chasing, and what will happen in what kind of weather. It could be that all of these are random things. It could be coincident that, it was easier to chase and win in that particular stadium. I am sure that this question definitely pops up in your mind. It is a legitimate one because, in a lot of data analysis, randomness is also taken into account. If there is randomness, it could be put into the algorithms so that it also be accounted for while analyzing the data. And this generates even more accurate results.
Mind-Blowing Fact🤯 : In fact, when Kolkata Knight Riders won the trophy in 2014 the Auction Analysis of SAP got a lot of credit for their victory. Kolkata Knight Riders had hired that SAP Data Analysis Company to analyze the data and to explain in detail “What kind of team should be formed, Which player should be sent, where, when, and what should the strategies be?”. On the basis, of this analysis, KKR finally won the trophy.
Let’s Wrap Up!
But in the end, I will only like to say that this is all a game of probabilities, you can definitely increase your chances of winning the match by taking all those things into account but there’s never a 100% guarantee. Because after all, the IPL players are human beings😁, not machines.
Golden Words😁❕
If you really enjoyed it, don’t forget to share it with your friends. If you have any query don’t hesitate to leave a response below. You can also connect me on LinkedIn. And finally, … it doesn’t go without saying😉…
Thanks for reading!

-ronyl
The media shown in this article are not owned by Analytics Vidhya and is used at the Author’s discretion.


