Spectral Clustering: A Comprehensive Guide for Beginners
This article was published as a part of the Data Science Blogathon
When given a bunch of movies to organize, you might sort them based on similarity measures such as genre, year of release, casting, revenue generated, and so on. While you categorize them based on a measure, it doesn’t mean that a measure used by others is of no good. Our perception of data is greatly influenced by the clustering measure being used. When you believe that two sci-fi movies belong to the same cluster, someone else might consider two movies released in the same year to be in the same cluster. Because you might have used the genre as a measure to cluster and the other person might have used the year of release as a measure.
Table of contents
Classifications vs Clustering
As humans, in machine learning, a widely used unsupervised algorithm to group unlabeled data points by similarity and distance measures is clustering. If the data points are labeled, grouping is known as classification. Clustering algorithms have their application in many places including anomaly detection, image segmentation, search result grouping, market segmentation, and social network analysis. Clustering is one of the initial steps done in exploratory data analysis to visualize the similarity and to identify the pattern lying hidden in data points. The motive of clustering is to find the similarity within a cluster and the difference between two clusters.
Support Vector Machines, Decision trees, Random forests, Linear classifiers and Neural networks are few classification algorithms whereas K means clustering, Fuzzy analysis clustering, Mean shift, DBSCAN and Spectral are clustering algorithms.

There are two major approaches in clustering. They are:
- Compactness
- Connectivity
In compactness, the points are closer to each other and are compact towards the cluster center. Distance is used as a measure to compute closeness. There are different types of distance metrics that are in use. A few of them are Euclidean distance, Manhattan distance, Minkowski distance, and Hamming distance. K-means algorithm uses the compactness approach. In connectivity, the points in a cluster are either immediately next to each other (epsilon distance) or connected. Even if the distance is less, they are not put in the same cluster. Spectral clustering is one of the techniques to follow this approach.
How to do Spectral Clustering?
The three major steps involved in spectral clustering are: constructing a similarity graph, projecting data onto a lower-dimensional space, and clustering the data. Given a set of points S in a higher-dimensional space, it can be elaborated as follows:
1. Form a distance matrix
2. Transform the distance matrix into an affinity matrix A
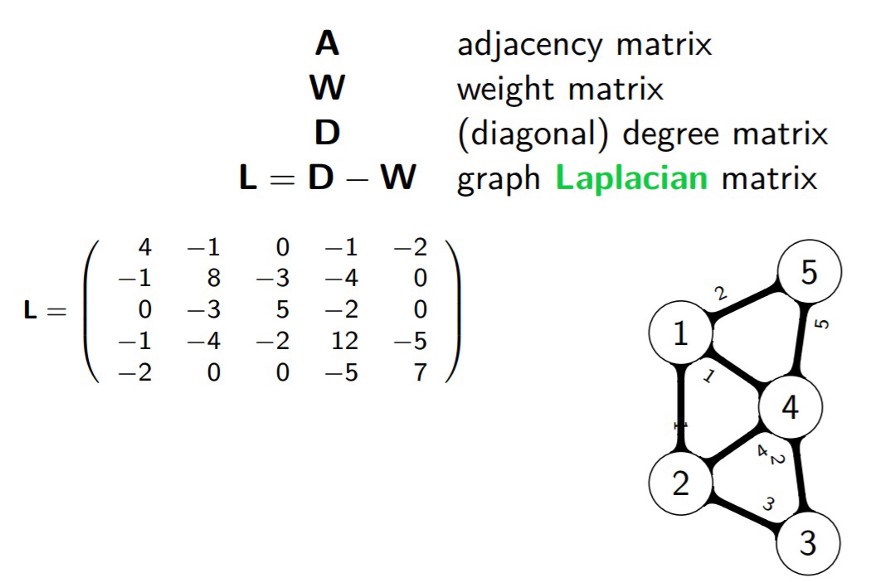
3. Compute the degree matrix D and the Laplacian matrix L = D – A.
4. Find the eigenvalues and eigenvectors of L.
5. With the eigenvectors of k largest eigenvalues computed from the previous step form a matrix.
6. Normalize the vectors.
7. Cluster the data points in k-dimensional space.
Pros and Cons of Spectral Clustering
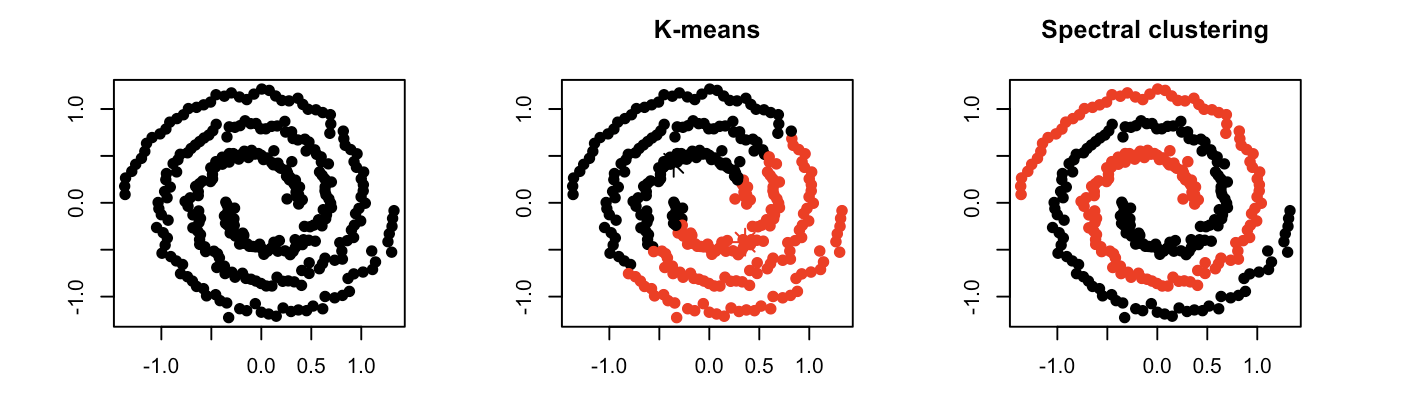
Spectral clustering helps us overcome two major problems in clustering: one being the shape of the cluster and the other is determining the cluster centroid. K-means algorithm generally assumes that the clusters are spherical or round i.e. within k-radius from the cluster centroid. In K means, many iterations are required to determine the cluster centroid. In spectral, the clusters do not follow a fixed shape or pattern. Points that are far away but connected belong to the same cluster and the points which are less distant from each other could belong to different clusters if they are not connected. This implies that the algorithm could be effective for data of different shapes and sizes.
When compared with other algorithms, it is computationally fast for sparse datasets of several thousand data points. You don’t need the actual dataset to work with. Distance or Though it might be costly to compute for large datasets as eigenvalues and eigenvectors need to be computed and then clustering is to be done. But the algorithms try to cut the cost. The number of clusters (k) needs to be fixed before starting the procedure.
Where can I use spectral clustering?
Spectral clustering has its application in many areas which includes: image segmentation, educational data mining, entity resolution, speech separation, spectral clustering of protein sequences, text image segmentation. Though spectral clustering is a technique based on graph theory, the approach is used to identify communities of vertices in a graph based on the edges connecting them. This method is flexible and allows us to cluster non-graph data as well either with or without the original data.
Python packages for spectral clustering: spectralcluster. SpectralCluster is a python library that has inbuilt code for spectral clustering. There are other packages with which we can implement the spectral clustering algorithm.
Let us try an example with spectral clustering algorithm available from sklearn package.
Python Code:
where X is a NumPy array of shape (n_samples, n_features) and the returned labels is a NumPy array of shape (n_samples, ).
Clustering with the spectral clustering and visualizing the data
sc=SpectralClustering(n_clusters=4).fit(x)
SpectralClustering(affinity='rbf', assign_labels='kmeans', coef0=1, degree=3,
                   eigen_solver=None, eigen_tol=0.0, gamma=1.0,
                   kernel_params=None, n_clusters=4, n_components=None,
                   n_init=10, n_jobs=None, n_neighbors=10, random_state=None)
labels = sc.labels_
plt.scatter(x[:,0], x[:,1], c=labels)
plt.show()
print(sc)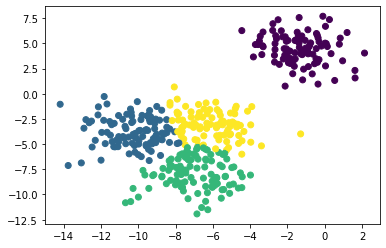
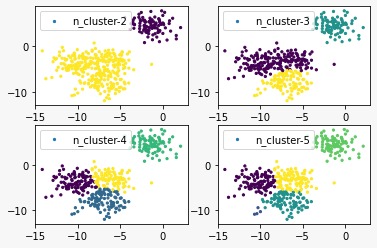
Let’s try changing the number of clusters.
f = plt.figure()
f.add_subplot(2, 2, 1)
for i in range(2, 6):
 sc = SpectralClustering(n_clusters=i).fit(x)
 f.add_subplot(2, 2, i-1)
 plt.scatter(x[:,0], x[:,1], s=5, c=sc.labels_, label="n_cluster-"+str(i))
 plt.legend()
plt.show()
I’m Keerthana, a data science student fascinated by Math and its applications in other domains. I’m also interested in writing Math and Data Science related articles. You can connect with me on LinkedIn and Instagram. Check out my other articles here.
FAQs
Spectral clustering is called spectral because it utilizes the spectrum of eigenvalues and eigenvectors derived from a similarity matrix constructed from the data. The spectrum captures the intrinsic structure of the data, allowing for effective dimensionality reduction and clustering.
No, k-means and spectral clustering are two distinct clustering algorithms. K-means is a partitioning-based algorithm that iteratively assigns data points to clusters based on their distance to cluster centroids. Spectral clustering, on the other hand, is a spectral-based algorithm that utilizes the spectrum of a similarity matrix to identify clusters
The objective of spectral clustering is to identify groups of similar data points within a dataset. It achieves this by analyzing the connections or relationships between data points, effectively partitioning the data into clusters where points within each cluster share similar characteristics. Think of it like sorting a pile of mixed objects, such as toys, stationery, and clothing. Spectral clustering would identify groups of similar objects, such as all the toy cars together, all the pens together, and all the shirts together, even if they are mixed together in the pile.
The media shown in this article are not owned by Analytics Vidhya and is used at the Author’s discretion.


