In today’s data-driven world, effective data manipulation is essential for extracting valuable insights and making informed decisions. Pandas, a powerful Python library, provides a versatile toolkit for handling and manipulating structured data. Mastering Pandas’ data manipulation capabilities is crucial for data scientists, analysts, and researchers alike, enabling them to clean, transform, and analyze datasets with ease. In this guide, we’ll explore the importance of learning how to manipulate data using Pandas and how it can empower you to navigate complex data analysis tasks efficiently.
Learning Objective
- Understand the importance of effective data manipulation in data analysis tasks.
- Learn how to use Pandas, a powerful Python library, for handling and manipulating structured data efficiently.
- Explore various techniques and functions in Pandas for tasks such as dropping columns/rows, renaming columns, handling duplicates, grouping data, and using the map() function.
- Gain practical skills in data manipulation, including selecting specific values, slicing datasets, and saving data to CSV files using Pandas.
This article was published as a part of the Data Science Blogathon.
Table of contents
Panda Library
Pandas, a Python library for data analysis and manipulation, is open-source and built on top of NumPy. It offers powerful data structures like the Pandas DataFrame and Series for working with structured data efficiently. Named after “Panel Data,” it excels in handling time series and structured datasets. Beginners and data scientists alike leverage Pandas for its seamless integration with Python, SQL, and various algorithms. With its support for data visualization, Pandas is a go-to tool for exploring and analyzing data.
Key Features of Pandas
- Perform Group by operation seamlessly
- Datasets are mutable using pandas which means we can add new rows and columns to them.
- Easy to handle missing data
- Merge and join datasets
- Indexing and subsetting data
Installation
Install via pip using the following command,
pip install pandas
Install via anaconda using the following command,
conda install pandas
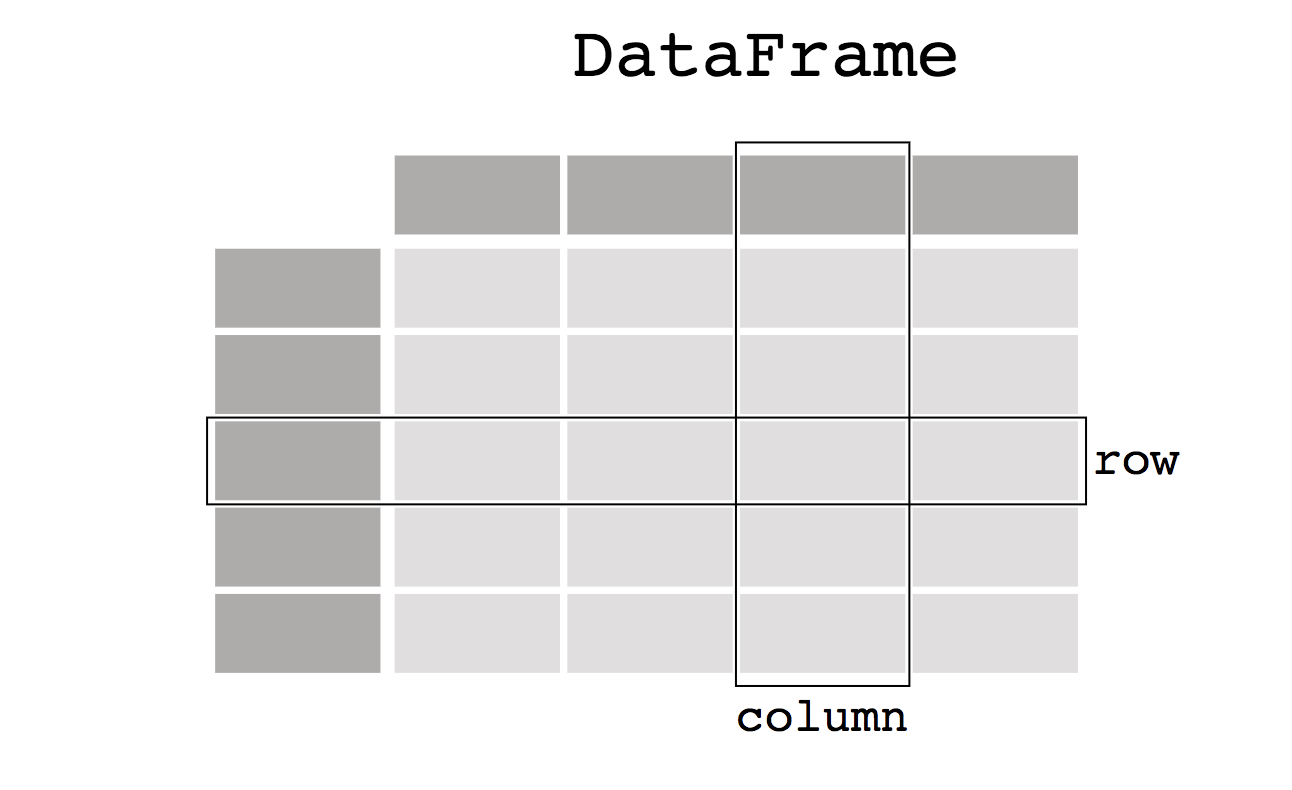
DataFrame in Pandas
In the Pandas library, a DataFrame represents a two-dimensional table where each column can contain various data types such as integers, floats, or strings. In Pandas, each column is represented as a Series object. We’ll delve deeper into this concept later in this article, exploring topics like adding new columns, data cleaning using Pandas API, and utilizing the matplotlib library for data visualization in Python with Pandas.
Creating a DataFrame in Pandas
# import the library as pd
import pandas as pd
df = pd.DataFrame(
    {
        'Name': ['Srivignesh', 'Hari'],
        'Age': [22, 11],
        'Country': ['India', 'India']
    }
)
print(df)
# output
#         Name  Age Country
# 0  Srivignesh   22   India
# 1        Hari   11   India
pd.DataFrame is a class available in pandas. Here we provide a dictionary whose keys are the column names (‘Name’, ‘Age’, ‘Country’) and the values are the values in those columns. Here each column is of class pandas.Series. Series is a one-dimensional data used in pandas.
# accessing the column 'Name' in df
print(df['Name'])
# Output
# 0    Srivignesh
# 1          Hari
# Name: Name, dtype: object
print(type(df['Name']))
# Output
# <class 'pandas.core.series.Series'>
Data Manipulation using Pandas
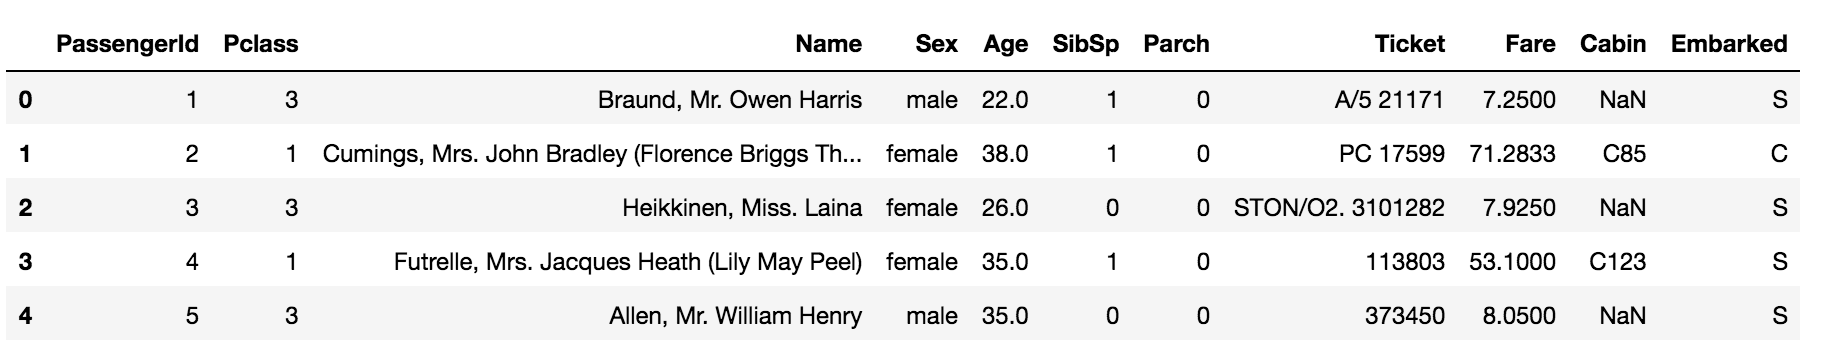
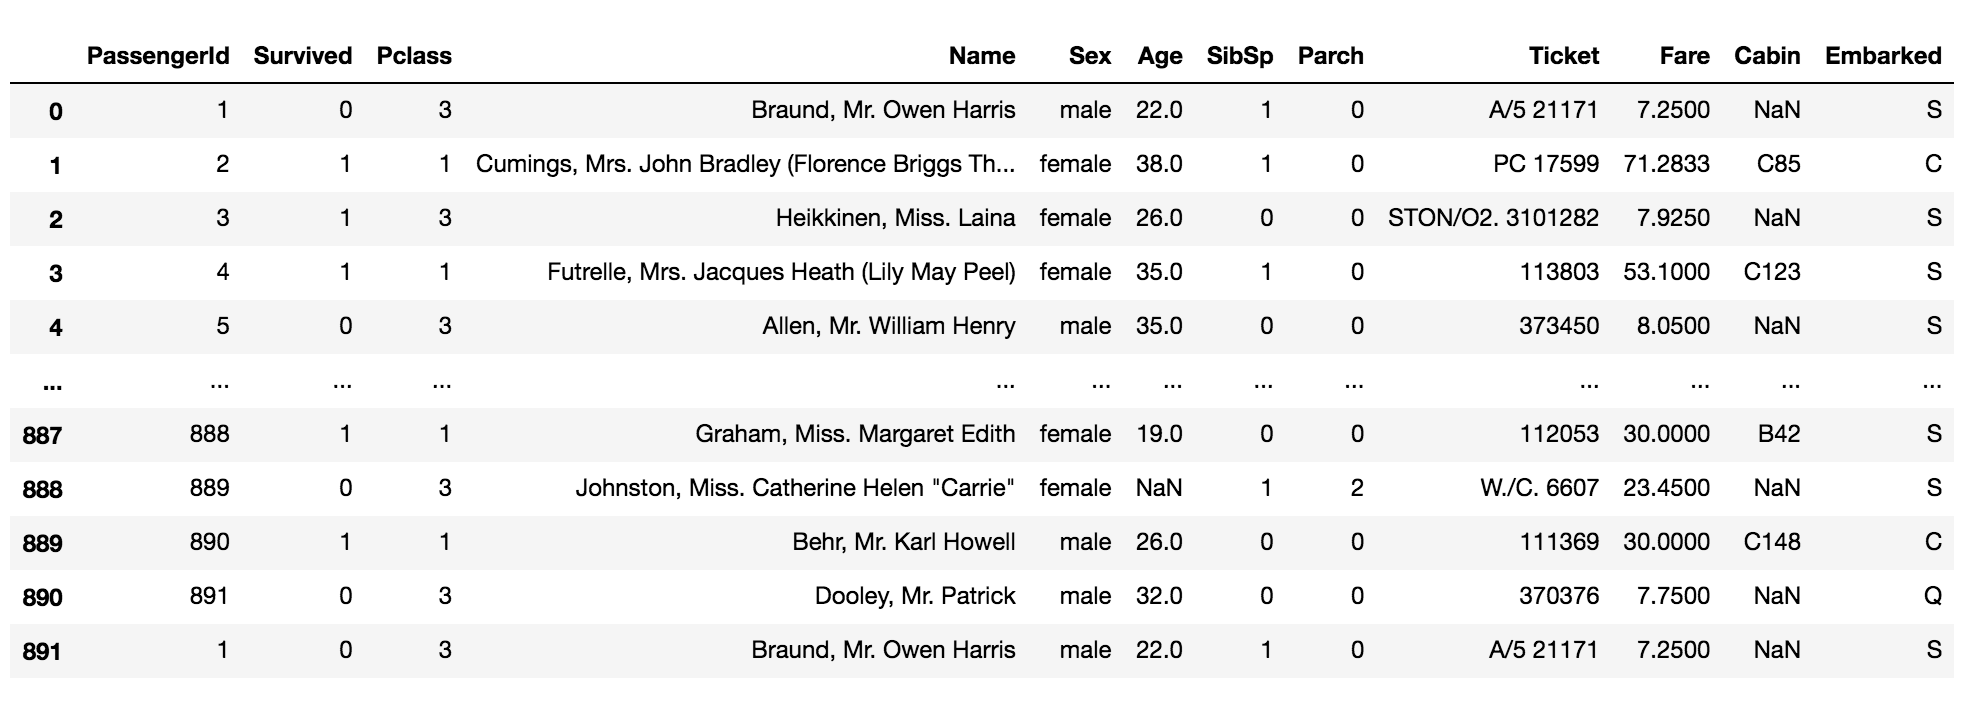
For this purpose, we are going to use Titanic Dataset which is available on Kaggle.
import pandas as pd
path_to_data = 'path/to/titanic_dataset'
# read the csv data using pd.read_csv function
data = pd.read_csv(path_to_data)
data.head()
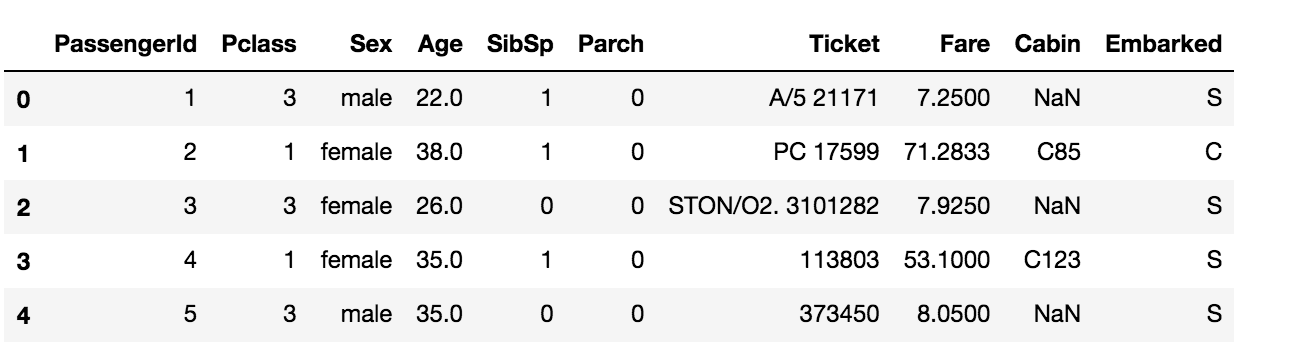
Dropping columns in the data
df_dropped = data.drop('Survived', axis=1)
df_dropped.head()

The ‘Survived’ column is dropped in the data. The axis=1 denotes that it ‘Survived’ is a column, so it searches ‘Survived’ column-wise to drop.
Drop multiple columns using the following code,
df_dropped_multiple = data.drop(['Survived', 'Name'], axis=1)
df_dropped_multiple.head()
The columns ‘Survived’ and ‘Name’ are dropped in the data.
Dropping rows in the data
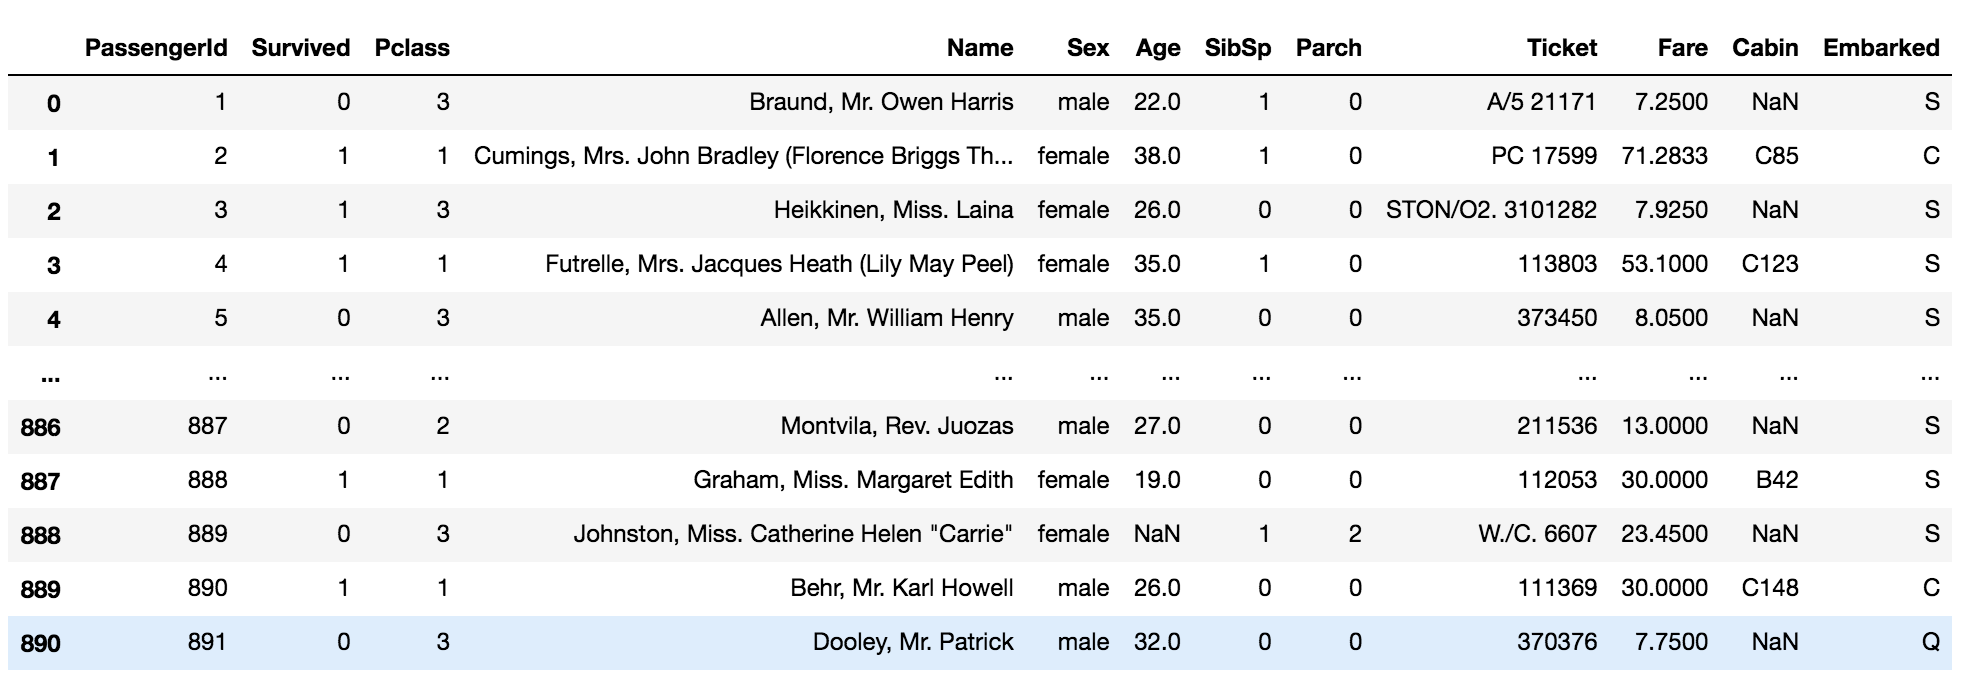
df_row_dropped = data.drop(2, axis=0)
df_row_dropped.head()
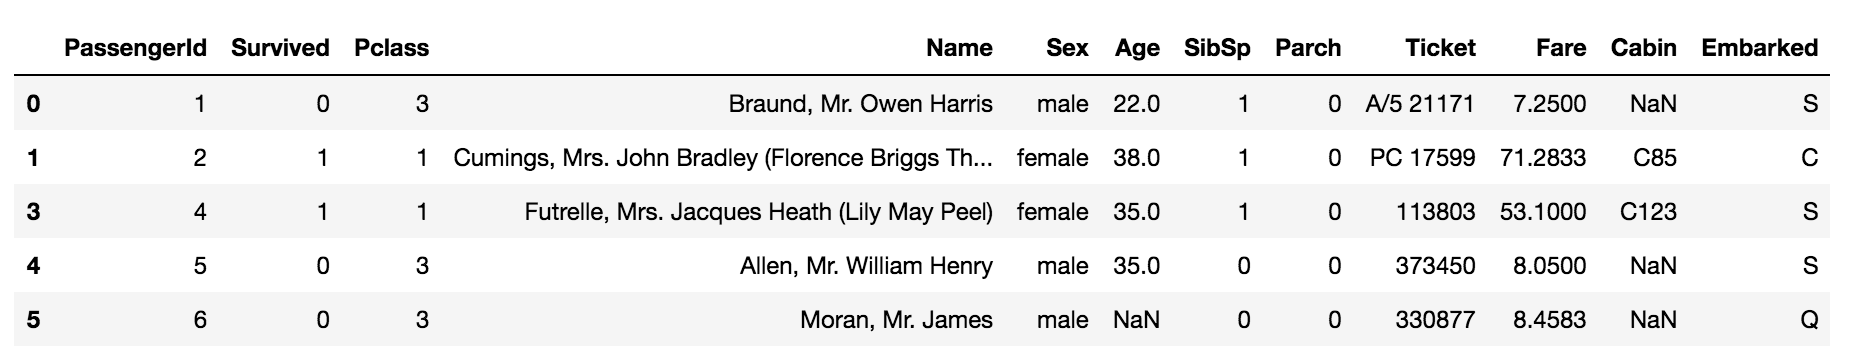
The row with index 2 is dropped in the data. The axis=0 denotes that index 2 is a row, so it searches the index 2 column-wise.
Drop multiple rows using the following code,
df_row_dropped_multiple = data.drop([2, 3], axis=0)
df_row_dropped_multiple.head()
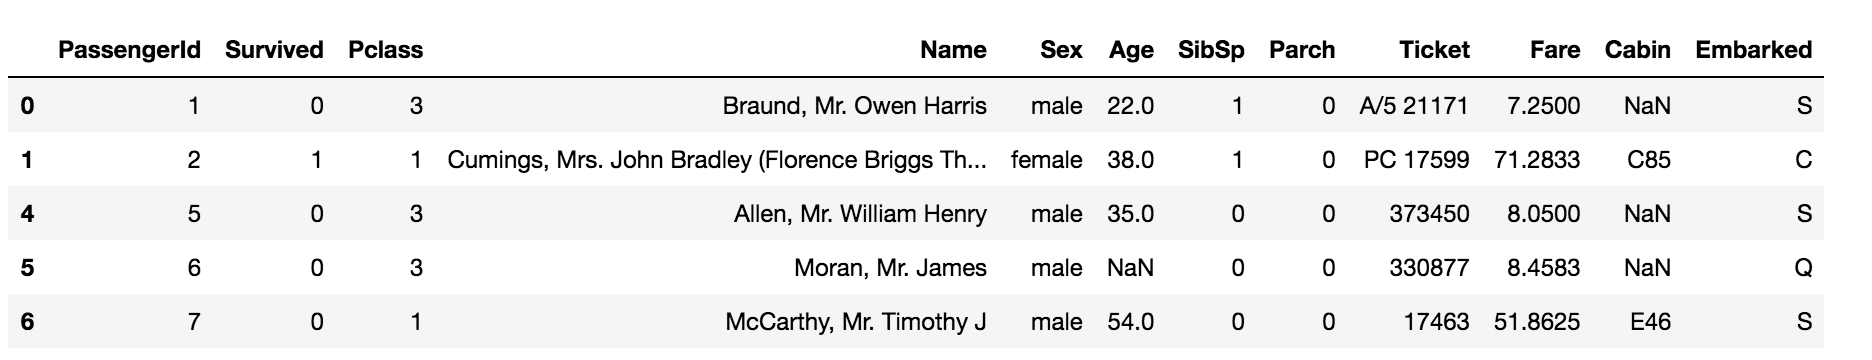
The rows with indexes 2 and 3 are dropped in the data.
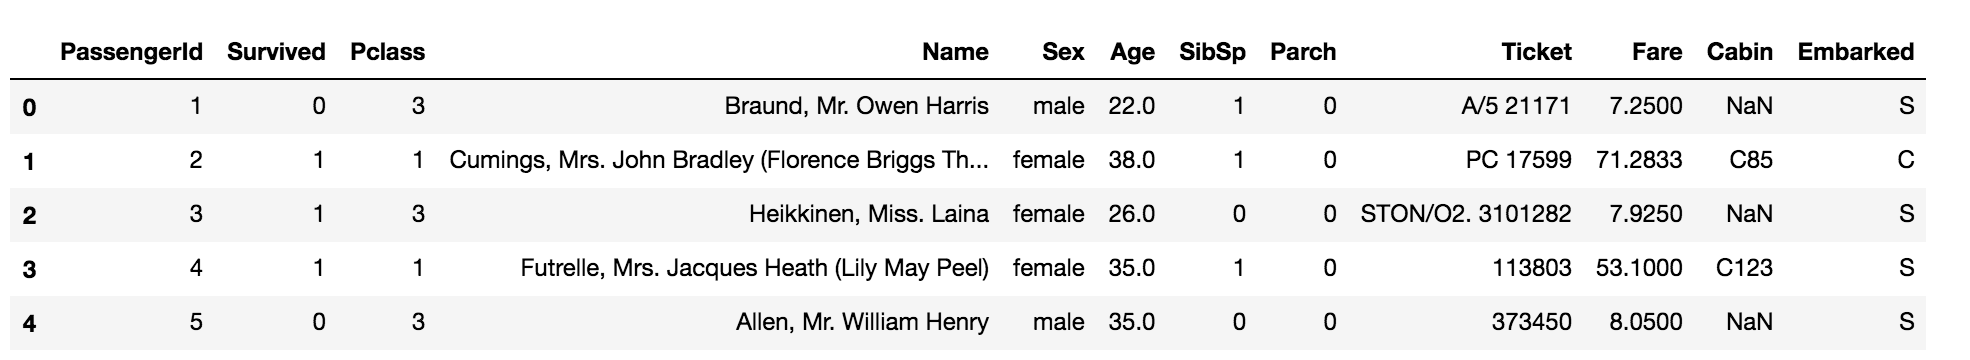
Renaming a column in the dataset
data.columns
# Output
# Index(['PassengerId', 'Survived', 'Pclass', 'Name', 'Sex', 'Age', 'SibSp',
#        'Parch', 'Ticket', 'Fare', 'Cabin', 'Embarked'],
#       dtype='object')
df_renamed = data.rename(columns={'PassengerId': 'Id'})
df_renamed.head()
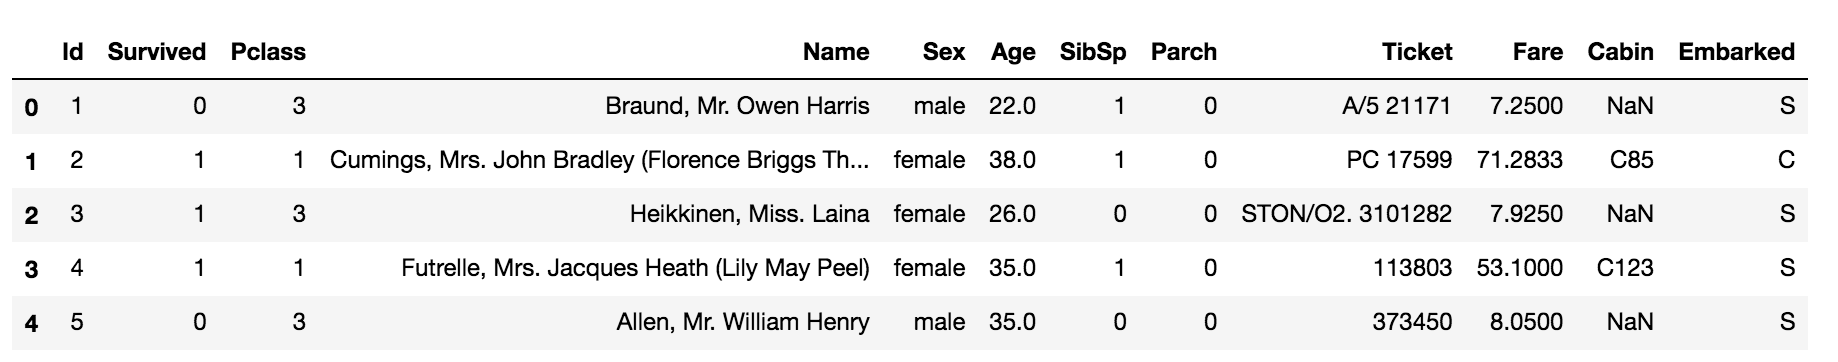
The column ‘PassengerId’ is renamed to ‘Id’ in the data. Do not forget to mention the dictionary inside the columns parameter.
Rename multiple columns using the following code,
df_renamed_multiple = data.rename(
    columns={
        'PassengerId': 'Id',
        'Sex': 'Gender',
    }
)
df_renamed_multiple.head()
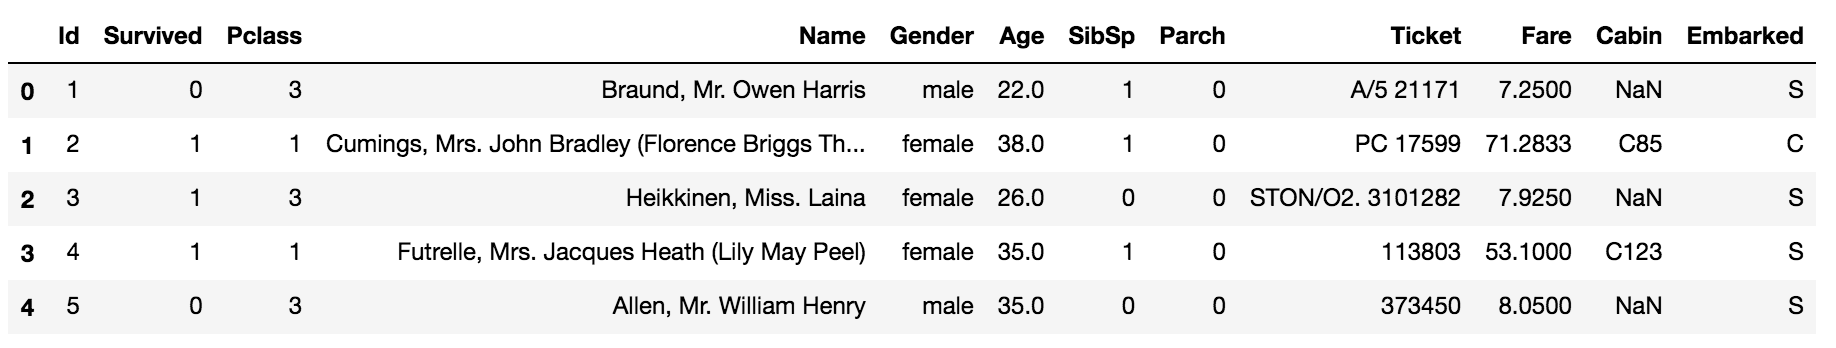
The columns ‘PassengerId’ and ‘Sex’ are renamed to ‘Id’ and ‘Gender’ respectively.
Select columns with specific data types
integer_data = data.select_dtypes('int')
integer_data.head()
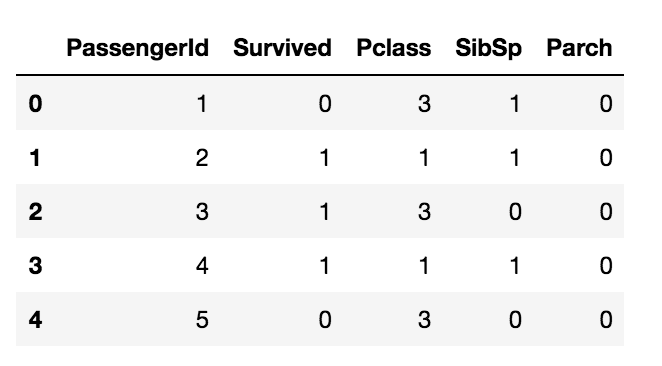
The above code selects all columns with integer data types.
float_data = data.select_dtypes('float')
float_data.head()
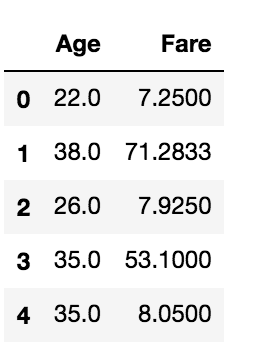
The above code selects all columns with float data types.
Slicing the dataset
data.iloc[:5, 0]
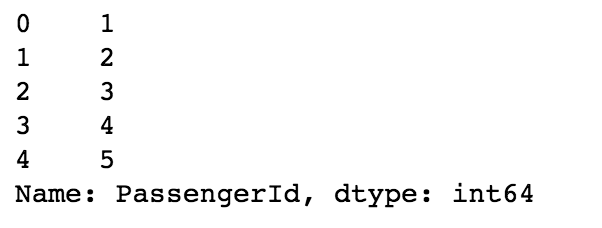
The above code returns the first five rows of the first column. The ‘:5’ in the iloc denotes the first five rows, and the number 0 after the comma denotes the first column. iloc locates the data using numbers or integers.
data.loc[:5, 'PassengerId']
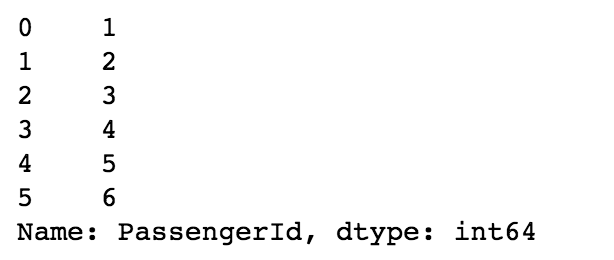
The above code does the same but we can use the column names directly using loc in pandas. Here the index 5 is inclusive.
Handle Duplicates in Dataset
Since there are no duplicate data in the titanic dataset, let us first add a duplicated row into the data and handle it.
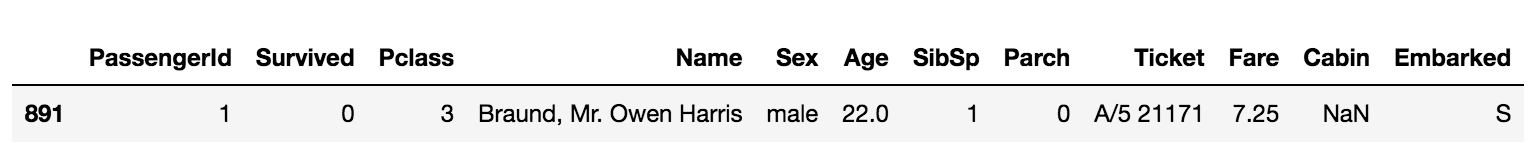
df_dup = data.copy()
# duplicate the first row and append it to the data
row = df_dup.iloc[:1]
df_dup = df_dup.append(row, ignore_index=True)
df_dup
df_dup[df_dup.duplicated()]
The above code returns the duplicated rows in the data.
df_dup.drop_duplicates()
The above code drops the duplicated rows in the data.
Select specific values in the column
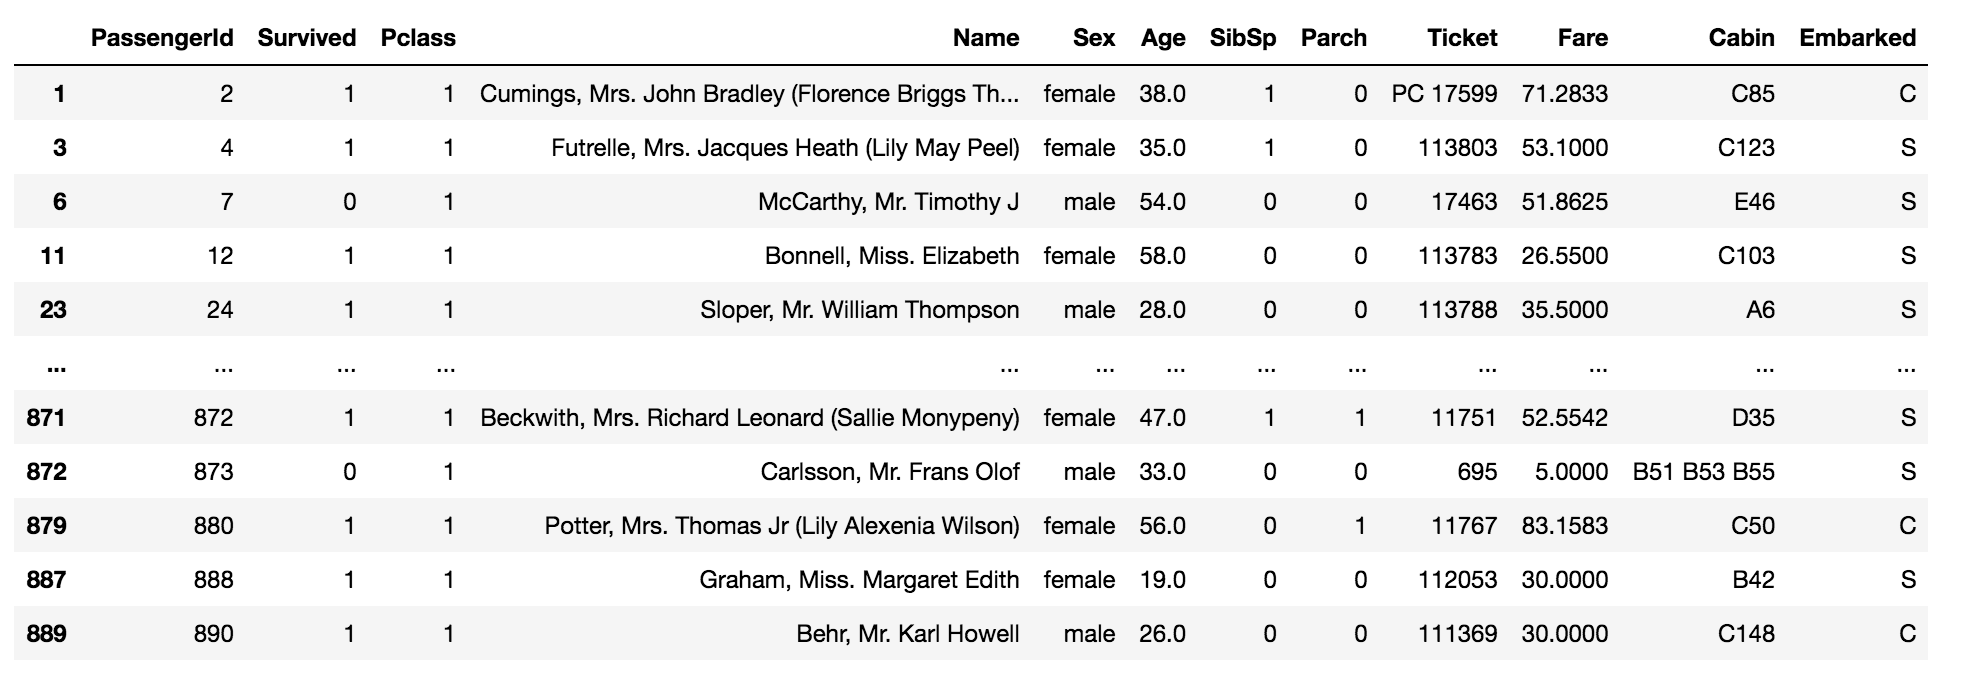
data[data['Pclass'] == 1]

The above code returns the values which are equal to one in the column ‘Pclass’ in the data.
Select multiple values in the column using the following code,
data[data['Pclass'].isin([1, 0])]
The above code returns the values which are equal to one and zero in the column ‘Pclass’ in the data.
Group by in DataFrame
In Pandas, the groupby() function is used to group data in a DataFrame based on one or more columns. It allows you to split the DataFrame into groups based on some criteria, such as unique values in a particular column. Once grouped, you can perform aggregate operations, such as sum, mean, count, etc., on the groups to generate summary statistics or perform further analysis. Overall, the groupby() function is a powerful tool for segmenting and analyzing data in Pandas DataFrames.
data.groupby('Sex').agg({'PassengerId': 'count'})
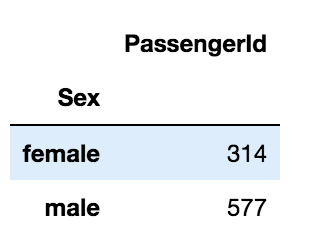
The above code groups the values of the column ‘Sex’ and aggregates the column ‘PassengerId’ by the count of that column.
data.groupby('Sex').agg({'Age':'mean'})
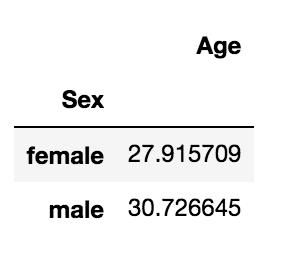
The above code groups the values of the column ‘Sex’ and aggregates the column ‘Age’ by mean of that column.
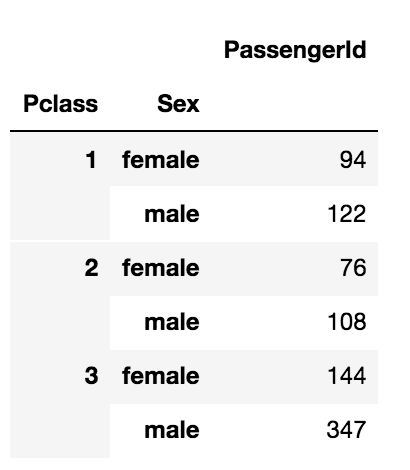
Group multiple columns using the following code,
data.groupby(['Pclass', 'Sex']).agg({'PassengerId': 'count'})
Map() Function in Pandas
In Pandas, the map() function is used to apply a mapping or transformation to the values of a Series. It takes a function, a dictionary, or another Series as input and returns a new Series with the transformed values. This function is particularly useful for replacing values in a Series based on a specified mapping.
data['Survived'].map(lambda x: 'Survived' if x==1 else 'Not-Survived')
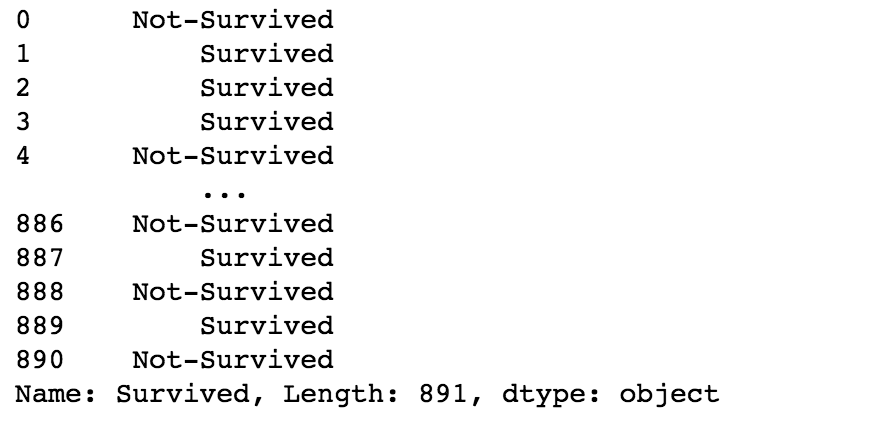
The above code maps the values 0 to ‘Not-Survived’ and 1 to ‘Survived’. You can alternatively use the following code to obtain the same results.
data['Survived'].map({1: 'Survived', 0: 'Not-Survived'})
Replacing values in a DataFrame
Replacing values in a DataFrame involves substituting specific values with other values. This can be achieved using the replace() function in pandas. Additionally, missing values, represented as NaN, can be filled using the fillna() function. Data preprocessing tasks commonly involve performing these operations to clean and prepare data for analysis.
data['Sex'].replace(['male', 'female'], ["M", "F"])
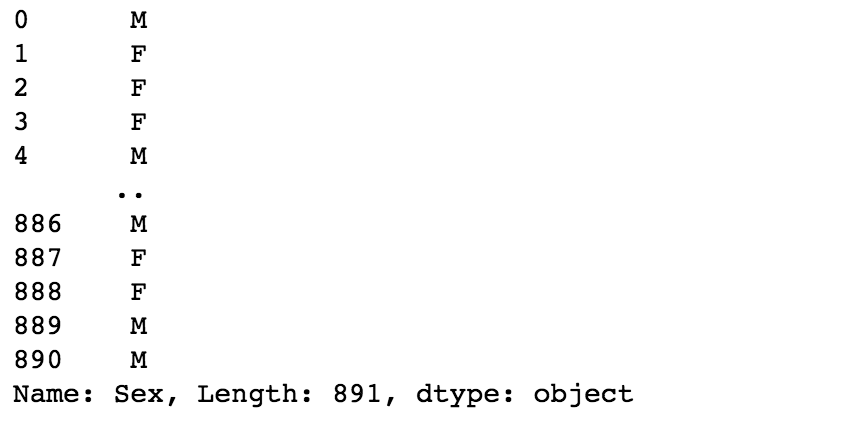
The above code replaces ‘male’ as ‘M’ and ‘female’ as ‘F’.
Save the DataFrame as a CSV file
To save a DataFrame as a CSV file in Python, you can utilize the to_csv() function from the pandas library. This function allows you to specify the file path as a string (str), enabling easy exportation of DataFrame contents to a standard comma-separated values (CSV) file format.
data.to_csv('/path/to/save/the/data.csv', index=False)
The index=False argument does not save the index as a separate column in the CSV.
Additionally, you can include keywords like standard deviation, sort_values, and spreadsheet to perform various operations on the DataFrame before saving it to a CSV file. For example, you may want to calculate the standard deviation of numerical columns, sort the DataFrame based on specific columns using sort_values(), or format the data for compatibility with spreadsheet applications. You can encapsulate these operations within a custom function (def) for efficient and reusable code organization.
References -Pandas Documentation
Conclusion
In conclusion, this comprehensive guide on Python Pandas provides invaluable insights for data manipulation and analysis. From understanding DataFrame fundamentals to advanced techniques like group by operations and data visualization with pivot tables and histograms, this resource serves as a go-to reference for beginners and experienced data scientists alike. With tutorials covering topics such as handling missing values with dropna, mapping values, and saving data to CSV files, this guide equips readers with the tools needed to excel in data analysis tasks. Leveraging the power of Python Pandas, users can efficiently manipulate structured data, perform complex operations, and generate actionable insights. Whether you’re new to data analysis or looking to expand your skills, this guide offers a comprehensive roadmap to mastering Python Pandas.
Key Takeaways
- Pandas is a versatile library for data manipulation in Python, offering a wide range of functions and methods for cleaning, transforming, and analyzing structured data.
- Understanding DataFrame fundamentals is essential for effectively working with tabular data in Pandas, including creating DataFrames, accessing columns/rows, and performing basic operations.
- Techniques like dropping columns/rows, handling duplicates, and renaming columns are crucial for cleaning and preparing data for analysis, ensuring data quality and accuracy.
- Grouping data using the groupby() function allows for efficient summarization and aggregation of data based on specific criteria, facilitating insightful analysis and visualization.
- The map() function in Pandas provides a convenient way to transform values in a Series based on specified mappings or functions, enabling data transformation and preprocessing tasks.
- Saving data to CSV files using Pandas enables easy exportation of DataFrame contents for sharing, storage, or further analysis, enhancing data accessibility and reproducibility.
The media shown in this article is not owned by Analytics Vidhya and is used at the Author’s discretion.
Machine Learning Engineer @ Zoho Corporation


