Artificial Neural Network simplified with 1-D ECG BioMedical Data!
This article was published as a part of the Data Science Blogathon
Introduction:
We have witnessed many Data Science (both Machine Learning and Deep Learning techniques) algorithms in numerous application fields. But in reality, when compared to many applications, there will be very few articles or open-source available for Bio-Medical related signals. We might be wondering about, Bio-Medical field is the hottest research going on right now, and also another interesting thing is knowing about our own human body is always interesting to research when compared to other sophisticated research because it’s our own system. So in this article, we will see some interesting applications that might be helpful for beginners who can understand and explore the field of Bio-Medical Signal Processing with the help of Data Science.
Dimensional in Data:
So before we get into the topic, we must understand basic terminology to understand – ‘Dimensional’. We came across, this word w.r.t to image processing technique right! and in many applications too. Let’s understand what is dimension first then what are the different dimensions in data, Dimension in mathematics can be defined as a measurement (a measure of distance, size, or any region or maybe space), and w.r.t to Physics, Dimension is defined as the magnitude of something in a particular direction. In fact, our lives are encircled by three dimensions.
Different types of Dimensions in Data:
I hope now we understand about dimension, let’s understand about different dimension, predominantly we have,
0-D – Zero Dimensional
1-D- One Dimensional
2-D- Two Dimensional
3-D- Three Dimensional
4-D- Four-Dimensional
Let’s get some deep explanation,
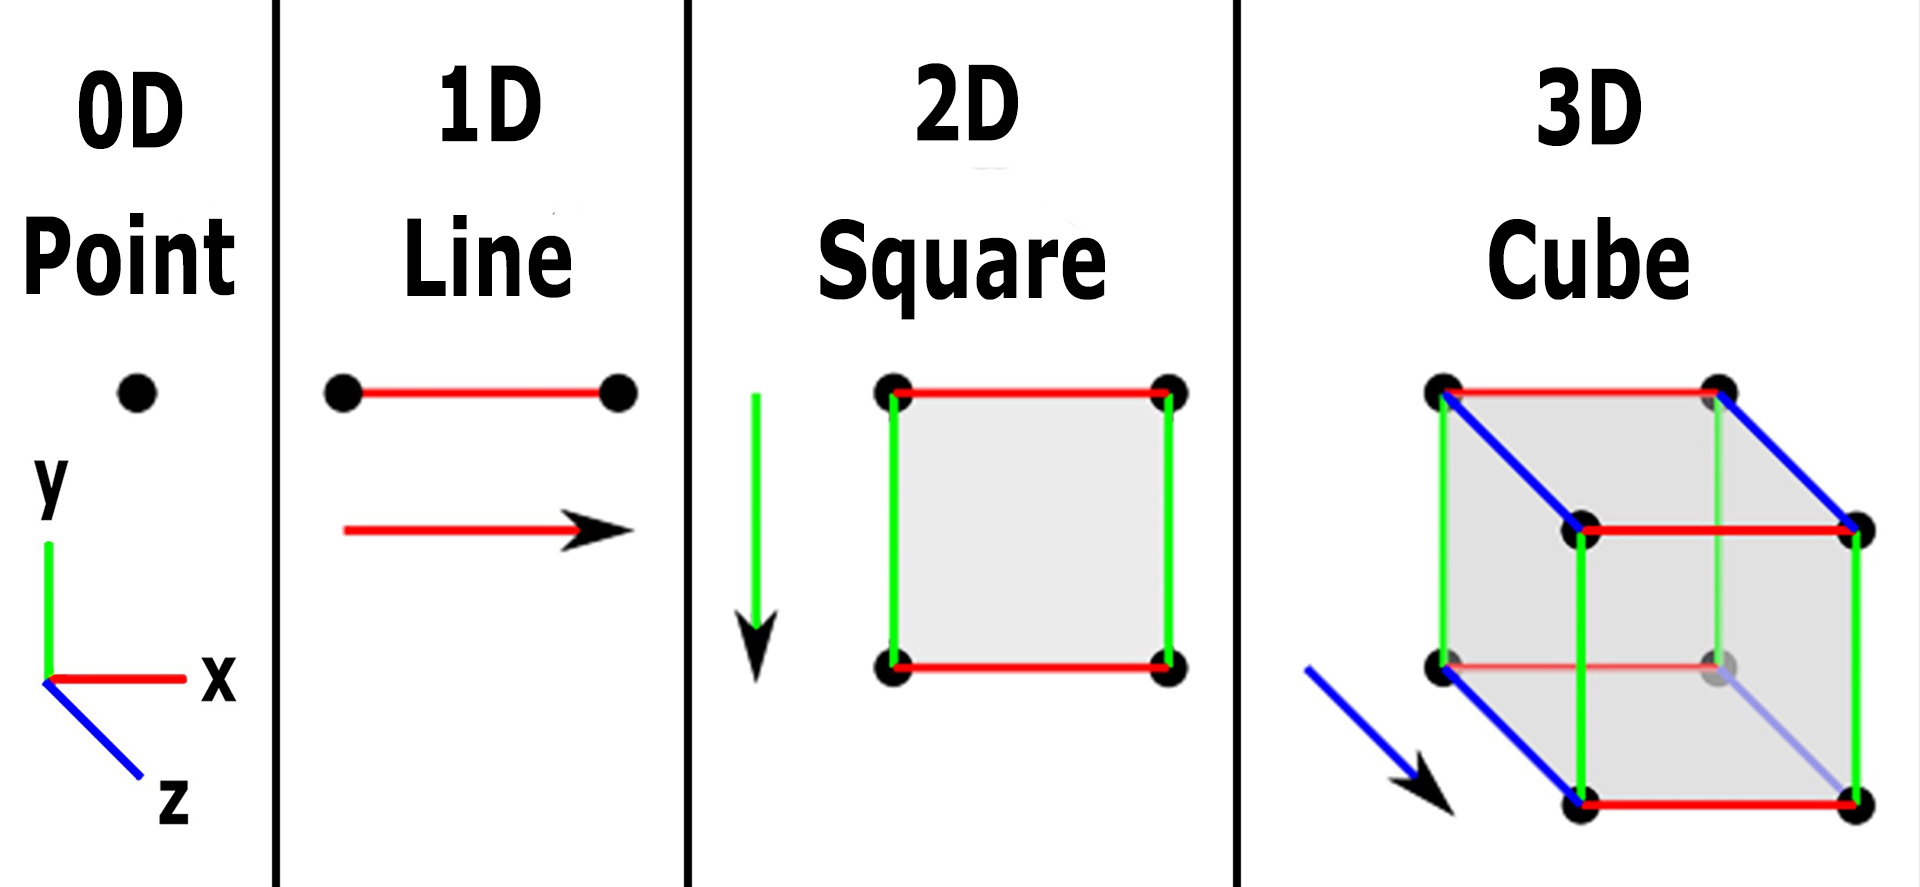
Zero-Dimension:
From the above diagram, we can easily understand that for all simple to complex diagrams, the base point is a dot, so for that DOT, we don’t have any direction or magnitude because of its characteristics. Hence DOT has no dimension.
One-Dimension:
Ok! So what do we do with the dot? let’s draw a straight line, we have two options we can draw a straight line either on the X-axis or on the Y-axis, for a mathematical point of view, let’s assume to draw the line horizontally i.e., the X-axis. So by drawing the line we can easily measure the length right? (how much cm or in m or in any measurement). So from this, we can say that this straight line is one dimension.
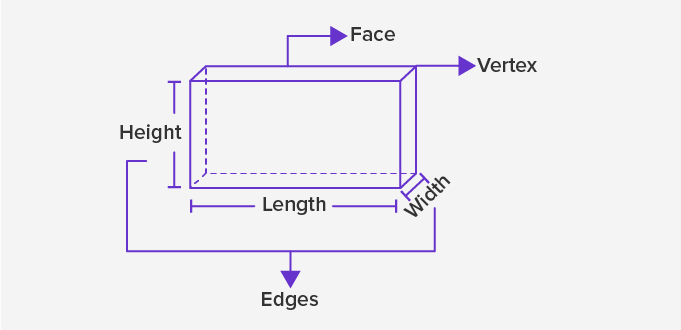
Two-Dimension:
On continuation with One-dimension, (straight line – X-axis), draw another straight line to form a square (X-axis or Y-axis irrespective with one dimensional), Square shape which has two dimensions,i.e., length (first dimension) and width (second dimension), so it has two dimensions.
Three-Dimension:
Again from the continuation from Two Dimension, Square, continue to draw another straight line apart from X and Y axis, i.e., Z-axis, and make a square to cube shape. Now we have length, width as of square shape (two-dimension), and also another newly formed dimension, i.e., height (through cube), so for cube shape, we have three-dimension (by including one straight line from square)
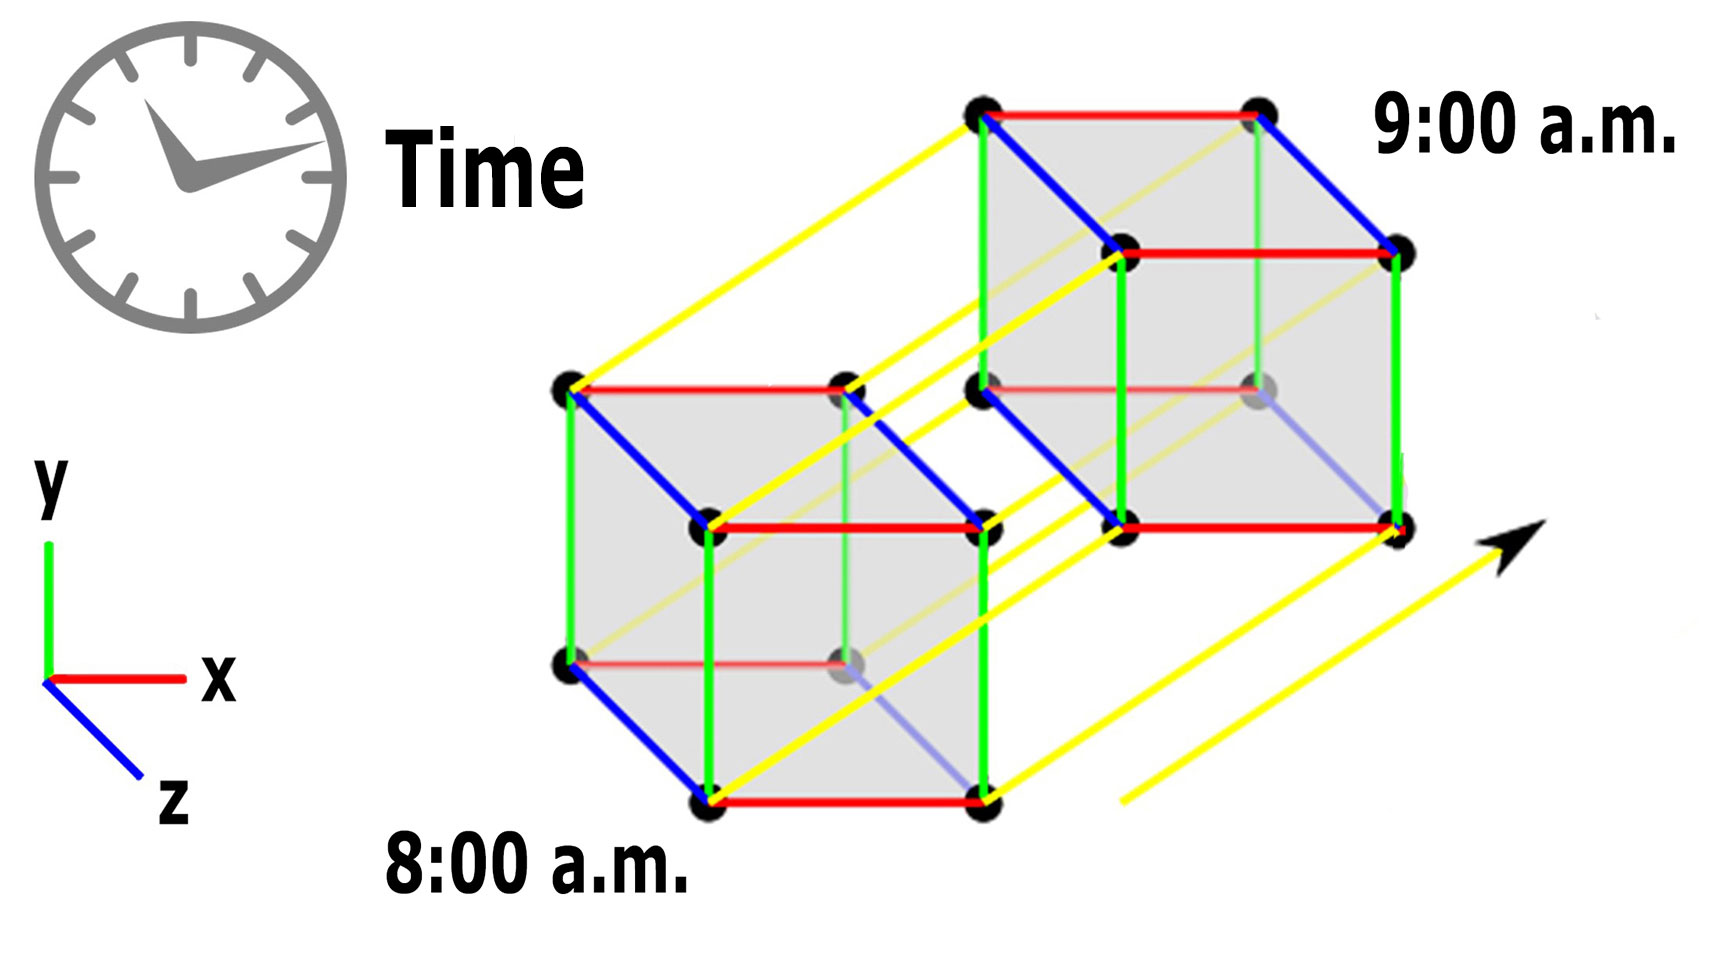
Fourth-Dimension:
Lastly from cube shape (three-dimension), if it’s considered in the point of stationery then it’s in three-dimension when you rotate the same cube from one place to another place say for example in a slide, it moves from a stationary state to non-stationary i.e., moving (one place to another), here if you consider closely, then you can understand another measurement as time (Einstein who introduced 4th dimension – TIME from three-dimension, added time flows in the forward direction only unlike cinematically as TIME MACHINE concept – Reverse process which is practically not possible)
What is Bio-Signal Processing:
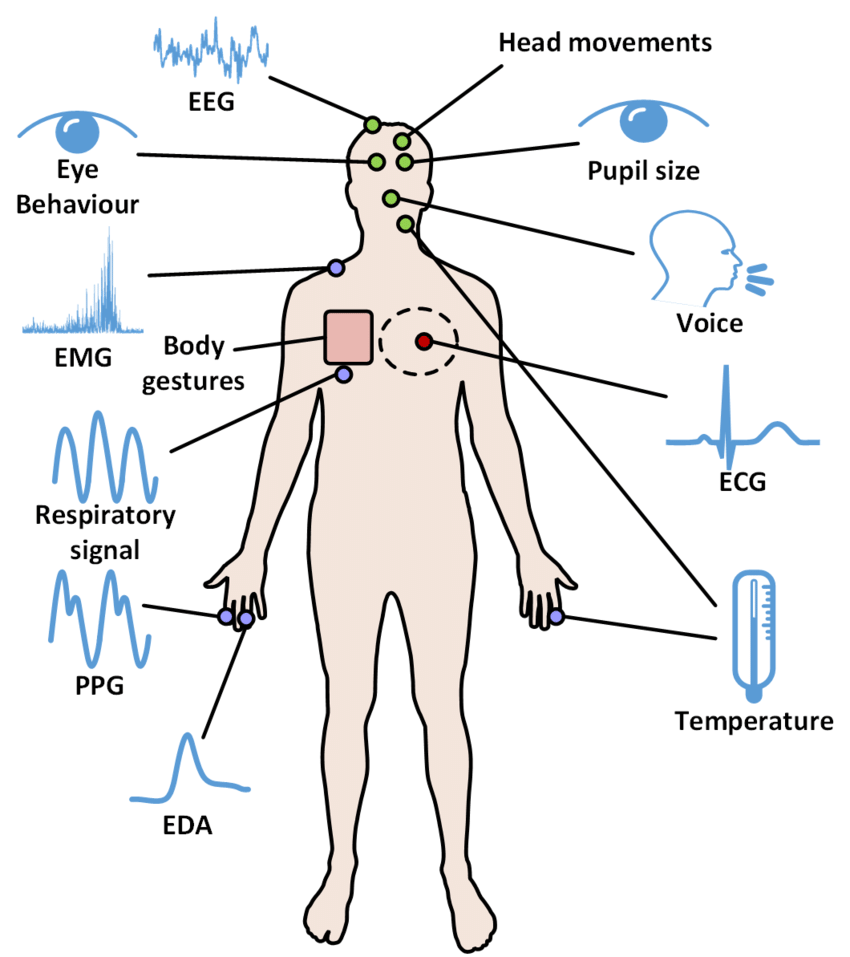
We are running behind machines to do smart work in this data science or artificial intelligence-related technology. But our own human body is a natural machine and are regularly communicating about our health too and from this machine, through some natural sensors (through physiological instruments like ECG, EEG, PPG…) like heart, brain, skin, fingers and other parts, we can able get some useful information or we call it as DATA (maybe through image or through numbers) in simple. Still, our human body is a BLACK-BOX, discovering so much useful research like how we can alarm ourselves before our human body may damage any organs or life-threatening problems.
So signals that we are getting from living things like from our human body, we call it as Bio-Medical signal. From that signal we are going to process and analyze it, to get some useful information related to our health we call it Biomedical Signal Processing in simple. In another word, it’s almost replacing doctors physically and from the ML/ DL technology we can come to know whether we are normal or abnormal, detecting some abnormalities from the Medical Image. For example, measuring heart rate, oxygen saturation, or even blood pressure at home is practically feasible today, either using a mobile phone (high-end Samsung or iPhone users) or using some low-cost special gadgets.
Some important Bio-Signals:
ElectroCardioGram:
ECG is the abbreviated term for an electrocardiogram, which means it is used to record the electrical activity in simple working conditions of our heart from different perspectives or angles we call it technically. For most of them, if we say about ECG, they visualize the spikes, some people recognize it as PQRST-U waveform. To be simple our whole life is closely related to this PQRST-U rhythm only. There are so many patterns that occur in this rhythm and from that, if we monitored properly we can save most of our life from many deadly diseases too. As ECG signal has some regular pattern that we visually see through a monitor or get from electrodes, if some person is going to get heart attack let us consider, through some pattern change from the regular one we can easily find out well in advance from ECG, so that we can take some precautionary method either by taking some medication or admit in hospital.
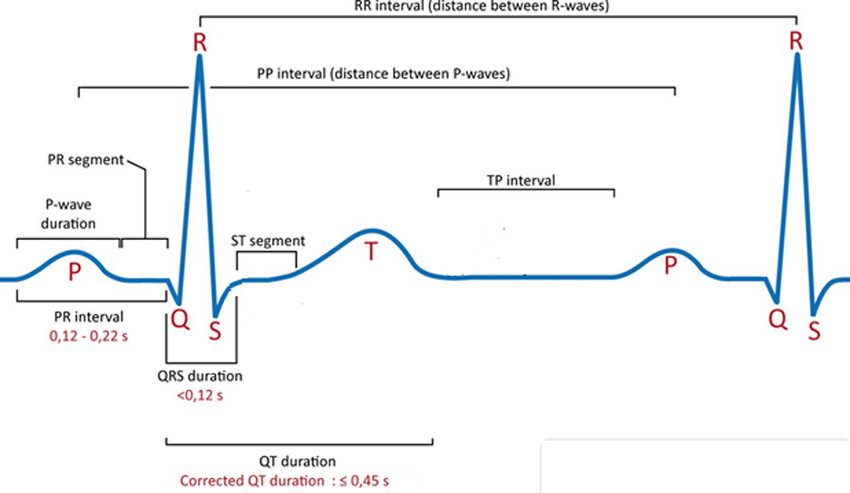
Some of the terms are explained as,
P Waves – Atrial Depolarization (electrical shift between negative and positive ions)
PR Interval – Start of the P wave and ends at the beginning of the Q wave
QRS Complex – Ventricle Depolarization
ST-Segment – Starts at the end of the S wave and ends at the beginning of the T wave
T Wave- Ventricular Repolarization
RR Interval – Between QRS complex
QT Interval – Starts at the beginning of QRS complex and ends at T wave
Open-Source for ECG Database:
There are many open sources available for collecting ECG real data. But among the most famous database is https://physionet.org/ .Here you can get efficient raw signals to work in ECG-based applications.
Artificial Neural Network:
We discussed already Artificial Neural Network (ANN) in detail in the following article with python code. Please find the link for better understanding, (https://www.analyticsvidhya.com/blog/2021/06/artificial-neural-networks-better-understanding/)
ANN – ECG Python Code:
Dataset: https://www.kaggle.com/shayanfazeli/heartbeat
#importing some basic libraries
import numpy as np
import pandas as pd
import seaborn as sns
import matplotlib.pyplot as plt
from sklearn.model_selection import train_test_split
from imblearn.over_sampling import SMOTE
#importing datasets
normal = pd.read_csv('ptbdb_normal.csv')
abnormal = pd.read_csv('ptbdb_abnormal.csv')
#viewing normal dataset
normal.head()
#viewing abnormal dataset
abnormal.head()
#dimenion for normal
normal.shape
#dimension for abnormal
abnormal.shape
#changing the random column names to sequential - normal
#as we have some numbers name as columns we need to change that to numbers as
for normals in normal:
    normal.columns = list(range(len(normal.columns)))
#viewing edited columns for normal data
normal.head()
#changing the random column names to sequential - abnormal
#as we have some numbers name as columns we need to change that to numbers as
for abnormals in abnormal:
    abnormal.columns = list(range(len(abnormal.columns)))
#viewing edited columns for abnormal data
abnormal.head()
#combining two data into one
#suffling the dataset and dropping the index
#As when concatenating we all have arranged 0 and 1 class in order manner
dataset = pd.concat([normal, abnormal], axis=0).sample(frac=1.0, random_state =0).reset_index(drop=True)
#viewing combined dataset
dataset.head()
#whole dataset size
dataset.shape
#basic info of statistics
dataset.describe()
#basic information of dataset
dataset.info()
#viewing the uniqueness in dataset
dataset.nunique()
#skewness of the dataset
#the deviation of the distribution of the data from a normal distribution
#+ve mean > median > mode
#-ve mean < median < mode
dataset.skew()
#kurtosis of dataset
#identifies whether the tails of a given distribution contain extreme values
#Leptokurtic indicates a positive excess kurtosis
#mesokurtic distribution shows an excess kurtosis of zero or close to zero
#platykurtic distribution shows a negative excess kurtosis
dataset.kurtosis()
#missing values any from the dataset
print(str('Any missing data or NaN in the dataset:'), dataset.isnull().values.any())
#data ranges in the dataset - sample
print("The minimum and maximum values are {}, {}".format(np.min(dataset.iloc[-2,:].values), np.max(dataset.iloc[-2,:].values)))
#correlation for all features in the dataset
correlation_data =dataset.corr()
print(correlation_data)
#visulaization for correlation
plt.figure(figsize=(10,7.5))
sns.heatmap(correlation_data, annot=True, cmap='BrBG')
#for target value count
label_dataset = dataset[187].value_counts()
label_dataset
#visualization for target label
label_dataset.plot.bar()
#splitting dataset to dependent and independent variable
X = dataset.iloc[:,:-1].values #independent values / features
y = dataset.iloc[:,-1].values #dependent values / target
#checking imbalance of the labels
from collections import Counter
counter_before = Counter(y)
print(counter_before)
#applying SMOTE for imbalance
oversample = SMOTE()
X, y = oversample.fit_resample(X, y)
#after applying SMOTE for imbalance condition
counter_after = Counter(y)
print(counter_after)
#splitting the datasets for training and testing process
X_train, X_test, y_train, y_test = train_test_split(X, y, test_size =0.3, random_state=42)
#size for the sets
print('size of X_train:', X_train.shape)
print('size of X_test:', X_test.shape)
print('size of y_train:', y_train.shape)
print('size of y_test:', y_test.shape)
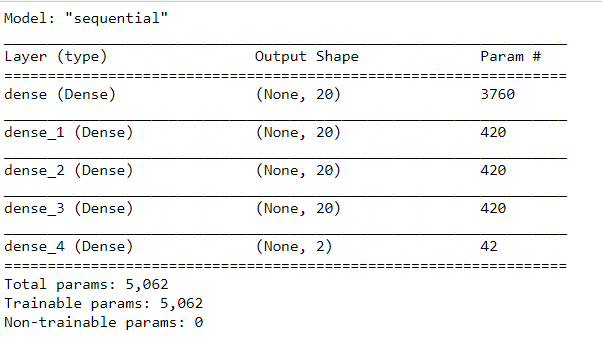
#ANN
import tensorflow as tf
# Create / initialize sequential model
ann_model = tf.keras.models.Sequential()
#Dense layer as first layer with 10 neurons, input share (187,) and and leaky Relu activation
ann_model.add(tf.keras.layers.Dense(20, activation=tf.keras.layers.LeakyReLU(alpha=0.001), input_shape=(187,)))
#Dense layer as second layer with 10 neurons and leaky Relu activation
ann_model.add(tf.keras.layers.Dense(20, activation=tf.keras.layers.LeakyReLU(alpha=0.001)))
#Dense layer as third layer with 10 neurons and leaky Relu activation
ann_model.add(tf.keras.layers.Dense(20, activation=tf.keras.layers.LeakyReLU(alpha=0.001)))
#Dense layer as fourth layer with 10 neurons and leaky Relu activation
ann_model.add(tf.keras.layers.Dense(20, activation=tf.keras.layers.LeakyReLU(alpha=0.001)))
#Softmax as last layer with two outputs
ann_model.add(tf.keras.layers.Dense(2, activation='softmax'))
ann_model.compile(optimizer='adam', loss='sparse_categorical_crossentropy', metrics=['accuracy'])
ann_model.summary()
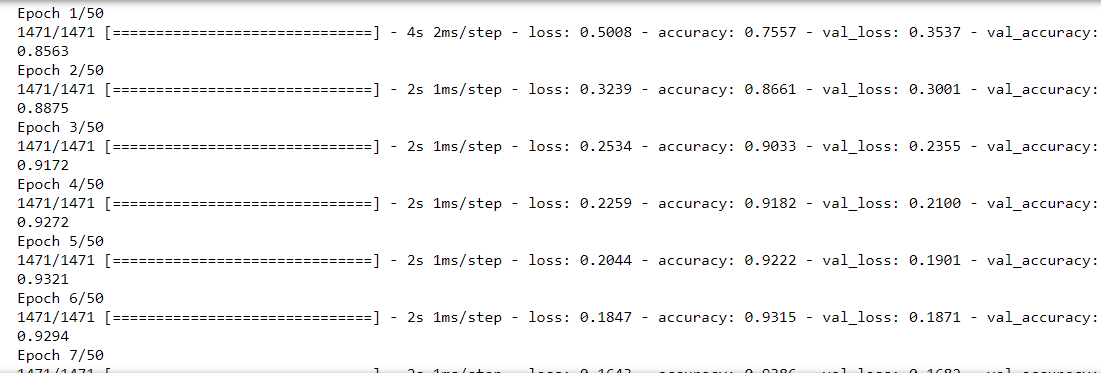
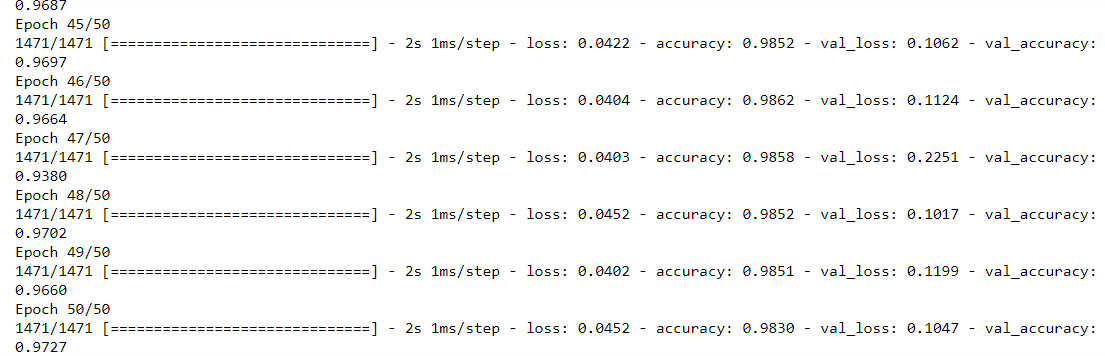
ann_model_history = ann_model.fit(X_train, y_train, epochs=50, batch_size = 10, validation_data = (X_test, y_test))
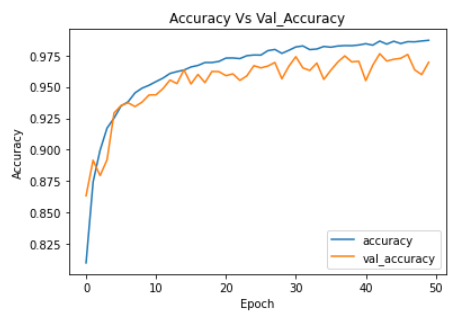
plt.plot(ann_model_history.history['accuracy'])

plt.plot(ann_model_history.history['val_accuracy'])

plt.legend(["accuracy","val_accuracy"])

plt.title('Accuracy Vs Val_Accuracy')

plt.xlabel('Epoch')

plt.ylabel('Accuracy')
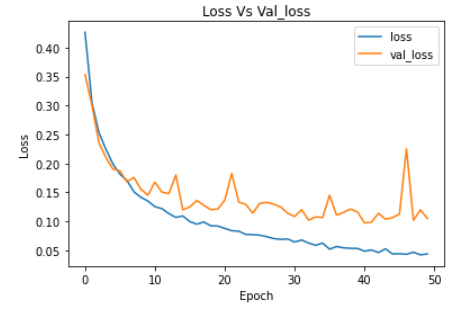
plt.plot(ann_model_history.history['loss'])
plt.plot(ann_model_history.history['val_loss'])
plt.legend(["loss","val_loss"])
plt.title('Loss Vs Val_loss')
plt.xlabel('Epoch')
plt.ylabel('Loss')
For Github link: github.com/anandprems/physionet_ptbdb_ann
EndNote:
Did you find this article helpful? Please share your opinions/thoughts in the comments section below. Learn from mistakes is my favourite quote, if you found anything wrong too, just highlight it, I am ready to learn from the learners like you people.
About me in short, I am Premanand.S, Assistant Professor Jr and a researcher in Machine Learning. Love to teach and love to learn new things in Data Science. Mail me for any doubt or mistake, [email protected], and my Linkedin https://www.linkedin.com/in/premsanand/


