Welcome to this comprehensive guide on model evaluation and selection techniques in machine learning, particularly focusing on K-fold cross-validation and its application in time series analysis. Before delving into the specifics, let’s consider the importance of these techniques in monitoring model performance before deployment. Understanding the performance metrics such as mean squared error, which evaluates the deviation between predicted and observed values, is crucial in ensuring model accuracy. We will explore how K-fold cross-validation, especially in the context of time series data, helps in training and validating models using multiple train-test splits.
By employing K-fold cross-validation, with features like test_index and train_index, we can mitigate overfitting and understand how the model generalizes to unseen data. Furthermore, we will examine the role of neural networks in classification tasks, highlighting their application in subsamples and their ability to learn complex patterns. Join us on this journey to optimize your machine learning models and enhance their performance.
This article was published as a part of the Data Science Blogathon.
Machine learning model performance assessment is just like assessing the scores, how we used to evaluate our sores in high schools and colleges for the meeting the eligibility criteria for getting the best courses or getting selected in the campus interviews for companies for the job and clearing cut-off scores for many more competition exams for getting selected. So apparently, the GOOD score recognizes the fact that the candidate is always good. The same is been expected in the machine learning model, and that should achieve the expected results in predictions/forecasting/calcification problem statements. Even in the ML world, the model has been trained in the context of data, model, and code.
The accuracy of a model in data science is computed as a metric to understand how well it performs in predicting outcomes. It measures the proportion of true predictions made by different models built using available data records. To achieve robust performance, these models are trained across various combinations of data, ensuring they can generalize well to new data and improve accuracy.
As we know, there are various methods to evaluate model performance. It is our team’s responsibility to construct a robust and generalized model that meets production expectations. Additionally, we need to effectively communicate its performance and the business benefits to stakeholders and customers, guided by SMEs, to achieve our goals.
As we are an ML engineer team, we must provide the performance of the model in the numeric range. Let’s say the performance of the model would be 85-90%. Sometimes the performance of the model in training and testing will not behave the same in production, in many cases, Overfitting or Underfitting will be experienced during the production environment.
Yes! Of course, this is really threatening to junior Data scientists and ML Engineers, but the challenge is one requires to improvise your technical capabilities, right? , So after many iterations and CI/CD involvement (MLOps), only the model will achieve the accuracy as expected and in a generalised mode. One step further, always we have to monitor the performance and apply the necessary changes to the model algorithm and code.
Will see how we could overcome this in the real-time, scenario.
As I mentioned earlier the RANGE-Factor, we have different techniques to evaluate, in which Cross-Validation or 5 fold cross validation is best and easy to understand. This is simple in nature and involves a typical resampling technique, without any replacement in the data. And easily we could understand and visualise while implementing.
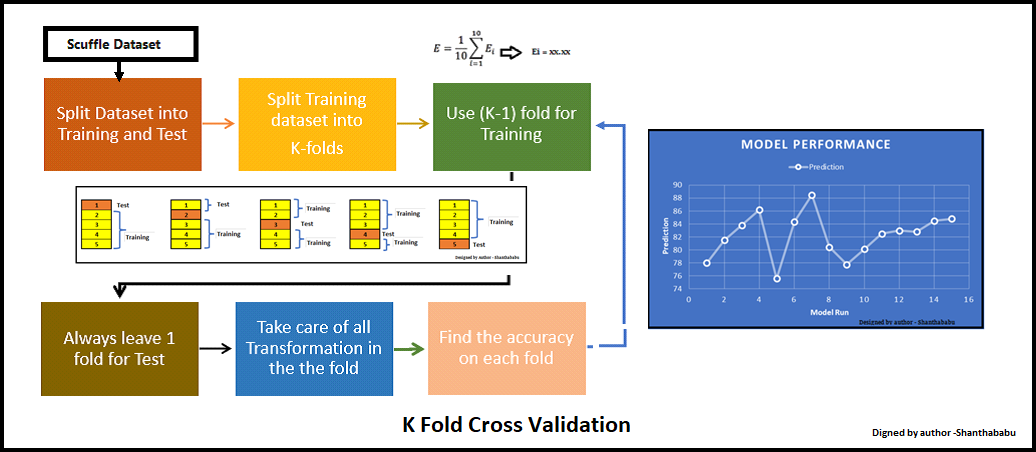
K-fold cross validation in machine learning cross-validation is a powerful technique for evaluating predictive models in data science. It involves splitting the dataset into k subsets or folds, where each fold is used as the validation set in turn while the remaining k-1 folds are used for training. This process is repeated k times, and performance metrics such as accuracy, precision, and recall are computed for each fold. By averaging these metrics, we obtain an estimate of the model’s generalization performance. This method is essential for model assessment, selection, and hyperparameter tuning, offering a reliable measure of a model’s effectiveness. Compared to leave-one-out cross-validation, which uses k equal to the number of samples, K-fold cross-validation is computationally efficient and widely used in practice.
In each set (fold) training and the test would be performed precisely once during this entire process. It helps us to avoid overfitting. As we know when a model is trained using all of the data in a single short and give the best performance accuracy. To resist this k fold cross validation in machine learning cross-validation helps us to build the model is a generalized one.
To achieve this K-Fold Cross Validation, we have to split the data set into three sets, Training, Testing, and Validation, with the challenge of the volume of the data.
Here Test and Train data set will support building model and hyperparameter assessments.
In which the model has been validated multiple times based on the value assigned as a parameter and which is called K and it should be an INTEGER.
Make it simple, based on the K value, the data set would be divided, and train/testing will be conducted in a sequence way equal to K time.
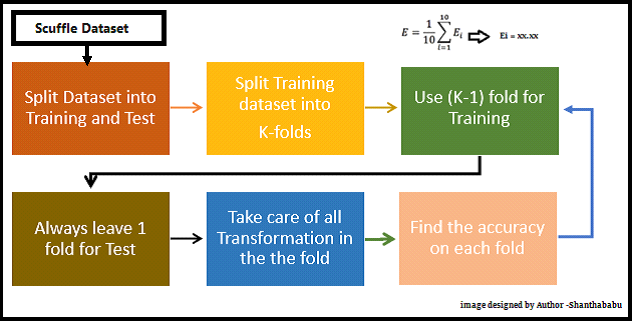
Image designed by the author
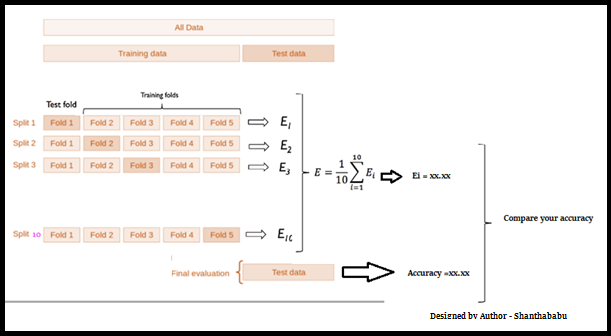
Let’s have a generalised K value. If K=5, it means, in the given dataset and we are splitting into 5 folds and running the Train and Test. During each run, one fold is considered for testing and the rest will be for training and moving on with iterations, the below pictorial representation would give you an idea of the flow of the fold-defined size.
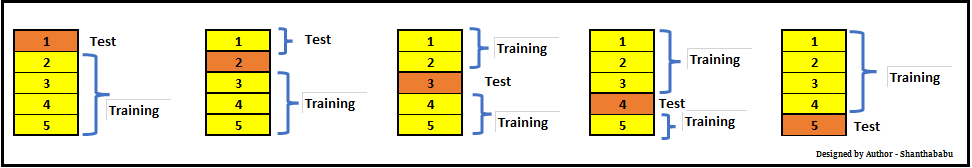
In which each data point is used, once in the hold-out set and K-1 in Training. So, during the full iteration at least once, one fold will be used for testing and the rest for training.
In the above set, 5- Testing 20 Training. In each iteration, we will get an accuracy score and have to sum them and find the mean. Here we can understand how the data is spread in a way of consistency and will make a conclusion whether to for the production with this model (or) NOT.
Now, we will discuss a few thumb rules while playing with K – fold
Please remember K-Fold Cross Validation for the below purpose in the ML stream.
So far, we have discussed the K Fold and its way of implementation, let’s do some hands-on now.
Cross-validation is a method to evaluate the performance of a model on data it has not been trained on. It’s basically a method to determine if your model is too fixated on the particular training data it received (overfitting) and would struggle with unfamiliar data.
This is how it operates:
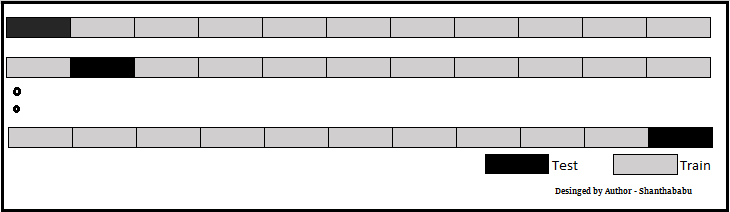
I am creating a simple array, defining the K size as 5 and splitting my array. Using the simple loop and printing the Train and Test portions. Here we could see clearly that the data points in TT buckets and Test data are unique in each cycle.
Python Code:
You can see the Train and Test array and how the array got split in every iteration.
Let’s do this with the dataset.
from sklearn.linear_model import LogisticRegression
from sklearn.svm import SVC
from sklearn.ensemble import RandomForestClassifier
import numpy as np
from sklearn.datasets import load_digits
import matplotlib.pyplot as plt
digits = load_digits()
from sklearn.model_selection import train_test_split
X_train, X_test, y_train, y_test = train_test_split(digits.data,digits.target,test_size=0.3)
imported required libraries and loaded digits (hand-written digits – open source), let’s apply a different algorithm.
I am using liblinear. This is the “Large Linear Classification” category. It uses a Coordinate-Descent Algorithm. This would minimize a multivariate function by resolving the univariate and its optimization problems during the loop.
lr = LogisticRegression(solver='liblinear',multi_class='ovr')
lr.fit(X_train, y_train)
lr.score(X_test, y_test)
Output
Score : 0.972222
Just using gamma is a parameter for non-linear perspective for hyperplanes. The value of the gamma tries to fit the training data set and uses 1/n_features.
svm = SVC(gamma='auto')
svm.fit(X_train, y_train)
svm.score(X_test, y_test)
Output
Score : 0.62037
For RFC, I am assigning estimators as 40.
rf = RandomForestClassifier(n_estimators=40)
rf.fit(X_train, y_train)
rf.score(X_test, y_test)
Output
Score: 0.96666
Scores from the above list of algorithms Logistic Regression and Random Forest are doing comparatively better than SVM.
Now will use cross_val_score function and get the scores, passing different algorithms with dataset and cv.
from sklearn.model_selection import cross_val_score
Set LogisticRegression, CV =3
score_lr=cross_val_score(LogisticRegression(solver='liblinear',multi_class='ovr'), digits.data, digits.target,cv=3)
print(score_lr)
print("Avg :",np.average(score_lr))
Output: for 3 fold we have 3 scores
[0.89482471 0.95325543 0.90984975]
Avg : 0.9193099610461881
Set SVM and CV=3
score_svm =cross_val_score(SVC(gamma='auto'), digits.data, digits.target,cv=3)

print(score_svm)

print("Avg :",np.average(score_svm))
Output: Scores
[0.38063439 0.41068447 0.51252087]
Avg : 0.4346132442960489
Set Random Forest and CV=3
score_rf=cross_val_score(RandomForestClassifier(n_estimators=40),digits.data, digits.target,cv=3)

print(score_rf)

print("Avg :",np.average(score_rf))
Output: Scores
[0.92821369 0.95325543 0.92320534]
Avg : 0.9348914858096827
| Before K Fold apply | After K Fold applied (Avg) | |
| Logistic Regression | 97% | 91% |
| SVM | 62% | 43% |
| Random Forest | 96% | 93% |
Based on the above table, we will go with Random Forest for this dataset for production. But we have to monitor the model performance based on the data drift and as the business case changes, we have to revisit the model and redeploy.
Let us consider the RandomForestClassifier for this analysis, and n_estimators is our parameter for this case and CV as 10 (commonly used)
scores1 = cross_val_score(RandomForestClassifier(n_estimators=5),digits.data, digits.target, cv=10)

print("Avg Score for Estimators=5 and CV=10 :",np.average(scores1))
Output
Avg Score for Estimators=5 and CV=10 : 0.87369
scores2 = cross_val_score(RandomForestClassifier(n_estimators=20),digits.data, digits.target, cv=10)

print("Avg Score for Estimators=20 and CV=10 :",np.average(scores2))
Output
Avg Score for Estimators=20 and CV=10 : 0.93377
scores3 = cross_val_score(RandomForestClassifier(n_estimators=30),digits.data, digits.target, cv=10)

print("Avg Score for Estimators=30 and CV=10 :",np.average(scores3))
Output
Avg Score for Estimators=30 and CV=10 : 0.94879
scores4 = cross_val_score(RandomForestClassifier(n_estimators=40),digits.data, digits.target, cv=10)

print("Avg Score for Estimators=40 and CV=10 :",np.average(scores4))
Output
Avg Score for Estimators=40 and CV=10 : 0.94824
| scores1 | 87.36% |
| scores2 | 93.33% |
| scores3 | 94.87% |
| scores4 | 94.82% |
Based on the above observation, we will go with Estimators=30.
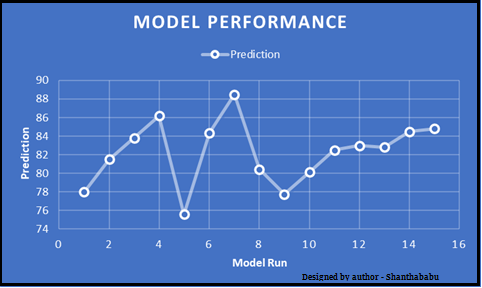
Visual representation is always the best evidence for any data which is located across the axes.
from sklearn.model_selection import cross_val_score
knn = KNeighborsClassifier(n_neighbors=5)
scores = cross_val_score(knn, X, y, cv=10, scoring='accuracy')
print(scores.mean())
Output
0.9666666666666668
k_range = list(range(1, 25))
k_scores = []
for k in k_range:
    knn = KNeighborsClassifier(n_neighbors=k)
    scores = cross_val_score(knn, X, y, cv=10, scoring='accuracy')
    k_scores.append(scores.mean())
print(k_scores)
Output
[0.96, 0.95333, 0.96666, 0.96666, 0.966668, 0.96666, 0.966666, 0.966666, 0.97333, 0.96666, 0.96666, 0.97333, 0.9800, 0.97333, 0.97333, 0.97333, 0.97333, 0.98000, 0.9733333, 0.980000, 0.966666, 0.96666, 0.973333, 0.96, 0.96666, 0.96, 0.96666, 0.953333, 0.95333, 0.95333]
import matplotlib.pyplot as plt
%matplotlib inline
plt.plot(k_range, k_scores)
plt.xlabel('Value of K for KNN')
plt.ylabel('Cross-Validated-Accuracy')
Output: With a simple plot, X=> value of K and Y=> Accuracy for respective CV
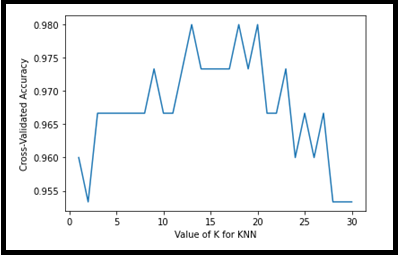
The above visual representation helps us to understand the accuracy is ~98%for K=12,18 and 19 for KNN.
Employing K fold cross validation enables a comprehensive evaluation of model performance by partitioning the entire dataset into K equal-sized subsets. This method allows us to mitigate the impact of imbalanced data and provides reliable cross-validation results for deep learning models. By selecting the appropriate hyperparameters based on these results, we can optimize model performance and enhance its generalization ability across the entire dataset.
A. K-fold cross-validation splits data into k equal parts; each part serves as a test set while the others form the training set, rotating until every part has been tested.
A. It is useful because it maximizes the use of limited data, reduces variance in performance estimates, and provides a more reliable model evaluation.
A. K represents the number of splits or folds into which the data is divided, determining how many times the model is trained and tested.
A. K-fold and V-fold cross-validation are essentially the same; both involve dividing the data into k or v folds. The terms are often used interchangeably.
The media shown in this article is not owned by Analytics Vidhya and are used at the Author’s discretion.
Shanthababu has 20+ years of experience in Information Technology (IT). Expertise in ML & Data Architect and Program Delivery. Analytics and AIML Solutions Lead, Data Architecting, Modelling, Data Quality, Data Governance, Data Privacy and Data Integration, Data Platform, Data analysis and Data Science program.
Lorem ipsum dolor sit amet, consectetur adipiscing elit,


Q1 Can Stratified k-fold split be committed on the same dataset wherein we commit Train-Test Split? Q2 How do we initiate Data Scaling/Data Normalization/Data Transformation on a k-fold split? Is this step done post the split or before k-fold split? Reference codes would be useful.
Hello @Shanthababu . I think this is one of the best articles I have read so far on "K-Fold Cross Validation". All the images that you used in your blog are self-explanatory and awesomely explain the concept, and then reading the theory part is extra topping on that. Thank you, Shanthababu. Please keep up the good work and do not try to dishearten yourself.
Hi, Just to clarify, after we use kfold with our various models we choose the one that has similar score values to the model ? How do we comapre our kfold scores with the model performance scores to pick the best model ?