This article was published as a part of the Data Science Blogathon.
Today’s world is data-driven. Data has the potential to unlock the success of every industry, from releasing ideas to enhancing decision-making processes. Data has profoundly changed the world as we know it, to the point that it’s impossible to function without the insights gained from data in every discipline.
In India, data science has proven to be a lucrative career. The reason for this is a scarcity of qualified candidates to fill the positions. Processes, algorithms, scientific methods, and systems are used in data science to acquire knowledge and insights in the form of structured and unstructured data using mathematics, statistics, and machine learning to collect data and then apply the knowledge and actionable insights to any given application domain.
Organizations use data and analytics for a variety of purposes. Let us analyze the data on the salaries of various Data Professionals in India and understand the job market.

Image: https://www.pexels.com/photo/people-using-smartphones-near-paperwork-on-white-table-7793694/
The Data
The data has been collected by Sourav Banerjee and put on Kaggle. Salaries for Data Scientists, Machine Learning Engineers, Data Analysts, and Data Engineers in various cities throughout India are provided in this dataset (2022). Click here to check the list of data.
The data is collected from Glassdoor.
The data has 5 features:
-
The company
-
The job title
-
The number of salaries reported for the job title
-
Location of the job
-
Job salary
Analysis and Study
First, we’ll import the python libraries.
import numpy as np # linear algebra
import pandas as pd # data processing, CSV file I/O (e.g. pd.read_csv)
import seaborn as sns
import matplotlib.pyplot as plt
import re
import plotly.graph_objects as go
import plotly.io as pio
import plotly.express as px
%matplotlib inline
Now, we’ll read the data and have a look at the data.
df = pd.read_csv("/kaggle/input/analytics-industry-salaries-2022-india/Salary Dataset.csv")
df.sample(10)
Output:
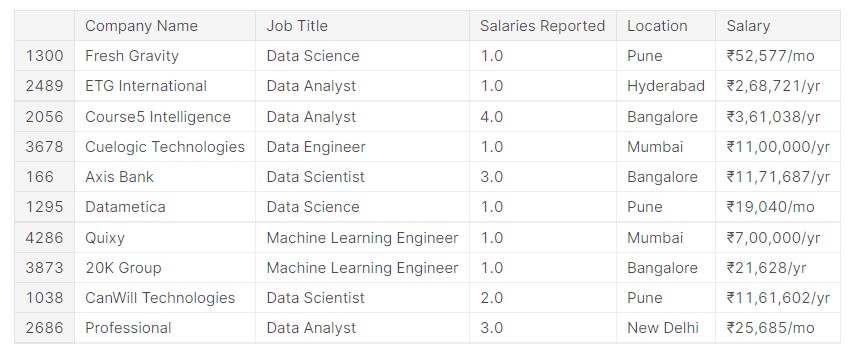
We can see that the data is well-formatted.
Let us see the shape of the data.
df.shape
Output:
(4344, 5)
So, we can see that the data has over 4000 entries and 5 features.
Let us check the column names.
df.columns
Output:
Index(['Company Name', 'Job Title', 'Salaries Reported', 'Location', 'Salary'], dtype='object')
So, as we saw, there are 5 columns in the data.
df.info()
Output:
RangeIndex: 4344 entries, 0 to 4343
Data columns (total 5 columns):
 #   Column             Non-Null Count  Dtype
---  ------             --------------  -----
 0   Company Name       4341 non-null   object
 1   Job Title          4344 non-null   object
 2   Salaries Reported  4342 non-null   float64
 3   Location           4344 non-null   object
 4   Salary             4344 non-null   object
dtypes: float64(1), object(4)
memory usage: 169.8+ KB
Let us check if there are any missing values in our data.
df.isnull().sum()
Output:
Company Name         3
Job Title            0
Salaries Reported    2
Location             0
Salary               0
dtype: int64
So, there is some missing data.
Let us see the unique job titles.
df["Job Title"].unique()
Output:
array(['Data Scientist', 'Data Science Associate',
       'Data Science Consultant', 'Data Science', 'Senior Data Scientist',
       'Junior Data Scientist', 'Lead Data Scientist',
       'Data Science Manager', 'Data Scientist - Trainee',
       'Data Science Lead', 'Data Analyst', 'Data Engineer',
       'Machine Learning Engineer', 'Machine Learning Software Engineer',
       'Software Engineer - Machine Learning',
       'Machine Learning Engineer/Data Scientist',
       'Machine Learning Consultant', 'Machine Learning Data Associate',
       'Machine Learning Data Associate I', 'Machine Learning Associate',
       'Machine Learning Data Associate II',
       'Associate Machine Learning Engineer',
       'Machine Learning Data Analyst',
       'Senior Machine Learning Engineer', 'Machine Learning Scientist',
       'Machine Learning Developer'], dtype=object)
There are a wide variety of job descriptions. We will discuss more on these later.
The job locations are as follows:
df["Location"].unique()
Output:
array(['Bangalore', 'Pune', 'Hyderabad', 'New Delhi', 'Mumbai'],
      dtype=object)
We remove the data points with missing values.
df=df.dropna()
Now, in some data points, currencies vary from INR. We convert everything to USD so that there is uniformity, and then we can compare it to global standards.
First, we get the wage unit values.
df['Salary'].apply(lambda c: c.split('/')[-1]).unique()
Output:
array(['yr', 'mo', 'hr'], dtype=object)
The wages are calculated on a yearly, monthly and hourly basis.
Now, we get the currencies.
df['Salary'].apply(lambda c: c[0]).unique()
Output:
array(['₹', '$', '£', 'A'], dtype=object)
The currencies are Indian Rupee, US Dollar, Great Britain Pound and Afghan Afghani.
The currencies value will be converted to US dollars and hourly wages to yearly wages. For hourly wages, the number of working days is taken as 240 and 8 hours daily work.
def convert(sal):
    currency = sal[0]
    time = sal.split('/')[-1]
    salary = float(sal.split('/')[0][1:].replace(',','').replace('FN',''),)
    if currency == '₹':
        salary = salary * 0.013
    elif currency == '£':
        salary *= 1.36
    elif currency == 'A':
        salary *= 0.011
    if time == 'mo':
        salary *= 12
    elif time == 'hr':
        salary *= 1920
    return salary
df['Salary($)USD /Year'] = df['Salary'].apply(convert)
The function is applied to the data.
df=df.drop('Salary', axis=1)
The old salary column is removed from the data.
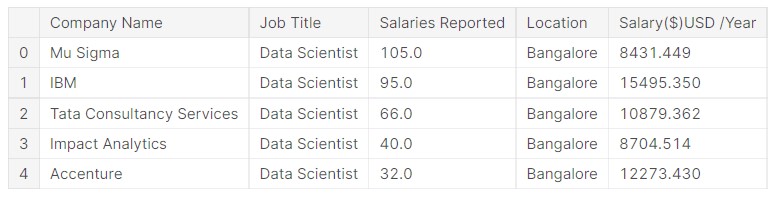
The data looks like this now.
df.head()
Output:
Let us see which companies are the most frequent in the data.
# Verify the First 50 Companies in the dataset.
df['Company Name'].value_counts().head(50)
Output:
Tata Consultancy Services                    41
Amazon                                       31
Accenture                                    30
Google                                       27
IBM                                          26
Fresher                                      26
First Student                                25
Infosys                                      23
DONE by NONE                                 21
Cognizant Technology Solutions               21
ABC                                          20
Capgemini                                    17
Microsoft                                    17
Wipro                                        17
Deloitte                                     16
LTI                                          16
Tech Mahindra                                16
Nones                                        15
HCL Technologies                             14
Quantiphi                                    14
Wipro Technologies                           14
Fractal                                      14
Genpact                                      13
Optum                                        12
Freelancer                                   11
Honeywell                                    10
PwC                                          10
ZS Associates                                10
DXC Technology                               10
Anonymous                                     9
NTT DATA                                      9
EY                                            9
Dell Technologies                             9
Mu Sigma                                      9
TCS                                           9
Jio                                           9
ICICI Bank                                    9
Reliance Industries                           9
American Express                              9
KPMG                                          9
XYZ                                           9
Virtusa                                       9
Optum Global Solutions                        8
WNS                                           8
Mindtree                                      8
J.P. Morgan                                   8
Tata Consultancy Services (North America)     8
Atos-Syntel                                   8
Oracle                                        8
EMPLOYERS                                     8
Name: Company Name, dtype: int64
Tata Consultancy Services, Amazon, Accenture, etc., are the companies that appeared the most in the data.
Now, let us analyze the data.
Salary Counts
First, we start with the distribution of salary.
plt.figure(figsize=(15, 6))
plt.hist(x=df["Salary($)USD /Year"], bins=2000)
plt.xlim(0,200000)
Output:
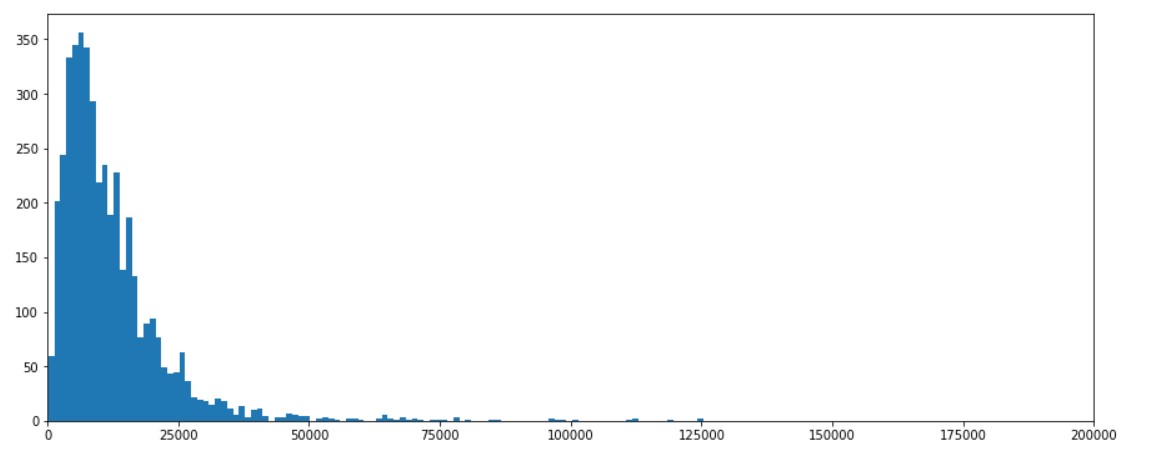
We can see that most salaries are in the range of 10k to 15k USD per annum.
Positions by Mean Salary
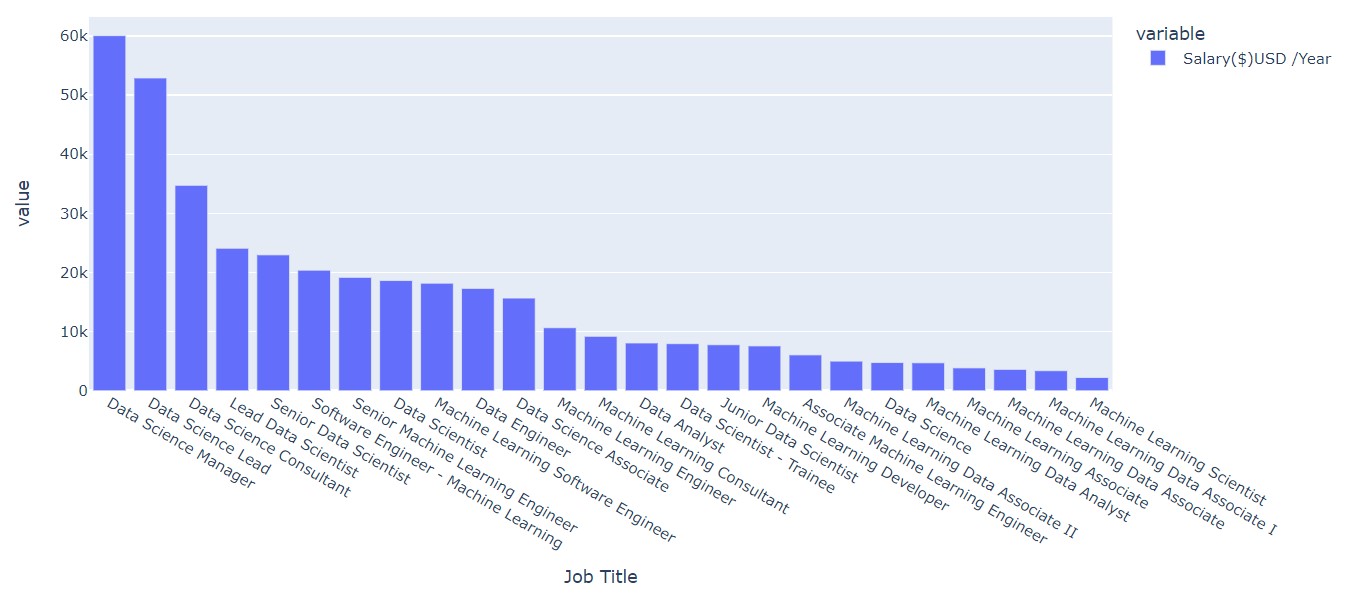
Now, let us see the mean salaries for a particular position.
data = df.groupby('Job Title')['Salary($)USD /Year'].mean().sort_values(ascending=False)
fig = px.bar(data)
fig.show()
Output:
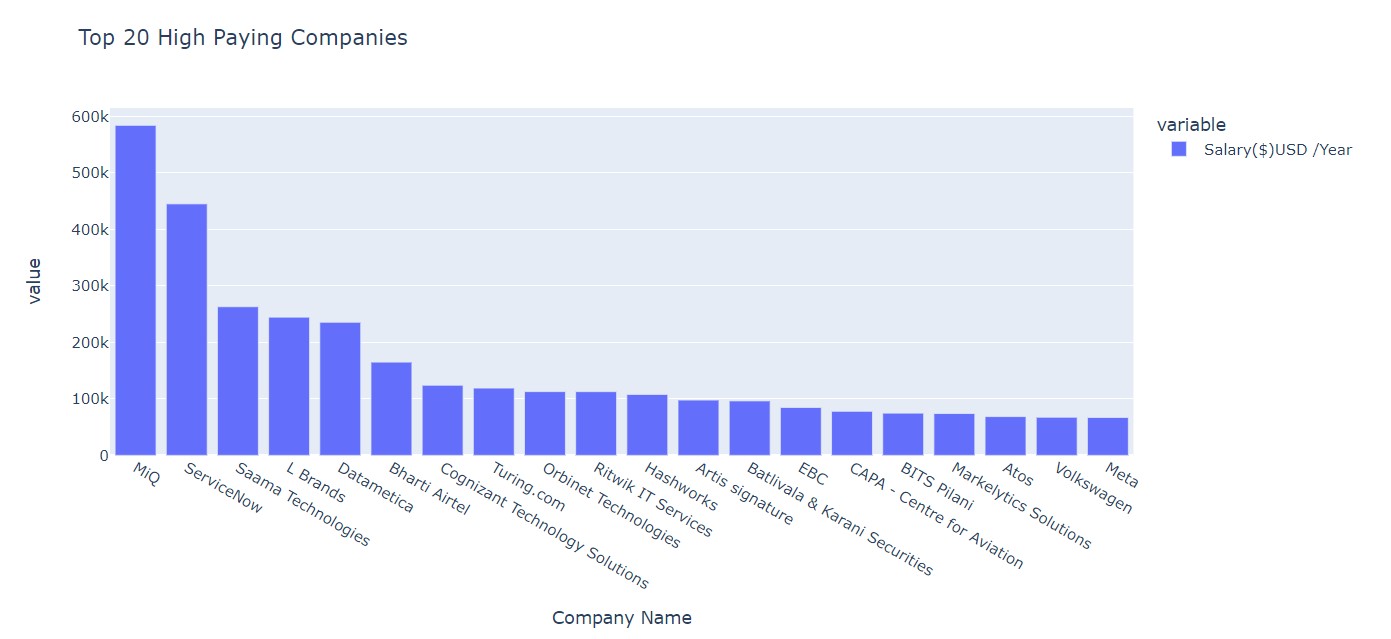
Top 20 Highest Paying Companies
Here, we check the companies giving out the highest pay.
x = df.groupby('Company Name').mean()['Salary($)USD /Year'].sort_values(ascending=False).head(20)
fig = px.bar(x, title="Top 20 High Paying Companies")
fig.update_traces(textfont_size=12, textangle=0, textposition="outside", cliponaxis=False)
fig.show()
Output:
Average Salary by Location
avg_sal_loc = df.groupby("Location")['Salary($)USD /Year'].agg('mean').reset_index()
fig = px.bar(avg_sal_loc, x="Location", y="Salary($)USD /Year", color='Location', title="Average Salary by Location")
fig.update_traces(textfont_size=10, textangle=45, textposition="outside", cliponaxis=False)
fig.show()
Output:
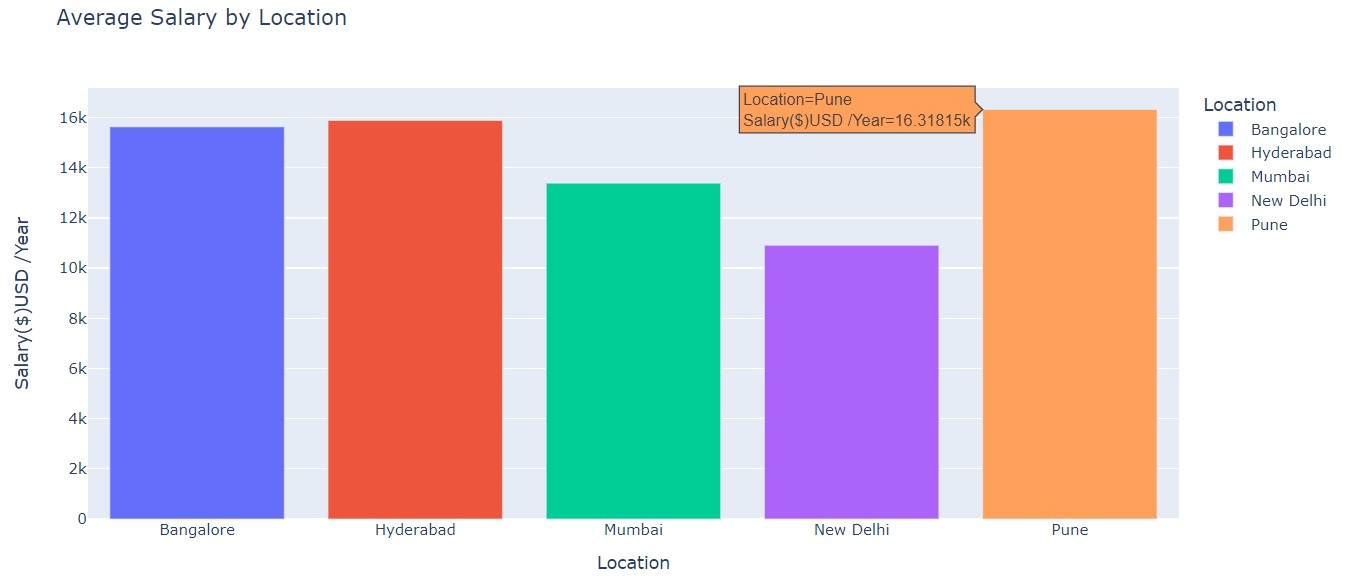
Salaries in Mumbai and New Delhi are lower than those in other cities.
Number of Jobs by Location
sns.set_style('whitegrid')
px.histogram(x=df["Location"])
Output:
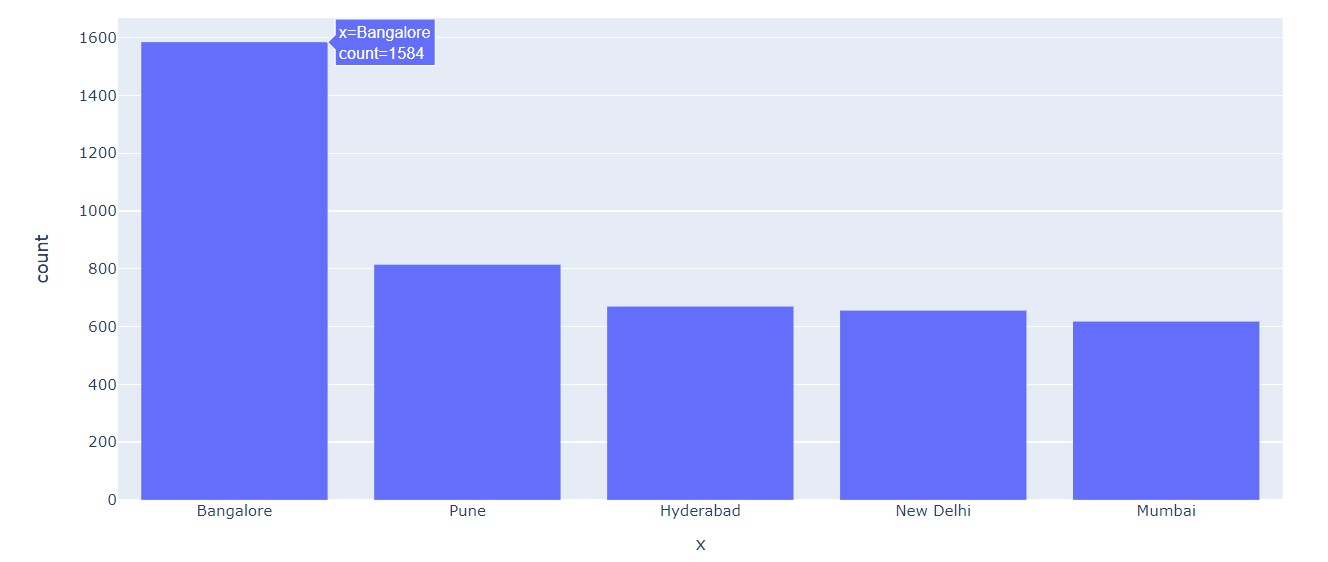
The maximum number of the jobs listed here are from Bangalore.
Field of Work
Now, we shall group the job descriptions into fields of work.
df['Field'] = 'Data'
wData =  df['Job Title'].str.contains("Data")
wScience = df['Job Title'].str.contains("Science")
wScientist = df['Job Title'].str.contains("Scientist")
wMachine = df['Job Title'].str.contains("Machine")
wLearning = df['Job Title'].str.contains("Learning")
wEngineer = df['Job Title'].str.contains("Engineer")
wEngineering = df['Job Title'].str.contains("Engineering")
wAnalyst = df['Job Title'].str.contains("Analyst")
df['Field'].loc[wData & (wScience | wScientist) & ~wMachine] = 'Data Science'
df['Field'].loc[wData & (wEngineer | wEngineering)] = 'Data Engineering'
df['Field'].loc[wMachine & wLearning & ~(wData & wScientist)] = 'Machine Learning'
df['Field'].loc[wData & wAnalyst & ~(wMachine | wScientist)] = 'Data Analysis'
Now, we check what the data looks like.
df.head()
Output:
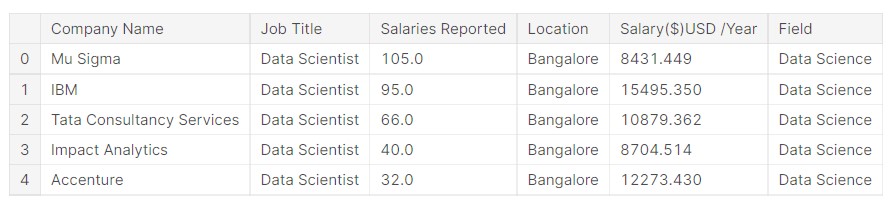
Now, we can see that the field of work has been incorporated into the data.
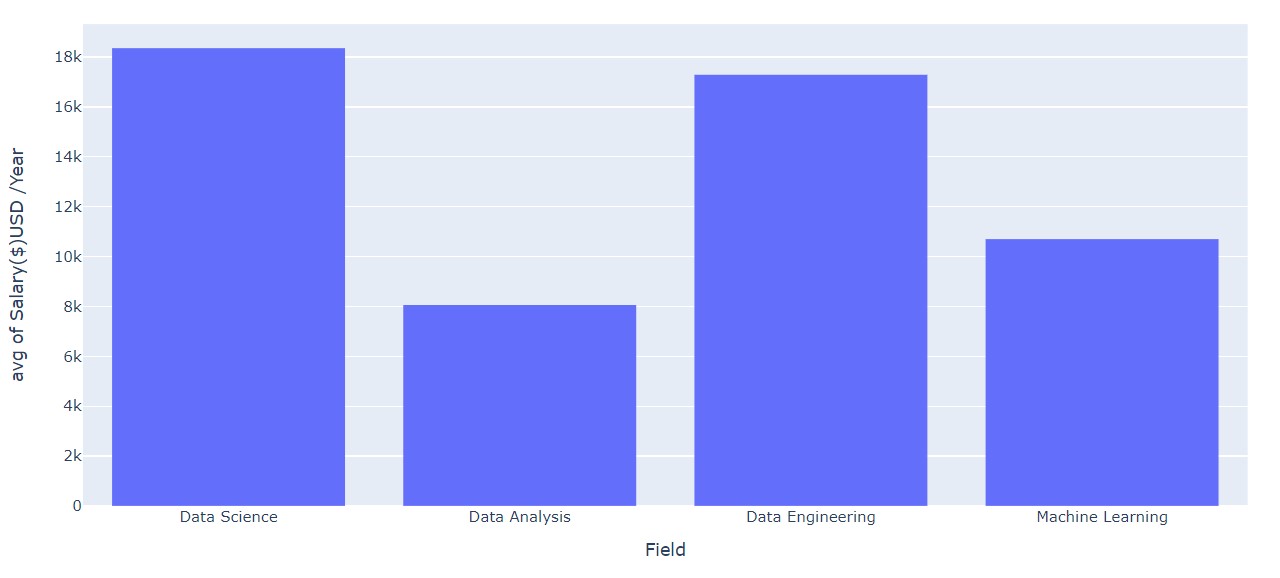
Field of work Average Pay
px.histogram(data_frame=df,x='Field',y='Salary($)USD /Year',histfunc='avg',barmode='group')
Output:
Field of work Average Pay (By city)
px.histogram(data_frame=df,x='Field',y='Salary($)USD /Year',histfunc='avg',color='Location',barmode='group')
Output:
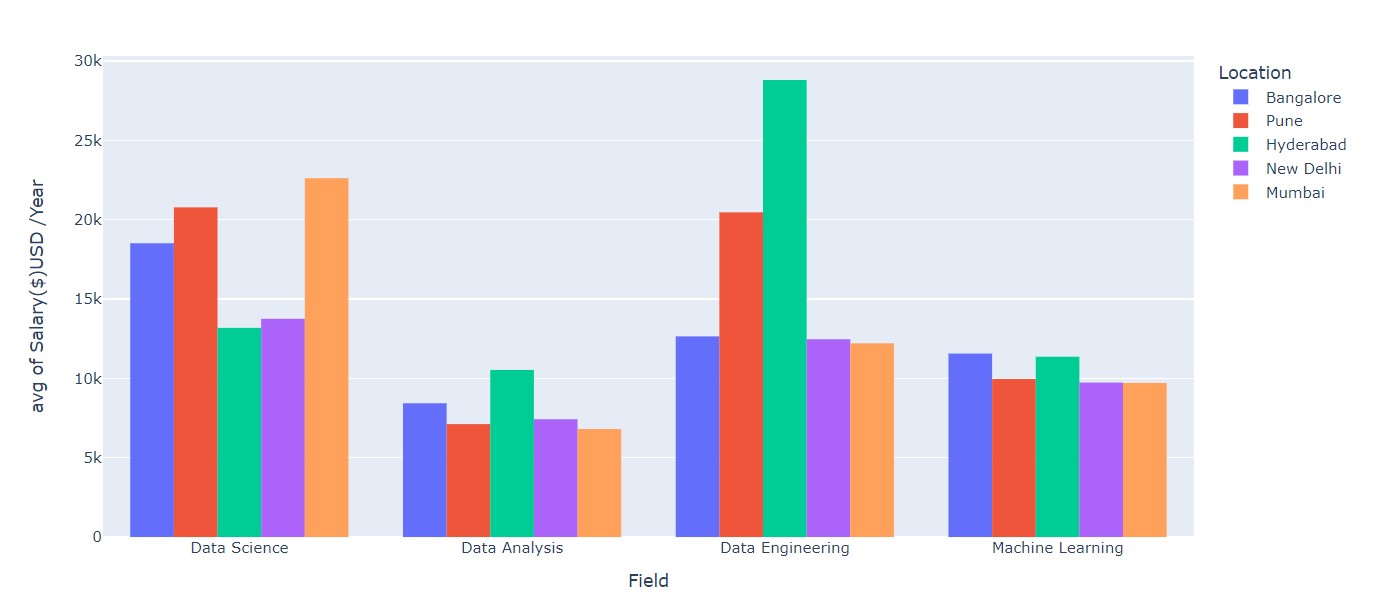
Data Science and Data Engineering fetch more salary than the other fields.
Let us try to understand the roles. A data professional is supposed to be an expert in statistics, machine learning, and, in certain cases, economics. They must have a deep understanding of the data’s commercial uses.
Data Scientist
A Data Scientist uses advanced data techniques to derive business insights, such as clustering, neural networks, decision trees, and so on. They will be the most senior member of a team in this position, and they should have extensive knowledge in machine learning, statistics, and data management. After receiving feedback from Data Analysts and Data Engineers, they will be responsible for creating actionable business insights. A Data Scientist combines the skills of a Data Analyst and a Data Engineer into one person. However, in the case of a Data Scientist, the skill sets must be more in-depth and comprehensive.
They concentrate on developing and deploying AI-based algorithms to tackle business challenges in a variety of areas. To discover trends and patterns in enormous volumes of data, some data scientists concentrate on data visualization and dashboarding technologies. The Data Scientist serves as a link between the examined data and the final projections.
Data Analyst
A Data Analyst is an entry-level position on a data analytics team. They must be skilled at converting numerical data into a format that everyone in a company can understand. A Data Analyst must be proficient in a variety of areas, including programming languages like Python, tools like Excel, and the principles of data management, reporting, and modeling.
A Data Analyst is someone who has the expertise and abilities to transform raw data into information and insight that can be utilized to make business choices. An effective data analyst must have both technical and business skills. A background in Mathematics, Statistics, Computer Science, Information Management, Engineering, or Economics can provide a good basis for a job as a data analyst.
Data Engineer
A Data Engineer creates the framework and structure for a company’s data analytics pipeline. These pipelines play a critical function in the company because they transform raw data into structures that data scientists can work with. Data engineers also ensure that data flows smoothly from servers to apps, and they frequently cooperate with the company’s data scientists. They provide new data analysis tools for business analysts and are also responsible for ensuring that the data security regulations should be followed.
They build, test, and manage data-storage architecture, such as databases and large-scale data processing systems. A big data engineer constructs continuous pipelines that flow to and from vast pools of filtered information from which data scientists may draw relevant data sets for their analysis, much like a physical structure.
When a database fails, it throws the entire IT system to a standstill. A data engineer’s skills are especially valuable when it comes to managing large-scale processing systems with ongoing performance and scalability challenges.
Data engineers can also assist the data science team by creating dataset methods to aid data mining, modeling, and production. In this sense, their involvement is critical in improving data quality.
Machine Learning Engineer
Machine Learning Engineers are highly skilled programmers that do research, develop, and construct self-running software in order to automate predictive models. A machine learning (ML) engineer creates artificial intelligence (AI) systems that use large data sets to produce and construct algorithms capable of learning and generating predictions.
Engineers that specialize in machine learning teach software and systems how to learn on their own, without the need for human interaction.
A bachelor’s or master’s degree in computer science, engineering, mathematics, statistics, or a related discipline is required for most machine learning engineering employment. However, whether or not a person is hired for a machine learning engineering position is mostly determined by whether or not they have the necessary expertise, experience, and project portfolio to demonstrate that they can execute the job.
Conclusion
There are a wide variety of data jobs. All of these positions have a great deal of overlap. Some are more concerned with pure number-crunching, while others are more concerned with applying data analysis findings to business decisions. If someone works in the field of data science, they will be required to participate in a variety of processes along the data-driven product development cycle, regardless of their particular job title.
The field of data science is new and not well-defined. Within the umbrella of data science, people encounter job descriptions under several job titles that seem eerily similar. Companies very often, recognize they have data or have the ability to obtain data, which they may then utilize to better their business strategy.
A data engineer at one firm may do the same tasks as a data analyst at another. All of these jobs entail gathering or validating data, performing some type of analysis, and then communicating the findings to non-technical coworkers with the help of reports, projections, or visualizations.
Hope you liked my article on Data Professionals India Salaries?
Read the latest articles on our website.
The media shown in this article is not owned by Analytics Vidhya and are used at the Author’s discretion.
Prateek Majumder
27 Mar, 2022
Prateek is a final year engineering student from Institute of Engineering and Management, Kolkata. He likes to code, study about analytics and Data Science and watch Science Fiction movies. His favourite Sci-Fi franchise is Star Wars. He is also an active Kaggler and part of many student communities in College.


