Flat vs Hierarchical clustering: Book Recommendation System
This article was published as a part of the Data Science Blogathon.
Overview
- Clustering is an unsupervised machine learning algorithm that basically groups similar things together.
- Recommendation Engines is a fundamental application of clustering.
- We will build a Collaborative filtering Book recommendation system and compare flat vs hierarchical clustering; which works better?
Introduction
Unsupervised Machine learning algorithm has always fascinated me with their power and different fields of applications. Clustering, the most famous Unsupervised Machine learning algorithm, has seen some recent developments. With the recent development of HDBSCAN (Hierarchical Density-based spatial clustering with the application of noise), I always wondered why there was a need to develop a hierarchical and density-based algorithm, what are advantages of hierarchical over flat and vice-versa, and which works better for our machine learning projects like Recommendation systems.
So here is the python implementation of a Book Recommendation system comparing the two Flat and hierarchical clustering algorithms.
What is Clustering?
Clustering is an unsupervised machine learning technique that finds similarities between data points and groups them into clusters. It is used to draw references and determine the underlying structure within the data. There are various clustering algorithms available, and they are mainly divided into two groups:
- Centroid-based / parametric
- Density-based
Centroid based algorithm identifies clusters by their respective centres(centroid). They make implicit and explicit assumptions about the shape of the cluster. Generally, the centroid based algorithms assume clusters to be a multi-dimensional spheres. These algorithms work well with small amounts of data.
Density-based algorithms determine clusters where there is a high density of data points. Unlike centroid-based methods, these do not assign every point to a cluster; instead, points in the less dense regions are grouped as noise.
Furthermore, these algorithms are divided as:
-
Flat
Flat clustering gives you a single grouping or partitioning of data. These require you to have a prior understanding of the clusters as we have to set the resolution parameter. Examples of flat clustering algorithms are K-means(resolution parameter k), DBSCAN(resolution parameter eps)
-
Hierarchical
Hierarchical clustering gives you a sort of nested relationship between the data. It doesn’t require you to have prior knowledge of the cluster as it creates a kind of natural hierarchy over the clusters. These algorithms assume each point as a cluster to group every point in a single cluster. A dendrogram generally represents this hierarchy.
There are two approaches to building such a hierarchy,
- Agglomerative (Bottom-Up)
- Divisive (Top-Down)
Applications of Clustering
Clustering is used in varied fields of applications. Following are some common application platforms that can be used to implement clustering:
- Customer and market segmentation
- Social Network Analysis
- Recommendation Systems
Here we will build a book recommendation engine and compare k-means(Flat) and Agglomerative Clustering(Hierarchical) clustering for the application.
Book Recommendation System
We will build a collaborative filtering recommendation system where we will cluster users based on similarities in book likings. Step-wise implementation is given below.
Importing required libraries
import pandas as pd
import numpy as np
from IPython.display import Image,display
from IPython.core.display import HTML
from sklearn.cluster import KMeans
from sklearn.decomposition import PCA
from sklearn.metrics import silhouette_score ,silhouette_samples
import matplotlib.pyplot as plt
import seaborn as sns
import matplotlib.cm as cm
from mpl_toolkits.mplot3d import Axes3D
from sklearn.preprocessing import StandardScaler
from scipy.cluster.hierarchy import linkage, dendrogram, cut_tree
The data
We have three data frames containing information related to Books, Users, and ratings.
Books = pd.read_csv('Books.csv',low_memory=False)
Books.head()

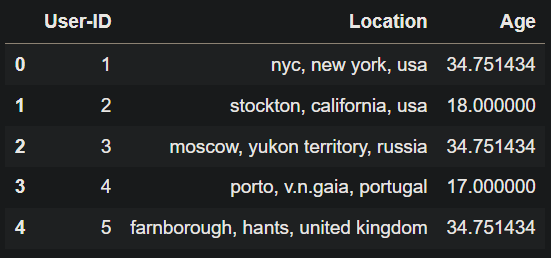
Users = pd.read_csv('Users.csv',low_memory=False)
Users.head()
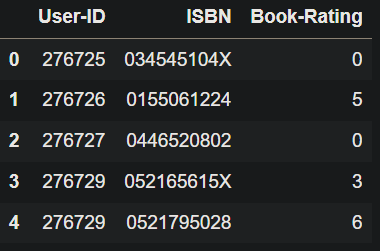
Ratings = pd.read_csv('Ratings.csv')
Ratings.head()
Cleaning the data
On checking some features
Books['Year-Of-Publication'].describe()
count    271357.000000
mean       1959.760817
std         257.994226
min           0.000000
25%        1989.000000
50%        1995.000000
75%        2000.000000
max        2050.000000
Name: Year-Of-Publication, dtype: float64
The min values suggest we have some invalid values for the year of publication. Hence we have to trim some values.
Books = Books[(Books['Year-Of-Publication']>=1950) & (Books['Year-Of-Publication']<=2016)]
Similarly
Users.Age.describe()
count    278858.000000
mean         34.751434
std          11.202003
min           0.000000
25%          29.000000
50%          34.751434
75%          35.000000
max         244.000000
Name: Age, dtype: float64
We can see some invalid numbers there hence we will again trim it off.
Users = Users[(Users.Age>=15) & (Users.Age<=100)]
Now keeping only the books that are common in all the data frames
print("shape before cleaning:",Ratings.shape)
Ratings = Ratings[Ratings['ISBN'].isin(list(Books['ISBN'].unique()))]
Ratings = Ratings[Ratings['User-ID'].isin(list(Users['User-ID'].unique()))]
print("shape after cleaning:",Ratings.shape)
shape before cleaning: (1149780, 3)
shape after cleaning: (1003113, 3)
Preparing the data
We have to define whether a person likes or dislikes the book for our filtering. Criteria for that will be: If a person rates a book more than their average rating, they like the book. We are doing so because clustering users based on ratings can be problematic as we can’t expect users to maintain scale uniformity.
# Taking the mean of rating given by each user
User_rating_mean = Ratings.groupby('User-ID')['Book-Rating'].mean()
user_rating = Ratings.set_index('User-ID')
user_rating['mean_rating'] = User_rating_mean
user_rating.reset_index(inplace=True)
# Keeping the books in which users "likes" the book
user_rating = user_rating[user_rating['Book-Rating'] > user_rating['mean_rating']]
# Initializing a dummy variable for future use
user_rating['is_fav'] = 1
print(user_rating.shape)
user_rating.head()
Now creating a crosstab so that each users ends up as a row and the books as columns
df = pd.pivot_table(user_rating,index='User-ID',columns='ISBN',values='is_fav')
df.fillna(value=0,inplace=True)
df.head(10)
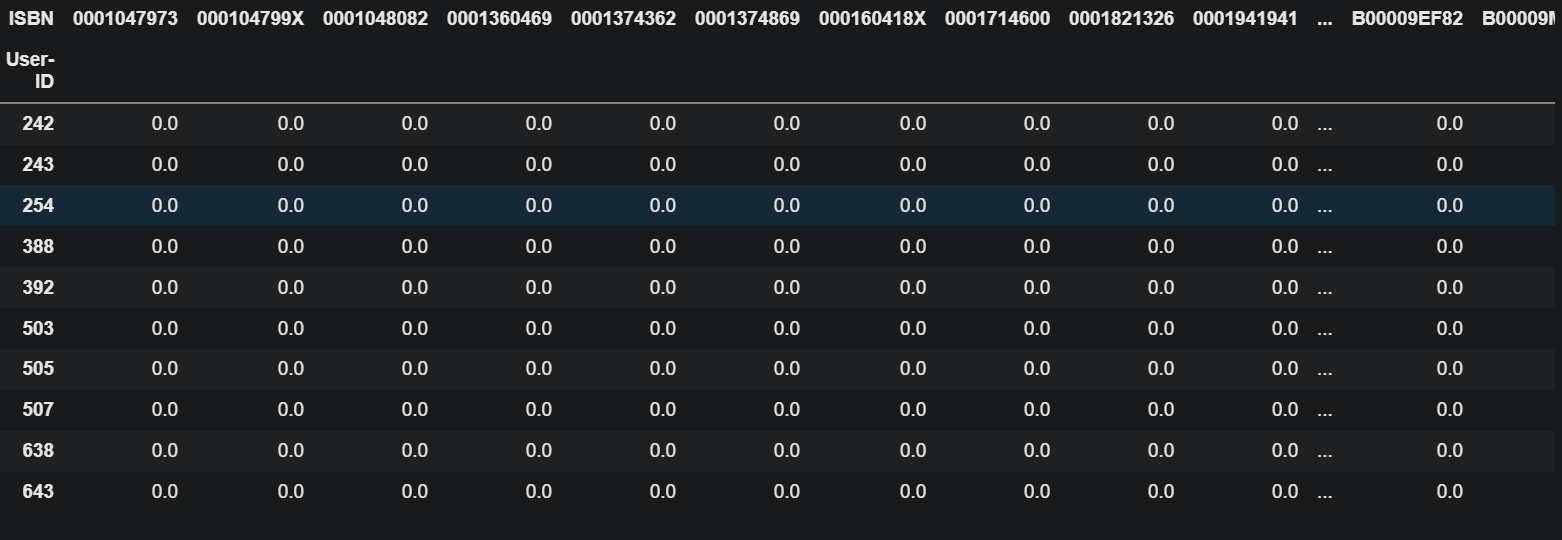
This is how our data looks right now.
We will use PCA for dimensionality reduction as the data shape is impractical to use right now.
pca = PCA(n_components=3)
pca.fit(df)
pca_fit = pca.transform(df)
pca_fit = pd.DataFrame(pca_fit,index=df.index)
Applying the algorithm
Finding the Right k
We will use the elbow method to find the right k(no. of clusters). For that, we will make a line graph of k vs the Total sum of squared errors from the respective centres, and the point at we see an elbow forming is chosen as the optimal value of k.
TSS = []
for i in range(2,26):
    km = KMeans(n_clusters=i,random_state=0)
    km.fit(pca_fit)
    TSS.append(km.inertia_)
plt.plot(range(2,26),TSS,'-')
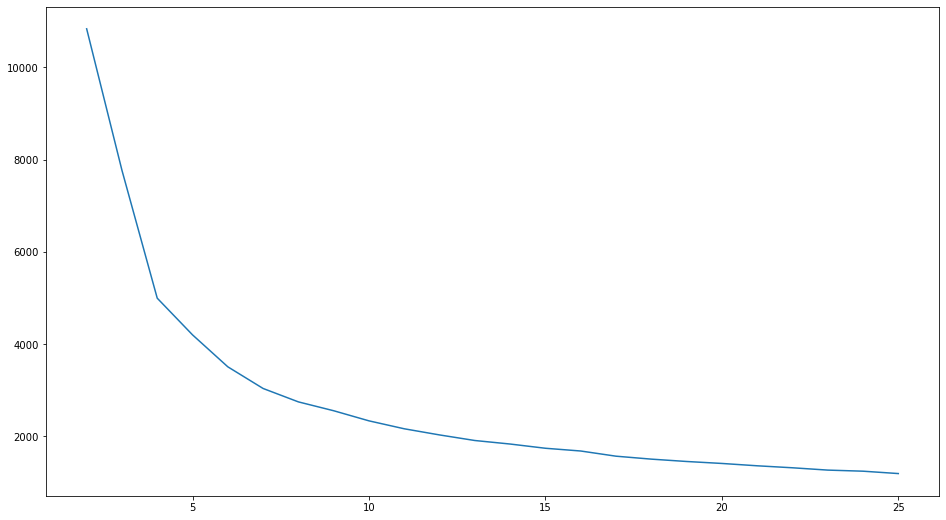
As we can’t see a clear elbow, we have to use silhouette analysis to find the right k. Silhouette score is a metric for validation of the clustering. We will calculate the silhouette score for each trial of k.
for n in [3,4,5,6,7,8]:
    km = KMeans(n_clusters=n,random_state=0)
    clusters = km.fit_predict(pca_fit)
    silhouette_avg = silhouette_score(pca_fit, clusters)
    print("For n_clusters =", n,
          "The average silhouette_score is :", silhouette_avg)
    silhouette_values = silhouette_samples(pca_fit, clusters)
For n_clusters = 3 The average silhouette_score is : 0.6995278360574746
For n_clusters = 4 The average silhouette_score is : 0.702669359125888
For n_clusters = 5 The average silhouette_score is : 0.5944974925329153
For n_clusters = 6 The average silhouette_score is : 0.6160073620527732
For n_clusters = 7 The average silhouette_score is : 0.5394956965235688
For n_clusters = 8 The average silhouette_score is : 0.5295789525646848
Clearly, k=4 gives the best clustering.
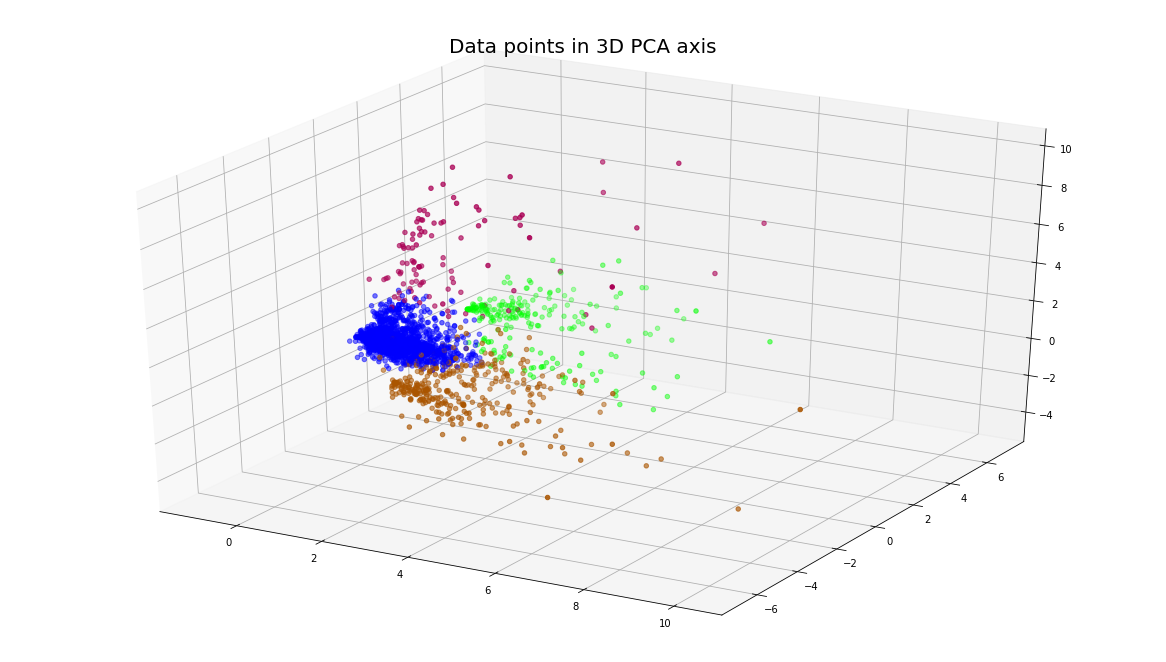
Hence at k=4, we will get such clustering
Kmeans_final = KMeans(n_clusters=4,random_state=0).fit(pca_fit)
df['cluster'] = Kmeans_final.labels_
fig = plt.figure()
ax = Axes3D(fig)
ax.scatter(pca_fit[0], pca_fit[2], pca_fit[1],c=df['cluster'],cmap=cmhot)
plt.title('Data points in 3D PCA axis', fontsize=20)
plt.show()

-
Agglomerative Clustering
Building the hierarchy
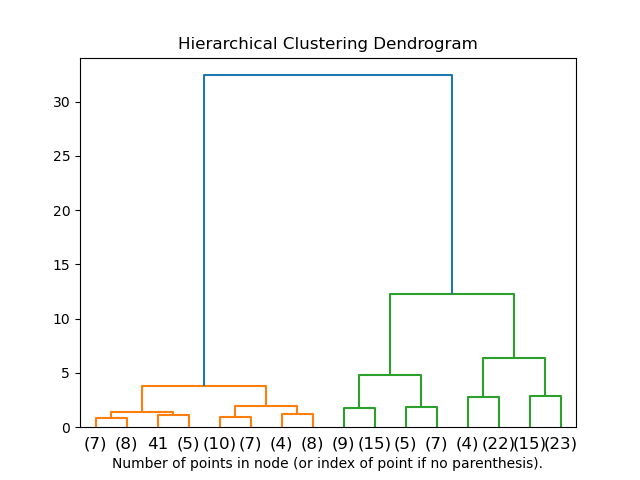
We will build the hierarchy and represent it using a dendrogram.
mergings = linkage(pca_fit,method='ward')
dendrogram(mergings)
plt.show()
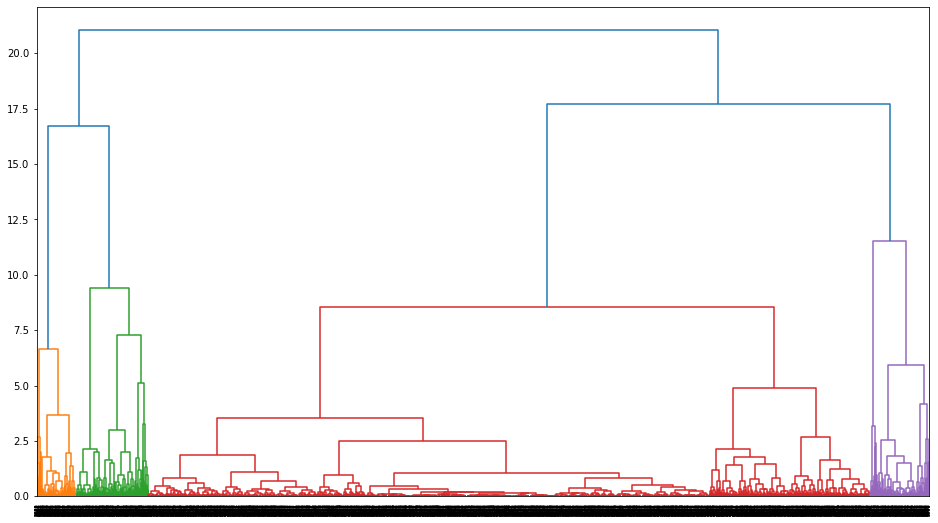
The dendrogram suggests no. of clusters = 4 will give the best clustering hence we will cut the hierarchy tree where no. of clusters = 4 and check out the silhouette score for clustering.
labels = cut_tree(mergings,n_clusters=4)
d = df.copy()
d['cluster'] = Kmeans_final.labels_
silhouette_avg = silhouette_score(pca_fit, labels)
print("For n_clusters =", 4,
          "The average silhouette_score is :", silhouette_avg)
fig = plt.figure()
ax = Axes3D(fig)
ax.scatter(pca_fit[0], pca_fit[2], pca_fit[1],c=df['cluster'],cmap=cmhot)
plt.title('Data points in 3D PCA axis', fontsize=20)
plt.show()
For n_clusters = 4 The average silhouette_score is : 0.6643949568160475
Conclusion
K-means provide a better result here. We had around 5000 data points(users) in the cluster. Hence hierarchical clustering not only can become computationally expensive but does not necessarily provide better results. Also, for 1000 or more data points, the dendrogram becomes complex and hard to interpret. Though in K-means, we have to set the resolution parameter; once we get the right k, we can achieve the right clustering we need.
The media shown in this article is not owned by Analytics Vidhya and is used at the Author’s discretion.


