IPL Team Win Prediction Project Using Machine Learning
This article was published as a part of the Data Science Blogathon.
Introduction
Machine Learning and Data Science are one of the fastest-growing technological fields. This field results in amazing changes in the medical field, production, robotics etc. The main reason for the advancement in this field is the increase in the computational power and availability of large amounts of data. In Data Science, this data is analyzed and made suitable for creating machine learning models and products.
In today’s article, we are going to discuss the IPL team win prediction. Based on some match stats, we’re predicting who is the winner of an IPL match. Through this project, you will get familiar with the exploratory data analysis and feature engineering techniques that need to be applied to process data.
So let’s go to the dataset.
Dataset
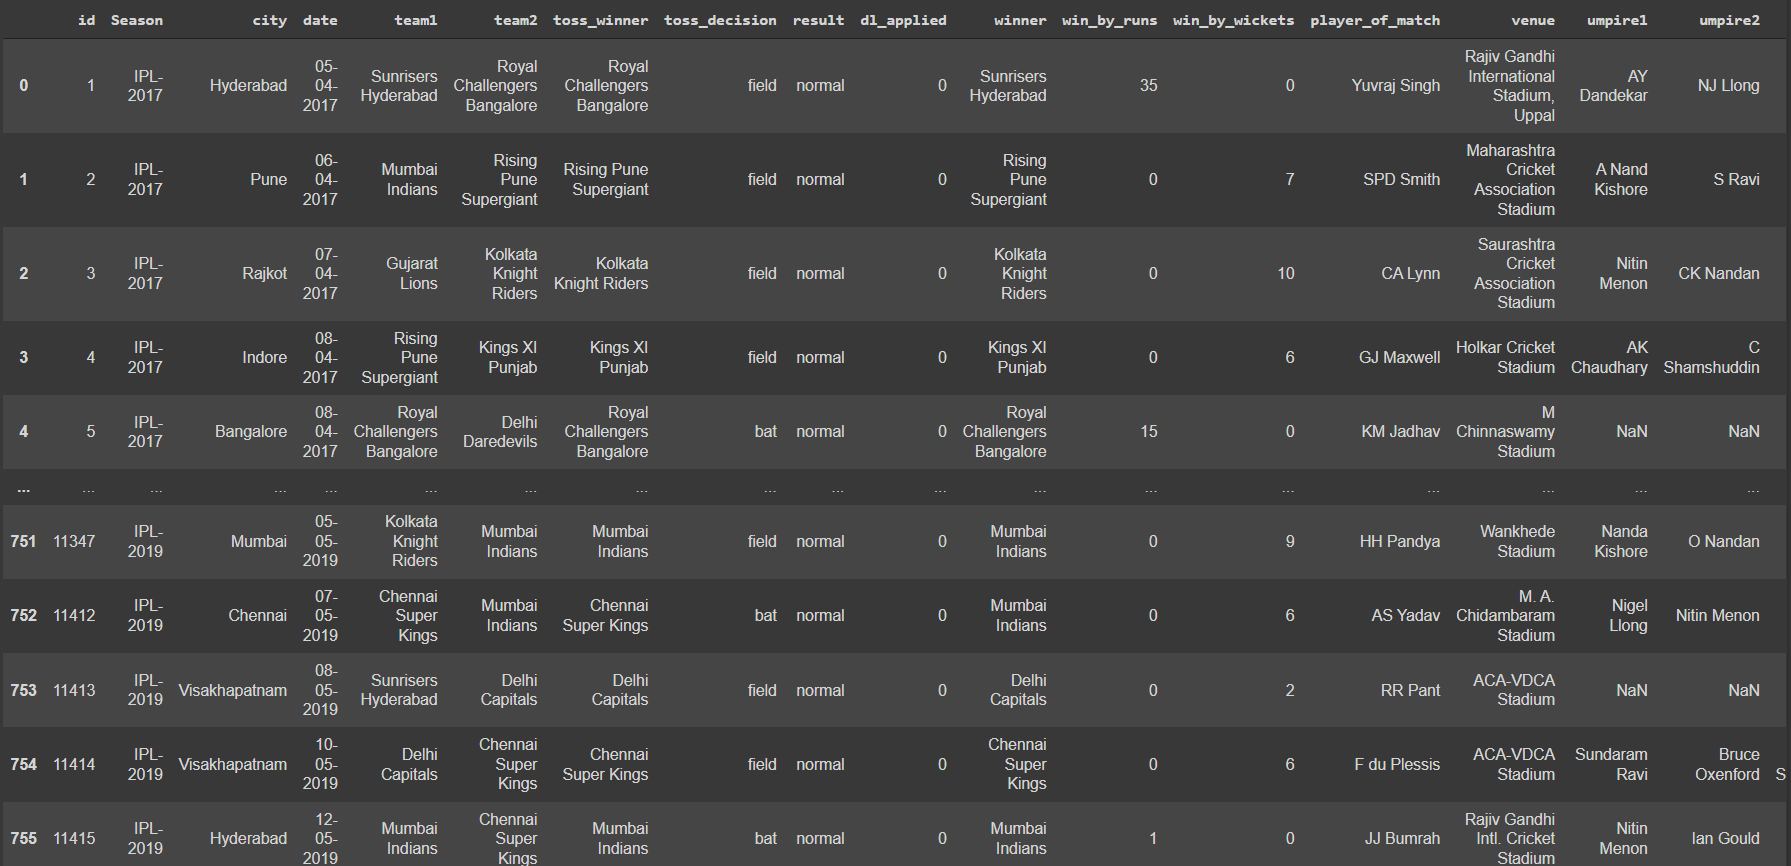
The data set we are using here is the IPL dataset, which contains the details regarding the winner and match stats. It contains the details like teams played, winner, venue of the match, won by how many wickets and runs, toss decision, whether DLS applied or not, names of the umpires etc. Performing exploratory data analysis and data engineering on this data is very important.
Implementation
So let’s start the implementation of the IPL team win predictor model.
As usual, the first step is importing all the required libraries.
import pandas as pd
import numpy as np
import seaborn as sns
sns.set_style("whitegrid")
import matplotlib.pyplot as plt
import sklearn
So let’s import the dataset. We’ve already discussed the dataset.
data = pd.read_csv("matches.csv")
Analyzing the first 5 rows of the dataset
data.head()
.png)
Let’s get a brief summary of the IPL dataset.
data.describe()
.png)
Checking whether there are any null values present in the dataset.
data.isnull().sum()
id 0 Season 0 city 7 date 0 team1 0 team2 0 toss_winner 0 toss_decision 0 result 0 dl_applied 0 winner 4 win_by_runs 0 win_by_wickets 0 player_of_match 4 venue 0 umpire1 2 umpire2 2 umpire3 637
As you can see, the values of umpire3 are null in almost all rows, so we are dropping the column umpire3. And also dropped some rows containing the null values after removing the umpire3 column.
data = data.iloc[:,:-1]
data.dropna(inplace=True)
Now let’s look into the total teams listed in this dataset.
data["team1"].unique()
Output
array(['Sunrisers Hyderabad', 'Mumbai Indians', 'Gujarat Lions',
       'Rising Pune Supergiant', 'Royal Challengers Bangalore',
       'Kolkata Knight Riders', 'Delhi Capitals', 'Kings XI Punjab',
       'Chennai Super Kings', 'Rajasthan Royals', 'Kochi Tuskers Kerala',
       'Pune Warriors', 'Rising Pune Supergiants'], dtype=object)
Here you can see the name Delhi Daredevils and Delhi Capitals; Delhi Daredevils is the old name of the Delhi Capitals. Similarly, Decan Chargers is the old name of Sunrisers Hyderabad. So we are changing the old name to the newer one.
#for Delhi Capitals
data['team1']=data['team1'].str.replace('Delhi Daredevils','Delhi Capitals')
data['team2']=data['team2'].str.replace('Delhi Daredevils','Delhi Capitals')
data['winner']=data['winner'].str.replace('Delhi Daredevils','Delhi Capitals')
#for sunrisers Hyderabad
data['team1']=data['team1'].str.replace('Deccan Chargers','Sunrisers Hyderabad')
data['team2']=data['team2'].str.replace('Deccan Chargers','Sunrisers Hyderabad')
data['winner']=data['winner'].str.replace('Deccan Chargers','Sunrisers Hyderabad')
Visualizations
Number of IPL matches won by each team.
plt.figure(figsize = (10,6))
sns.countplot(y = 'winner',data = data,order= data['winner'].value_counts().index)
plt.xlabel('Wins')
plt.ylabel('Team')
plt.title('Number of  IPL  matches won by each team')
.png)
Total number of matches played in a different stadium
plt.figure(figsize = (10,6))
sns.countplot(y = 'venue',data = data,order = data['venue'].value_counts().iloc[:10].index)
plt.xlabel('No of matches',fontsize=12)
plt.ylabel('Venue',fontsize=12)
plt.title('Total Number of matches played in different stadium')
.png)
The decision was taken by the toss winning team.
plt.figure(figsize = (10,6))
sns.countplot(x = "toss_decision", data=data)
plt.xlabel('Toss Decision',fontsize=12)
plt.ylabel('Count',fontsize=12)
plt.title('Toss Decision')
.png)
Now let’s check the unique values presented in each feature.
x = ["city", "toss_decision", "result", "dl_applied"]
for i in x:
  print("------------")
  print(data[i].unique())
  print(data[i].value_counts())
Output
------------
['Hyderabad' 'Pune' 'Rajkot' 'Indore' 'Mumbai' 'Kolkata' 'Bangalore'
 'Delhi' 'Chandigarh' 'Kanpur' 'Jaipur' 'Chennai' 'Cape Town'
 'Port Elizabeth' 'Durban' 'Centurion' 'East London' 'Johannesburg'
 'Kimberley' 'Bloemfontein' 'Ahmedabad' 'Cuttack' 'Nagpur' 'Dharamsala'
 'Kochi' 'Visakhapatnam' 'Raipur' 'Ranchi' 'Abu Dhabi' 'Sharjah' 'Mohali'
 'Bengaluru']
Mumbai            101
Kolkata            77
Delhi              73
Hyderabad          64
Bangalore          63
Chennai            57
Jaipur             47
Chandigarh         46
Pune               38
Durban             15
Bengaluru          13
Centurion          12
Ahmedabad          12
Visakhapatnam      12
Rajkot             10
Mohali             10
Indore              9
Dharamsala          9
Johannesburg        8
Cuttack             7
Ranchi              7
Port Elizabeth      7
Cape Town           7
Abu Dhabi           7
Sharjah             6
Raipur              6
Kochi               5
Kanpur              4
Nagpur              3
Kimberley           3
East London         3
Bloemfontein        2
Name: city, dtype: int64
------------
['field' 'bat']
field    455
bat      288
Name: toss_decision, dtype: int64
------------
['normal' 'tie']
normal    734
tie         9
Name: result, dtype: int64
------------
[0 1]
0    724
1     19
Name: dl_applied, dtype: int64
We don’t need all the features or columns in order to create the model. It will reduce model accuracy, so we are dropping some of the features that don’t affect our result.
data.drop(["id", "Season","city","date", "player_of_match", 'umpire1', "venue", "umpire2"], axis=1, inplace=True)
Our data looks like this.
.png)
We can convert our data into dependent and independent.
X = data.drop(["winner"], axis=1)
y = data["winner"]
Several categorical values are present in the input data, so we are converting them into numerical values using the pandas, get_dummies method.
X = pd.get_dummies(X, ["team1","team2", "toss_winner", "toss_decision", "result"], drop_first = True)
The output data is also a categorical value, so we are converting it into numerical using LabelEncoder of sklearn.
from sklearn.preprocessing import LabelEncoder
le = LabelEncoder()
y = le.fit_transform(y)
Now let’s convert our data into a training set in order to create the model and test set for evaluating the created model.
from sklearn.model_selection import train_test_split
x_train, x_test, y_train, y_test = train_test_split(X, y, train_size = 0.8)
Model Creation and Evaluation
The next and most important step in the model creation step. So we are using Random Forest Classification, Logistic Regression and Decision Tree Classification for this.
from sklearn.ensemble import RandomForestClassifier
model = RandomForestClassifier(n_estimators=200,min_samples_split=3,
                               max_features = "auto")
Training the random forest classifier model
model.fit(x_train, y_train)
Predicting the model with x_test values and saving it as y_pred
y_pred = model.predict(x_test)
Using the accuracy score of sklearn, we are evaluating the predicted result and accuracy of the model
from sklearn.metrics import accuracy_score
ac = accuracy_score(y_pred, y_test)
#output - 0.92
The accuracy of the test set is about 92% which is good. It’s all about the prediction and Evaluation
Frequently Asked Questions
A. IPL win prediction machine learning is a data-driven approach that utilizes machine learning algorithms to forecast the outcome of Indian Premier League (IPL) cricket matches. By analyzing historical data such as team performance, player statistics, venue conditions, and various other factors, the machine learning model can identify patterns and trends that influence match results. The model then applies these insights to predict the probability of a team winning a future IPL match. This application of machine learning helps cricket enthusiasts and stakeholders make informed decisions and gain insights into the potential outcome of IPL matches.
A. IPL prediction works by employing machine learning algorithms to analyze various data points related to cricket matches. These data points typically include team performance, player statistics, pitch conditions, weather conditions, past match results, and head-to-head records. The machine learning model is trained on historical data to identify patterns and relationships between these variables and match outcomes. Once the model is trained, it can make predictions for future IPL matches by inputting the relevant data. The model then calculates the probabilities of each team winning based on the patterns it has learned, providing valuable insights for match outcome predictions.
Conclusion
This article shows the implementation of the IPL Win prediction model. You have got an insight into how to analyze a given raw data and convert that into useful features by removing unwanted features, that is, performing exploratory data analysis. So let’s identify the main key points from the article.
- IPL Dataset analysis: This analysis includes checking for null values and replacing them, describing the dataset’s feature columns, and analyzing each feature.
- Visualization of data: Done a graphical representation of the dataset in order to get an understanding of the teams, matches and the toss decision of the IPL Matches
- Performed preprocessing techniques on the IPL Data: Performed several feature engineering techniques in order to make the dataset suitable for making the model. Encoding for converting categorical features to numerical features and techniques to avoid null values are used.
- Model creation and Evaluation: This was the main part of the project, and we used the RandomForestClassifier model. Later we tested this model with the test set for evaluation.
I am hoping that you got an idea regarding the above-mentioned steps. Please make sure that you’re practising and trying to grasp each step. I hope you like my article.
Connect with me on LinkedIn.
The media shown in this article is not owned by Analytics Vidhya and is used at the Author’s discretion.


IPL team win prediction project is a worthy one which is more popular during this season. Your project seems very interesting and thrilling one. Surely I will try this one up to the point I can!
can u please provide the datasets for this problem?