Hypothesis Testing in Inferential Statistics
This article was published as a part of the Data Science Blogathon.
Introduction
Hypothesis testing is one of the most important techniques applied in various fields such as statistics, economics, pharmaceutical, mining and manufacturing industries. Suppose we want to know if something took place if certain medicines are effective, if groups differ from each other or if one variable predicts another variable.

Source: ety.com
All in all, we want to predict if the data collected is statistically significantly different from another. This article is for anyone who wants to know and understand the concept of hypothesis testing, which is a significant component of inferential statistics. The 5 steps taken to conduct the hypothesis testing have been explained in detail.
Alright, let’s begin!
What is Hypothesis Testing?
Hypothesis Testing is an inferential statistical method that is required to use sample data to solve assumptions about a population parameter (a characteristic that describes a population).
Inferential Statistics Definition
I want to define inferential statistics as the main reason we study statistics to make inferences about our population of interest using sample data. Hence, inferential statistics is a branch of statistics that refers to the probability that the sample data can represent the population data from which the sample was obtained. In other words, it’s like saying what can we conclude about the population based on what we know about the sample. For instance, if you wanted to know the average salary of a domestic worker, if covid has less impact on people who take vitamin C if a manufacturer produces the same quantity of 50 litres of milk and many other examples where inferential statistics is applicable.
5 Steps taken to Conduct a Hypothesis Testing
The following is a graphical representation of the steps to conduct hypothesis testing.
.png)
Step 1: Select the appropriate Statistics
The test is chosen based on whether you are looking for relationships or differences between groups and whether the assumptions for a particular test have been satisfied. However, this step involves exploratory data analysis, which helps us choose the test to conduct the hypothesis.
° Looking for Differences between groups. Hypothesis tests that can be used are as follows:
.png)
✓ The independent sample t-test is a parametric procedure or test used to compare two independent samples where the mean from one group has no effect on the mean from the other group.
✓ In other terms, it tests whether or not the sample means are statistically significantly different from each other. For example, measuring women’s weight from one group will not affect the importance of men from another group.
.png)
.png)
✓ The dependent sample t-test is a parametric procedure or test, also referred to as the matched paired sample t-test, related sample t-test and repeated measures t-test.
✓ It is used to compare means between two related samples; in short, it tests whether the average difference between means is different from zero. For instance, before and after experimental designs, matched pairs and pre-test and post-tests experiments use the dependent sample t-test.
.png)
✓ The One-Sample t-test is a parametric procedure or test that allows us to compare a sample mean to a known population mean provided the population standard deviation is unknown and checks if the means are statistically significantly different.
.png)
✓ The Mann-Whitney U test is a non-parametric test that corresponds to the independent sample t-test.
✓ It is categorised under the group of ranked sum tests. It is used to measure two independent samples that have been calculated on an ordinal level and follow a ranked order.
.png)
√ The Wilcoxon signed-rank test is a non-parametric procedure or test that corresponds to the one-sample t-test and can be used to test if the sample median is statistically significantly different from the hypothesised population median value.
.png)
✓ It is a non-parametric procedure or test corresponding to the dependent sample t-test.
✓ It measures whether there is a difference between two related/dependent/matched samples that have been calculated on an ordinal level and follow a ranked order.
.png)
✓ The Friedman test is a non-parametric procedure or test that corresponds to the repeated measures ANOVA.
✓ It is used to measure whether or not there is a statistically significant difference between medians of three groups and the same subjects or scores show up in the same groups or classes.
.png)
✓ It is a non-parametric procedure or test corresponding to the one-way ANOVA.
✓ It is used to measure whether or not there is a statistically significant difference between medians of three independent groups.
.png)
✓ The repeated measures ANOVA is a parametric procedure or test that measures whether or not the means of three or more dependent variables are statistically significantly different from the other.
.png)
✓ The one-way ANOVA is a parametric procedure or test that measures whether or not the means of three independent groups are statistically significantly different from the other.
° Looking for relationships between groups. Hypothesis tests that can be made used are as follows:
.png)
✓ Simple Linear Regression is a parametric procedure or test that uses the general linear model to analyse the relationship between the independent and dependent variables, measured on a scale level or are continuous.
✓ Simple Linear Regression uses the independent variable, which is on the x-axis, to predict a dependent variable on the y-axis. For us, for instance, predict the crime rate from an increase in population.
✓ The relationship between the variables is described mathematically by the equation of a straight line: Y=AX+B,
where Y is the y-intercept and represents a constant value of y when x =0, A represents a constant value of y when x=0, B represents the slope of the straight line. X represents the value used for prediction.
.png)
✓ The Pearson correlation coefficient is a parametric procedure or test that measures the strength of association (relationship) between two quantitative variables.
✓ It ranges from -1 to 1. -1 indicates a perfect positive linear association between the independent and dependent variable; meanwhile, -1 indicates a perfect negative linear association between the independent and dependent variable.
.png)
✓ The Spearman’s Rank Correlation coefficient is a non-parametric procedure or test corresponding to the Pearson correlation coefficient.
✓ It measures the strength, direction and relationship between two ordinal or ordered variables.
✓ It also ranges from a negative one to a positive one.
.png)
✓ The Chi-Square test is a non-parametric procedure or test that can be used to determine if there is a relationship between two qualitative variables.
✓ For example, suppose we want to determine if there is a relationship between gender (male or female) and the highest educational level. We can apply the Chi-Square test.
Step 2: State the Null and Alternative hypothesis
In hypothesis testing, two hypotheses are:
✓Null hypothesis, which states that no difference between means and any differences would have occurred due to chance or randomness, is denoted by Ho.
✓ Alternative hypothesis states that one group mean will be statistically significantly different from the other and is denoted by Ha or H1.
.png)
Research by design
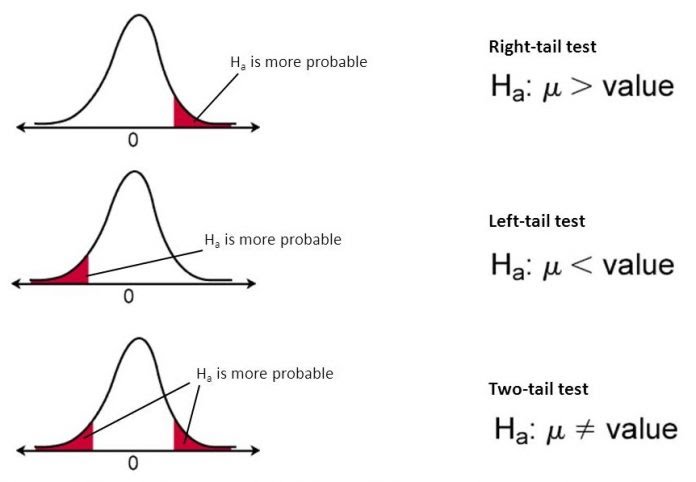
Step 3: Select a Level of Significance
This step requires us to state whether the test is one-tailed or two-tailed. We then select a level of Significance, also known as the alpha level, which will help us in setting a critical value, and the most commonly used alpha level is 0.05
source: statistics made easy
Step 4: Calculate the test statistic
Here, the test statistic is calculated either by hand where the test value is found using a specific formula for a particular test and is compared to the critical value from a student statistics table or using software like R, python, Spss, excel, datatab, etc. here the software calculates the test statistic and then computes a probability value P. If P is less than the alpha level, then the null hypothesis is rejected.
Step 5: Make a decision
Here the decision is based on the following rules
✓ If the calculated test statistic exceeds the critical value, then the test is significant: the null hypothesis is rejected, implying that the test is statistically significantly different.
✓ If the calculated test statistic is less than the critical value, then the test is not Significant: we fail to reject the null hypothesis implying that the test is not statistically significantly different.
.png)
Research by design
Conclusion
In this article, I have discussed the concept of hypothesis testing, a branch of inferential statistics, followed by the definition of inferential statistics. Furthermore, I have explained the 5 steps taken to conduct a hypothesis testing that is :
•Step one: select the appropriate Statistics
•Step two: state the null and alternative hypothesis
•Step three: select a Level of Significance
•Step four: calculate the statistics
•Step five: make a decision
You can reach out to me via email: [email protected]
The media shown in this article is not owned by Analytics Vidhya and is used at the Author’s discretion.


