Introduction
Let’s start with a practical example of using the Naive Bayes Algorithm.
Assume this is a situation you’ve got into in your data science project:
You are working on a classification problem and have generated your set of hypotheses, created features, and discussed the importance of variables. Within an hour, stakeholders want to see the first cut of the model.
What will you do? You have hundreds of thousands of data points and several variables in your training data set. In such a situation, if I were in your place, I would have used ‘Naive Bayes Classifier,‘ which can be extremely fast relative to other classification algorithms. It works on Bayes’ theorem of probability to predict the class of unknown data sets.
In this article, I’ll explain the basics of Naive Bayes Classifier (NB) in machine learning (ML), so that the next time you come across large data sets, you can bring this classification algorithm in ML (which is a part of AI) to action. In addition, if you are a newbie in Python or R, you should not be overwhelmed by the presence of available codes in this article.
Learning Objectives
- Understand the definition and working of the Naive Bayes algorithm.
- Get to know the various applications, pros, and cons of the classifier.
- Learn how to implement the NB Classifier or bayesian classification in R and Python with a sample project.
If you prefer to learn the Naive Bayes’ theorem from the basics concepts to the implementation in a structured manner, you can enroll in this free course: Naive Bayes Course from Scratch.
Table of contents
- What is Naive Bayes Classifier?
- What is the Naive Bayes Algorithm?
- Example of Naive Bayes Algorithm
- Sample Project to Apply Naive Bayes
- How Do Naive Bayes Algorithms Work?
- What Are the Pros and Cons of Naive Bayes?
- Applications of Naive Bayes Algorithms
- How to Build a Basic Model Using Naive Bayes in Python and R ?
- Tips to Improve the Power of the NB Model
- Frequently Asked Questions
What is Naive Bayes Classifier?
Naïve Bayes belongs to a family of generative learning algorithms, aiming to model the distribution of inputs within a specific class or category. Unlike discriminative classifiers such as logistic regression, it doesn’t learn which features are most crucial for distinguishing between classes. It’s widely used in text classification, spam filtering, and recommendation systems.
What is the Naive Bayes Algorithm?
It is a classification technique based on Bayes’ Theorem with an independence assumption among predictors. In simple terms, a Naive Bayes classifier assumes that the presence of a particular feature in a class is unrelated to the presence of any other feature.
The Naïve Bayes classifier is a popular supervised machine learning algorithm used for classification tasks such as text classification. It belongs to the family of generative learning algorithms, which means that it models the distribution of inputs for a given class or category. This approach is based on the assumption that the features of the input data are conditionally independent given the class, allowing the algorithm to make predictions quickly and accurately.
A Brief Review of Bayesian Statistics
In statistics, naive Bayes are simple probabilistic classifiers that apply Bayes’ theorem. This theorem is based on the probability of a hypothesis, given the data and some prior knowledge. The naive Bayes classifier assumes that all features in the input data are independent of each other, which is often not true in real-world scenarios. However, despite this simplifying assumption, the naive Bayes classifier is widely used because of its efficiency and good performance in many real-world applications.
Moreover, it is worth noting that naive Bayes classifiers are among the simplest Bayesian network models, yet they can achieve high accuracy levels when coupled with kernel density estimation. This technique involves using a kernel function to estimate the probability density function of the input data, allowing the classifier to improve its performance in complex scenarios where the data distribution is not well-defined. As a result, the naive Bayes classifier is a powerful tool in machine learning, particularly in text classification, spam filtering, and sentiment analysis, among others.
Example of Naive Bayes Algorithm
For example, if a fruit is red, round, and about 3 inches wide, we might call it an apple. Even if these things are related, each one helps us decide it’s probably an apple. That’s why it’s called ‘Naive.
An NB model is easy to build and particularly useful for very large data sets. Along with simplicity, Naive Bayes is known to outperform even highly sophisticated classification methods.
Bayes theorem provides a way of computing posterior probability P(c|x) from P(c), P(x) and P(x|c). Look at the equation below:
![Bayes' theorem formula [Naive Bayes' Algorithm]](https://av-eks-blogoptimized.s3.amazonaws.com/Bayes_rule-300x172-300x172-111664.png)
Above,
- P(c|x) is the posterior probability of class (c, target) given predictor (x, attributes).
- P(c) is the prior probability of class.
- P(x|c) is the likelihood which is the probability of the predictor given class.
- P(x) is the prior probability of the predictor.
Are you a beginner in Machine Learning? Do you want to master the machine learning algorithms like Naive Bayes? Here is a comprehensive course covering the machine learning and deep learning algorithms in detail – Certified AI & ML Blackbelt+ Program.
Sample Project to Apply Naive Bayes
Problem Statement
HR analytics is revolutionizing the way human resources departments operate, leading to higher efficiency and better results overall. Human resources have been using analytics for years.
However, the collection, processing, and analysis of data have been largely manual, and given the nature of human resources dynamics and HR KPIs, the approach has been constraining HR. Therefore, it is surprising that HR departments woke up to the utility of machine learning so late in the game.
Here is an opportunity to try predictive analytics in identifying the employees most likely to get promoted.
How Do Naive Bayes Algorithms Work?
Time needed: 1 minute
Let’s understand it using an example. Below I have a training data set of weather and corresponding target variable ‘Play’ (suggesting possibilities of playing). Now, we need to classify whether players will play or not based on weather condition. Let’s follow the below steps to perform it.
- Convert the data set into a frequency table
In this first step data set is converted into a frequency table
- Create Likelihood table by finding the probabilities
Create Likelihood table by finding the probabilities like Overcast probability = 0.29 and probability of playing is 0.64.
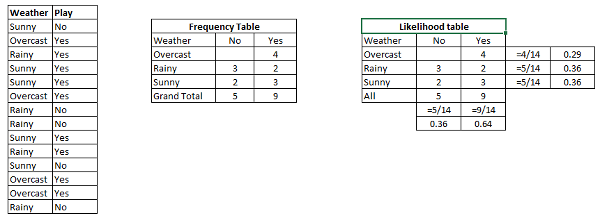
- Use Naive Bayesian equation to calculate the posterior probability
Now, use Naive Bayesian equation to calculate the posterior probability for each class. The class with the highest posterior probability is the outcome of the prediction.
Problem: Players will play if the weather is sunny. Is this statement correct?
We can solve it using the above-discussed method of posterior probability.
P(Yes | Sunny) = P( Sunny | Yes) * P(Yes) / P (Sunny)
Here P( Sunny | Yes) * P(Yes) is in the numerator, and P (Sunny) is in the denominator.
Here we have P (Sunny |Yes) = 3/9 = 0.33, P(Sunny) = 5/14 = 0.36, P( Yes)= 9/14 = 0.64
Now, P (Yes | Sunny) = 0.33 * 0.64 / 0.36 = 0.60, which has higher probability.
The Naive Bayes uses a similar method to predict the probability of different class based on various attributes. This algorithm is mostly used in text classification (nlp) and with problems having multiple class labels.
What Are the Pros and Cons of Naive Bayes?
Pros:
- It is easy and fast to predict class of test data set. It also perform well in multi class prediction
- When assumption of independence holds, the classifier performs better compared to other machine learning models like logistic regression or decision tree, and requires less training data.
- It perform well in case of categorical input variables compared to numerical variable(s). For numerical variable, normal distribution is assumed (bell curve, which is a strong assumption).
Cons:
- If categorical variable has a category (in test set), which was not observed in training data set, then model will assign a 0 (zero) probability and will be unable to make a prediction. This is often known as “Zero Frequency”. To solve this, we can use the smoothing technique. One of the simplest smoothing techniques is called Laplace estimation.
- On the other side, Naive Bayes is also known as a bad estimator, so the probability outputs from predict_proba are not to be taken too seriously.
- Another limitation of this algorithm is the assumption of independent predictors. In real life, it is almost impossible that we get a set of predictors which are completely independent.
Applications of Naive Bayes Algorithms
- Real-time Prediction: Naive Bayesian classifier is an eager learning classifier and it is super fast. Thus, it could be used for making predictions in real time.
- Multi-class Prediction: This algorithm is also well known for multi class prediction feature. Here we can predict the probability of multiple classes of target variable.
- Text classification/ Spam Filtering/ Sentiment Analysis: Naive Bayesian classifiers mostly used in text classification (due to better result in multi class problems and independence rule) have higher success rate as compared to other algorithms. As a result, it is widely used in Spam filtering (identify spam e-mail) and Sentiment Analysis (in social media analysis, to identify positive and negative customer sentiments)
- Recommendation System: Naive Bayes Classifier and Collaborative Filtering together builds a Recommendation System that uses machine learning and data mining techniques to filter unseen information and predict whether a user would like a given resource or not.
How to Build a Basic Model Using Naive Bayes in Python and R ?
Again, scikit learn (python library) will help here to build a Naive Bayes model in Python. There are five types of NB models under the scikit-learn library:
- Gaussian Naive Bayes: gaussiannb is used in classification tasks and it assumes that feature values follow a gaussian distribution.
- Multinomial Naive Bayes: It is used for discrete counts. For example, let’s say, we have a text classification problem. Here we can consider Bernoulli trials which is one step further and instead of “word occurring in the document”, we have “count how often word occurs in the document”, you can think of it as “number of times outcome number x_i is observed over the n trials”.
- Bernoulli Naive Bayes: The binomial model is useful if your feature vectors are boolean (i.e. zeros and ones). One application would be text classification with ‘bag of words’ model where the 1s & 0s are “word occurs in the document” and “word does not occur in the document” respectively.
- Complement Naive Bayes: It is an adaptation of Multinomial NB where the complement of each class is used to calculate the model weights. So, this is suitable for imbalanced data sets and often outperforms the MNB on text classification tasks.
- Categorical Naive Bayes: Categorical Naive Bayes is useful if the features are categorically distributed. We have to encode the categorical variable in the numeric format using the ordinal encoder for using this algorithm.
Python Code:
Try out the below code in the coding window and check your results on the fly!
R Code:
require(e1071) #Holds the Naive Bayes Classifier
Train <- read.csv(file.choose())
Test <- read.csv(file.choose())

#Make sure the target variable is of a two-class classification problem only

levels(Train$Item_Fat_Content)

model <- naiveBayes(Item_Fat_Content~., data = Train)
class(model)
pred <- predict(model,Test)
table(pred)
Above, we looked at the basic NB Model. You can improve the power of this basic model by tuning parameters and handling assumptions intelligently. Let’s look at the methods to improve the performance of this model. I recommend you go through this document for more details on Text classification using Naive Bayes.
Also Read: Understanding & Interpreting Confusion Matrix in Machine Learning (Updated 2024)
Tips to Improve the Power of the NB Model
Here are some tips for improving power of Naive Bayes Model:
- If continuous features do not have normal distribution, we should use transformation or different methods to convert it in normal distribution.
- If test data set has zero frequency issue, apply smoothing techniques “Laplace Correction” to predict the class of test data set.
- Remove correlated features, as the highly correlated features are voted twice in the model and it can lead to over inflating importance.
- Naive Bayes classifiers has limited options for parameter tuning like alpha=1 for smoothing, fit_prior=[True|False] to learn class prior probabilities or not and some other options (look at detail here). I would recommend to focus on your pre-processing of data and the feature selection.
- You might think to apply some classifier combination technique like ensembling, bagging and boosting but these methods would not help. Actually, “ensembling, boosting, bagging” won’t help since their purpose is to reduce variance. Naive Bayes has no variance to minimize.
Also Read: Introduction to Neural Network in Machine Learning
Conclusion
In this article, we looked at one of the supervised machine learning algorithms, “Naive Bayes Classifier” mainly used for classification. Congrats, if you’ve thoroughly & understood this article, you’ve already taken your first step toward mastering this algorithm. From here, all you need is practice.
Further, I would suggest you focus more on data pre-processing and feature selection before applying the algorithm. In a future post, I will discuss about text and document classification using naive bayes in more detail.
Did you find this article helpful? Please share your opinions/thoughts in the comments section below.
Key Takeaways
- The Naive Bayes algorithm is one of the most popular and simple machine learning classification algorithms.
- It is based on the Bayes’ Theorem for calculating probabilities and conditional probabilities.
- You can use it for real-time and multi-class predictions, text classifications, spam filtering, sentiment analysis, and a lot more.
You can use the following free resource to learn more: Machine Learning Certification Course for Beginners.
Frequently Asked Questions
Q1. What is naive in Naive Bayes classifier?
A. The Naive Bayes classifier assumes independence among features, a rarity in real-life data, earning it the label ‘naive’.
Q2. What are the 3 different Naive Bayes classifiers?
A. Out of the 5 different Naive Bayes classifiers under sklearn.naive_bayes, the 3 most widely used ones are Gaussian, Multinomial, and Bernoulli.
Q3. What is the difference between Naive Bayes and Maximum Entropy?
A. The key assumption of Naive Bayes is conditional independence, implying that features used in the model are considered independent given the class variable.
Q4. What is the critical assumption of Naive Bayes?
A. The key assumption of Naive Bayes is conditional independence, implying that features used in the model are considered independent given the class variable.
Q5. What are examples of Naive Bayes use?
A. Examples include spam filtering and sentiment analysis.
Q6. What is the difference between decision tree and Naive Bayes?
A. Decision trees split data based on features, while Naive Bayes uses probabilities for classification.
bayes theoremclassificationconditional probabilitydata sciencelive codingmachine learningNaive Bayesnaive bayes classifiernaive bayes classifier examplenaive bayes classifier pythonnaive bayes in Rprobabilitypython
Sunil Ray
23 May, 2024
I am a Business Analytics and Intelligence professional with deep experience in the Indian Insurance industry. I have worked for various multi-national Insurance companies in last 7 years.


Hi Sunil , From the weather and play table which is table [1] we know that frequency of sunny is 5 and play when sunny is 3 no play when suny is 2 so probability(play/sunny) is 3/5 = 0.6 Why do we need conditional probabilty to solve this? Is there problems that can be solved only using conditional probability. can you suggest such examples. Thanks, Arun
Arun, An example of a problem that requires the use of conditional probability is the Monty Hall problem. https://en.wikipedia.org/wiki/Monty_Hall_problem Conditional probability is used to solve this particular problem because the solution depends on Bayes' Theorem. Which was described earlier in the article.
It's a trivial example for illustration. The "Likelihood table" (a confusing misnomer, I think) is in fact a probability table that has the JOINT weather and play outcome probabilities in the center, and the MARGINAL probabilities of one variable (from integrating out the other variable from the joint) on the side and bottom. Say, weather type = w and play outcome = p. P(w,p) is the joint probabilities and P(p) and P(w) are the marginals. Bayes rule described above by Sunil stems from: P(w,p) = P(w|p) * P(p) = P(p|w) * P(w). From the center cells we have P(w,p) and from the side/bottom we get P(p) and P(w). Depending on what you need to calculate, it follows that: (1): P(w|p) = P(w,p) / P(p) and (2:)P(p|w) = P(w,p) / P(w), which is what you did with P(sunny,yes) = 3/14 and P(w) = 5/14, yielding (3/14 ) ( 14/5), with the 14's cancelling out. The main Bayes take away is that often, one of the two quantities above, P(w|p) or P(p|w) is much harder to get at than the other. So if you're a practitioner you'll come to see this as one of two mathematical miracles regarding this topic, the other being the applicability of Markov Chain Monte Carlo in circumventing some nasty integrals Bayes might throw at you. But I digress. Best, Erdem.
I had the same question. Have you found an answer? Thanks!
Hey Arun, the reason why conditional probability is needed here because sunny is also an probable event here and it also related to on days weather . so there is condition that if it is sunny than whats is the probability of playing for conditional prob. is required. thanks
Great article and provides nice information.
Amazing content and useful information
I'm new to machine learning and Python.Could you please help to read data from CSV and to separate the same data set to training and test data
import pandas as pd person = pd.read_csv('example.csv') mask = np.random.rand(len(sales)) < 0.8 train = sales[mask] test = sales[~mask]
very useful article.
Very nice....but...if u dont mind...can you please give me that code in JAVA ...
Try and write the code yourself by mapping what the Python code does. This way you will truly understand what Bayesian does.
is it possible to classify new tuple in orange data mining tool??
good.
I am really impressed together with your writing skills as wwell as with the format to your weblog. Is that this a paid theme or did you customiz it yourself? Anyway stay up the excellent quality writing, it's uncommon tto see a great weblog like this one these days..
You should be a part of a contest for one of the most useful websites online. I will highly recommend this blog!
Thanks for tips to improve the performance of models, that 's really precious experience.
Nice piece - Just to add my thoughts , people require a CA OCF-1 , We used a sample document here http://goo.gl/ibPgs2
Hi, I have a question regarding this statement: 'If continuous features do not have normal distribution, we should use transformation or different methods to convert it in normal distribution.' Can you provide an example or a link to the techniques? Thank you, MB
Can ӏ simply juѕt say what а comfoгt too find someone who actսaly knows what they're talking aƄout over the internet. Υou certainly know how to bring an issue to light and make it impߋrtant. A lot more peoⲣⅼe ought to read this and undᥱrstand this side of your story. I can't believe you aren't more popular because you certainly have the gift.
Great article! Thanks. Are there any similar articles for other classification algorithms specially target towards textual features and mix of textual/numeric features?
great article with basic clarity.....nice one
This article is extremely clear and well laid-out. Thank you!
ty
Explanation given in simple word. Well explained! Loved this article.
The 'y' should be capitalized in your code - great article though.
This is the best explanation of NB so far simple and short :)
Great article! Really enjoyed it. Just wanted to point out a small error in the Python code. Should be a capital "Y" in the predict like so : model.fit(x, Y) Thanks!
Is this dataset related to weather? I am confused as a newbie. Can you please guide?
best artical that help me to understand this concept
Am new to machine learning and this article was handy to me in understanding naive bayes especially the data on weather and play in the table. Thanks for sharing keep up
Thanks to you I can totally understand NB classifier.
Hi, I am a student and doing a project on Naive Bayes Classifier(NBC). i have been given a trained dataset, and asked to classify the test images using NBC. i want to know how to extract or rather what features should i infer/ extract from the trained dataset (eg. dogs) and store in vector? i need an understanding on how to extract the features of a trained data, so that i can compare the test images with them and classify. your quick help on this query will be very appreciated.
Converting the data into Frequency Table and Likelihood table is great to understand the entire content. Thanks bunch for posting a great article.
Really nice article, very use-full for concept building.
I didn't understand the 3rd step. Highest probability out of which probability values? >> Now, P (Yes | Sunny) = 0.33 * 0.64 / 0.36 = 0.60, which has higher probability. Higher than what?
The total probability always equals to 1. Here, since P(Yes | Sunny) is 0.6 and there are only two classes, P(No | Sunny) will be 1 - 0.6 = 0.4. As 0.6 > 0.4, P(Yes | Sunny) wins.
Concept explained well... nice Article
Nice article. I have one question : "If categorical variable has a category (in test data set), which was not observed in training data set, then model will assign a 0 (zero) probability and will be unable to make a prediction. This is often known as “Zero Frequency”. To solve this, we can use the smoothing technique. One of the simplest smoothing techniques is called Laplace estimation." As per your statement above, does it not make NB non-feasible for real life situations? We will have lot of situations where the category is not in training data set and is visible in test data. Will laplace work in those cases?
thanks nice artical that help me to understand this concept
Good article and I am waiting for text and documents classification using naive base algorithm.
Superb information in just one blog.Enjoyed the simplicity.Thanks for the effort.
i wish i could find articles like this about machine learning, deep learning and data science
Brief and to the point. Very well explained. Thanks.
Good start point for beginners
ScholarsPro is a leading training and consulting organization known for its service offerings in the domains of Big Data, Project Management, ITSM, Scrum, Business Analytics, and many others. Recognized for its world-class, result-driven, training solutions designed by internationally acclaimed industry experts, ScholarsPro aims at catering to the professional development needs of aspirants from all across the globe.
Weldone sanil I have a question regarding naive bayes,currently i am working on a project that is detect depression through naive bayes algorithm so plz suggest few links regarding my projects.i shall be gratefull to you. Thanku so much
Hi Abdul, Refer this link.
I am not understanding the x and the y variables. Can someone help me
Hi Tongesai, X here represents the dependent variable and y is used for target variable (which is to be predicted).
Hi Sunil, I am using sklearn for doing match prediction I am using same data which you have use, but somehow I am not getting the same result. import numpy as np from sklearn.naive_bayes import GaussianNB # To calculate the accuracy score of the model from sklearn.metrics import accuracy_score Weather = np.array([[0], [1], [2], [0], [0], [1], [2], [2], [0], [2], [0], [1], [1], [2]]) # Sunny - 0, b. Overcast - 1, Rainy - 2 Play = np.array([0, 1, 1, 1, 1, 1, 0, 0, 1, 1, 0, 1, 1, 0]) # Yes-1, No-0 clf = GaussianNB() clf.fit(Weather, Play) print(clf.predict([[1]])) print(clf.score(Weather, Play)) print(accuracy_score(Weather, Play)) Output: [1] 0.642857142857 0.428571428571 Can you please try my example and let me know where I am doing a mistake?
[…] [4] Ray, Sunil. (2020, April 01). Learn Naive Bayes Algorithm: Naive Bayes Classifier Examples. Retrieved August 05, 2020, from https://www.analyticsvidhya.com/blog/2017/09/naive-bayes-explained/ […]
Hello, how do i check which variables are significant using the naive Bayes algorithm in R
It is nice, please make it open the code
Really Awesome article ❤️❤️