10 Important Questions for Cracking a Data Science Interview
This article was published as a part of the Data Science Blogathon.
Introduction
You may be asked questions on various topics in a data science interview. These include statistics, machine learning, probability, data visualization, data analysis, and behavioral questions. Besides these, your coding abilities are also tested by asking you to solve a problem, and you might be asked to solve a data science case study. While the skills required for coding and solving case studies can be acquired by practicing, theoretical concepts can be clarified by keeping your foundations strong.

Data Science interviews are conducted for various roles like Data Scientist, Data Analyst, Machine Learning Engineer, Data Visualization Engineer, etc. Though the roles are different, the core skills required to crack an interview for any of these roles are the same.
In this article, we are going to look at a few important questions for a data science interview.
Data Science Interview Questions
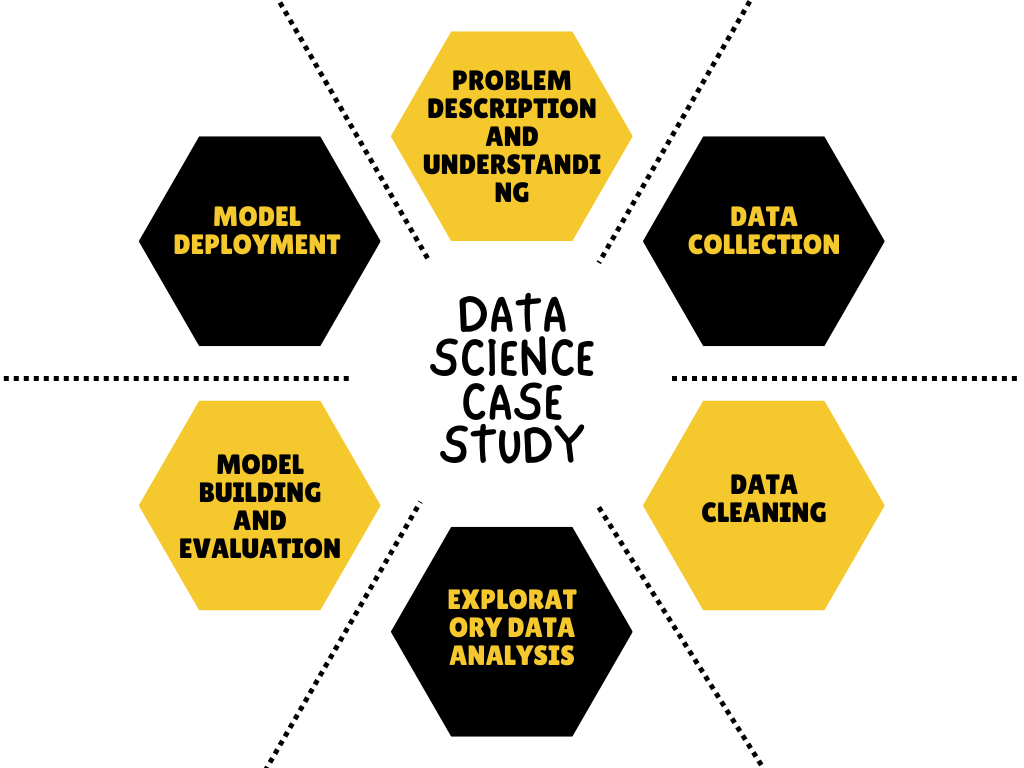
1. Describe the workflow of a data science case study.
The following steps are involved while solving a data science case study.
- Problem description and understanding
- Data collection
- Exploratory data analysis (involves data exploration,
feature engineering, outlier detection and treatment, and, handling missing
data). - Model building
- Model evaluation
- Model deployment
2. What are the assumptions of linear regression?
The assumptions of Linear Regression are:
- The data should have a linear relationship.
- There should be multi-variate normality.
- No or little multi-collinearity.
3. What are outliers and how do they affect the end result?
Data points that differ significantly from other observations are known as outliers in a data set. Outliers are the data points that differ from the rest of the data and do not follow the common data pattern. An outlier can reduce a model’s accuracy and efficiency, depending on its reason. They can cause adverse data analysis problems and manipulate the entire process, thereby causing us to end up with a biased result. Therefore, it is important to detect any outliers present in the data and treat them.
Data Outliers can be identified by visualizing the data set using scatter plots, box plots, etc.,.
4. What is the p-value in hypothesis testing?
In hypothesis testing, p-value refers to the likelihood of a data point occurring with random choice. If a p-value is 0.5 and is less than alpha, we can conclude that there is a probability of 5% that the experiment results occurred by chance, or you can say, 5% of the time, we can observe these results by chance.
5. What is normal distribution?
A normal distribution is a probability function that describes how the value of a variable is distributed over all the possible values.
Data distribution can be identified by plotting the values using histograms or scatter plots. If the histogram representing the distribution has a central peak, it is normally distributed. The mean and standard deviation are two main measures that help identify the data’s normal distribution.
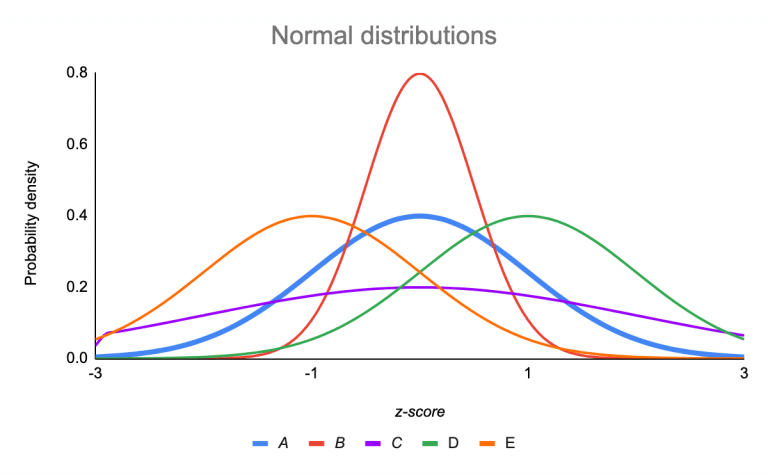
Source:https://www.scribbr.com/statistics/standard-normal-distribution/
In the above picture, the red line represents a normal distribution.
6. How to calculate the standard deviation of data in Python?
A standard deviation measures the deviation of data points from the central point of the data. It represents how far a particular data point is from the main data distribution. Since it measures the deviation of the data concerning the mean, it shows the spread of data around the mean.
It is calculated by using the Numpy method ‘std’.
Example:
a = np.array([[1, 2], [3, 4]])
np.std(a)
>>> 1.1180339887498949
Using the np.std method, we can also calculate the standard deviation across a specific axis also. The stdev() method present in the statistics module of Python can also be used.
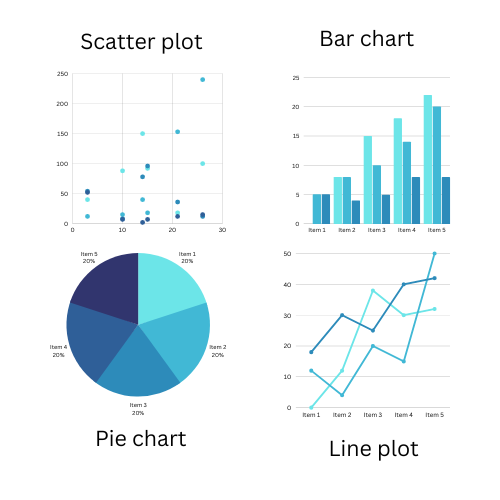
7. What are the different kinds of plots in data visualization?
Plots can be divided into the following categories based on their purpose:
- Correlation plots: they give us information about how one data point changes with respect to another. Scatter plots, count plots, marginal boxplots, heatmaps, and pairwise plots are some examples of correlation plots.
- Deviation plots: Such plots help to identify the amount of variation in the data. Examples of deviation plots include diverging plots and diverging dot plots.
- Ranking plots: Sometimes, we may need to know the ranking of the data, like maximum, minimum, mode, etc. In such situations, ranking plots such as ordered bar charts or dot plots come in handy.
- Distribution plots: Distribution plots help in knowing the distribution of the data. Histograms for continuous and discrete data, density plots, and box plots are some examples of distribution plots.
- Composition plots: These graphs tell us the composition of the data. They help in understanding how much of the entire data set a certain data point constitutes.
- Change plots: They are used to identify the changes within the data variable. Time series plots are a prominent example of change plots.
8. What is bias and variance? How do they affect the model’s performance? What is the bias-variance tradeoff?
Bias refers to the difference between the actual and predicted values. High bias causes underfitting problems; hence low bias is preferred.
Variance can be defined as the model’s response to the fluctuations in the data. High variance causes over-fitting issues and hence is undesirable.
Both bias and variance affect the model’s ability to generalize the data when present in high values. In turn, this affects the accuracy of the model. Hence, it is important to maintain a balance between the bias and variance of a model. The correct trade-off point must be chosen to improve the model’s performance while ensuring that the model’s capability to generalize is not compromised.
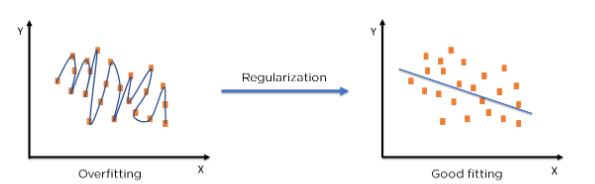
9. Define regularization?
Regularization is a technique used to deal with the problem of overfitting in machine learning models. Here, we keep the number of features and reduce the feature size. It reduces the size of the coefficients towards zero, thus avoiding the overfitting problem. Regularization reduces the magnitude of the features while allowing us to maintain all the featured.
It is of two types: Ridge regression and Lasso regression.
10. What role does machine learning play in data science?
Data science is a field that requires input from other disciplines, such as machine learning, deep learning, and artificial intelligence, to analyze data, build solutions, and predict outcomes. In particular, machine learning is used to build models that use currently available data to predict outcomes. In most cases, data science case study solutions are built using machine learning concepts and methods. Supervised and unsupervised learning, exploratory data analysis, feature engineering, model evaluation, hyperparameter tuning, epoch, etc., are some machine learning concepts widely used in data science.
Conclusion
Let’s recap what we learned in this article. We looked into
- The different steps involved in solving a data science case study
- Types of plots used for representing data
- How regularization helps reduce overfitting
- We learned about the impact of outliers on the end results
- We also have a quick glance at many Machine learning concepts like bias, variance, standard deviation, linear regression p- value, etc.,.
Here are a few important questions you must know before attending a data science interview.
Besides these, questions on projects you worked on, your work experience, solving case studies, SQL queries, coding questions, fundamental concepts of Machine learning, and Data Science are quite common. Hence, you must hold a strong grip over all the above-stated concepts and subjects to crack any data science interview.
The media shown in this article is not owned by Analytics Vidhya and is used at the Author’s discretion.


