Using statistics: How to understand population distributions?
One of the common queries, which I get on the blog is:
I am not a Mathematics / Statistics graduate. Can I still become a good business analyst?
or
I am not good at statistics. Can I still change my career to become a business analyst?
The simple answer to the question is – you can’t become a good analyst until you know statistics. However, you don’t need to be an expert in statistics to become a good business analyst.
So, you don’t need to understand the joke in the strip, in order to qualify as a business analyst:
Two types of Business Analytics:
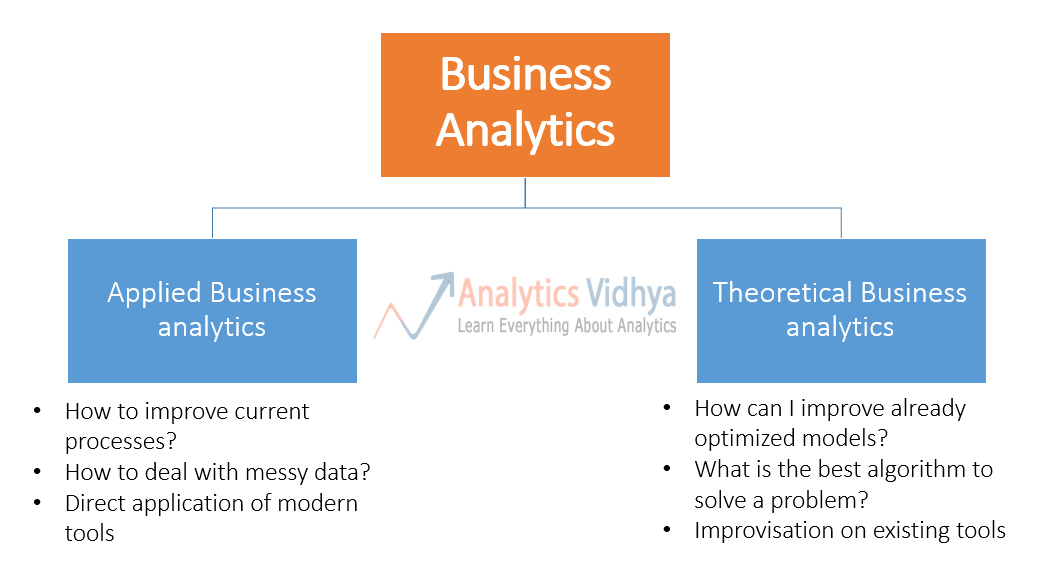
Business anlaytics can be divided in two classes – applied business analytics and theoretical business analytics. Here are definitions of the two streams:
- Applied Business Analytics – This is the work, where the emphasis is to solve a problem at hand. What matters is that you have a strategy / algorithm, which is better than what is happening currently. You deal with practical problems in this stream – messy data, missing values, bad data capture etc. More than 95% of times, you would typically use the algorithm and outputs straight from the tools. As long as you are aware of the assumptions in your model, can check whether they are holding good and interpret the output of the algorithms correctly, you are good for applied business analytics.
- For example, if you know the assumptions in Linear regression and can interpret what is R-square and adjusted R-square, you would be good to apply Linear Regression.
- Theoretical Business Analytics – This is the research area in business analytics. When you have a problem, where current set of algorithms are already optimized and applying standard techniques would not provide you any further uplift. This is when, you need to get into statistical details of various algorithms and then improve them.
Please note that this is not a standard categorization of Business Analytics and it might be difficult to identify some projects in exact buckets. However, it is good enough to communicate the point that you can deal with most of the business analytics problems with basic knowledge of statistics.
What does an analyst need to know?
Now, that you understand the two classes of business analytics, here is some good news! You don’t need to be a statistician to practice applied business analytics.
So, what exactly do you need to know to become an applied business analytics practitioner? I thought why not run a series of articles explaining the basic concepts of statistics, an applied BA practitioner needs to know.
Please note that this series is not intended to be a thesis on statistics. Instead, it takes a very practical outlook to apply statistics to solve business problems.
Concepts to understand population distributions:
One of the first things a business analyst needs to do is understand various distributions of parameters and population.
One of the most frequently used method to understand distributions is to plot them using histograms. A histogram represents frequencies of various values through a plot in uniform buckets (popularly known as bins). In case of continuous variables, a histogram represents the probability distribution function (we will cover this later). If you want an example of how histogram is plotted, you can look at this video from Khanacademy. Here is how a typical histogram might look like:

Example of histogram. Source: Wikipedia
There are 3 variety of measures, required to understand a distribution:
- Measure of Central tendency
- Measure of dispersion
- Measure to describe shape of curve
Measures of Central tendency:
Measures of central tendencies are measures, which help you describe a population, through a single metric. For example, if you were to compare Saving habits of people across various nations, you will compare average Savings rate in each of these nations.
Following are the measures of central tendency:
- Mean – or the average
- Median – the value, which divides the population in two half
- Mode – the most frequent value in a population
The following image illustrates how mean, median and mode would be placed in a couple of scenarios:
Among the three measures, mean is typically affected the most by Outliers (unusually high or low values), followed by the median and mode.
Measures of Dispersion:
Measures of dispersion reveal how is the population distributed around the measures of central tendency.
- Range – Difference in the maximum and minimum value in the population
- Quartiles – Values, which divide the populaiton in 4 equal subsets (typically referred to as first quartile, second quartile and third quartile)
- Inter-quartile range – The difference in third quartile (Q3) and first quartile (Q1). By definition of quartiles, 50% of the population lies in the inter-quartile range.
- Variance: The average of the squared differences from the Mean.
- Standard Deviation: is square root of Variance
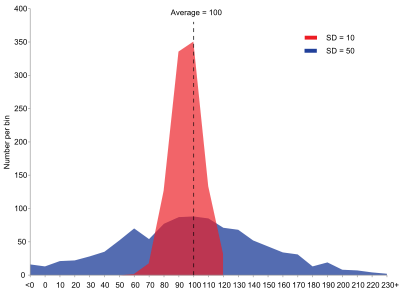
Difference in distribution of 2 populations with same mean, median and mode. Source: Wikipedia
Measures to describe shape of distribution:
- Skewness – Skewness is a measure of the asymmetry. Negatively skewed curve has a long left tail and vice versa.
- Kurtosis – Kurtosis is a measure of the “peaked ness”. Distributions with higher peaks have positive kurtosis and vice-versa
A few practical tips to understand distributions better:
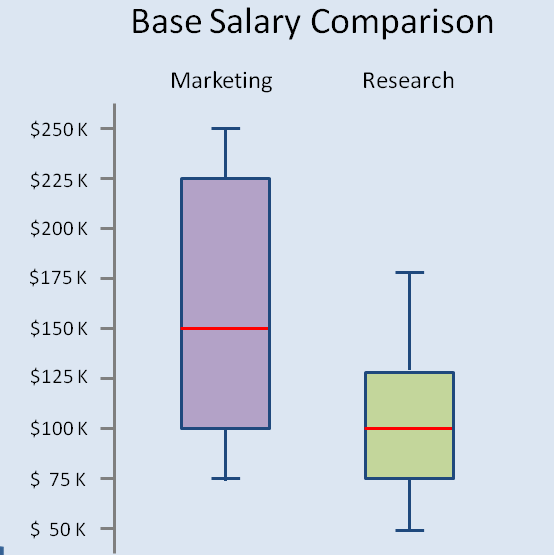
- Use of box plots: Box plots are one of the easiest and most intuitive way to understand distributions. They show mean, median, quartiles and Outliers on single plot.
- You can use box plots next to each other for various categories / segments of population to understand overlap / differences in the population. Following is an example of one such comparison (with illustrative data):
 In this post, we looked use of statistics to plot and understand distributions of populations – first steps for any business analyst to do in a project. In the articles to follow in this series, we will look at use of confidence intervals, hypothesis testing, probabilities and measures to judge various predictive models. If you would want me to cover more topics, please let me know through comments below.
In the article next week (from baby steps in Python series), we will see how to look at these measures and distributions using Python on a Kaggle dataset.
If you like what you just read & want to continue your analytics learning, subscribe to our emails, follow us on twitter or like our facebook page.
Kunal is a post graduate from IIT Bombay in Aerospace Engineering. He has spent more than 10 years in field of Data Science. His work experience ranges from mature markets like UK to a developing market like India. During this period he has lead teams of various sizes and has worked on various tools like SAS, SPSS, Qlikview, R, Python and Matlab.


Thank you for a lovely insight . I have just started my career as a data analyst so i would like to ask you are there any books or courses that i can do to enhance my statistics skills ?
Precise and to the point. Your blog is such a treasure trove. Looking forward to read more on this topic. Thanks Kunal
Thanks Kunal, helpful article, Can you explain same things using SAS ? If possible, please explain a bit more about kurtosis and what is the physical significance of it along with skewness ? Also, by looking at default output of means procedure in SAS, what story can we tell to the client ? Can you please answer this to make me understand how to interpret the results. I know we get N, min, max, std and mean as default but how to tell a story using these to the third person is what I want to understand . Any enlightment would be of great help.
Parul, Getting the output from SAS is very easy, you can use proc means and proc univariate. With regards to the story, stay tuned for the next article. Regards, Kunal
Skewness and Kurtosis,if Both values close to 0 expect normal distribution. practically impossible to get 0.Distribution plays pivotal role for example if my dependant variable is having 97% zero that makes possions and 3% $amount making it continous it means distribution is composed of Poisson's (1) and gamma (2) somewhere between 1~2 . hence if i m predicting any value ,no algorithm can give me a clear output of Zero hence treatment require specific algorithm hope it gives some light thanks
Thanks Mahendra!
You are talking about claims process in insurance..very few policies make claims and they have some severity... these pro blems are solved by taking composite score of poisson and gamma or you can use tweedie distribution when the mass is centered at 0..loss ratio modeling uses tweedie...SAS has procs for both
I liked the article but there are some technical short comings in it. What you have shown is not a box plot but a modified box plot or a whisker plot. It would have been better if you specified lower and upper whisker length.
Thanks Harsh for pointing it out. It is indeed a box and a whisker plot, with a length equal to 1.5 x IQR above and below the box. The idea of the article is to provide people enough tools to get them started on the subject. By no means, these articles contain all the technical details. Regards, Kunal
Hi, I am MCA Graguate. I would like to learn analytics. can i become a business Analytics / Data Analytics. Because totally differ from my curriculum and career. Do I get the job opportunity? how will be the exposure in this field. Can you please assist further on this. Thanks Sujatha.
Sujatha, There is nothing which stops you from becoming a business analytics. You can become one, if you devote the right time and make the right efforts. Don't expect to get short term results - give yourself time of about 1 - 2 years and undergo various courses and certifications. Practice problems, network with relevant people - over time you can become an analyst. Don't expect a short term gain or journey here. Regards, Kunal
Thanks Kunal
Udacity has some good statstics courses, free of charge.
The article above is very meaningful and very precise for any Statistic learners. Looking forward for some more articles on other part of this subject with some examples. Nitin
Hi, Kunal. I've just seen your post.Its really interesting.Do you have experience of applying predictive analytic for analysis. please give some insight into its current applications and related careers in business. I am waiting. Good luck, Fazal
Hi Kunal, Great intro to stats for beginners. Where can I find the follow up (next week) article (how to look at these measures) and articles on the use of confidence intervals, hypothesis testing, probabilities and measures to judge various predictive models, mentionned in this article? Thanks Hassine
i am studied spss recently . i have 54 years of age. i have last 15 years of expeirince in market research field except data analysis. I want a training for data analysis. Where can i get a chance. Please give a reply as early as possible. Thanking you SANAL KUMAR
I enjoyed reading this one. Thanks for posting such articles.
Sir, please post an article on fuzzy logic. Suppose I have 2 different datasets with different sizes and I want to match approximate string matching in R studio.then how can I do this? Please help if you can....
Hi Kunal sir, This is a wonderful article to provide stats and its usages in applied BA for a novice. I am looking forward to read more statistics term and how it is used in the world of data science. Please keep me posted.
Hi Avi, Thank you for the feedback. Glad you found this useful. You can subscribe to stay updated on the articles and posts by Analytics Vidhya.