Sachin has inspired an entire generation of cricketers in India and abroad. He is one of the few “Universal God” in India, i.e. people follow him irrespective of their age, gender, caste or profession. He can bring the entire nation to a stop while he is in his “zone”. (For non-cricket followers, Cricket is more than a religion in India and Sachin has been probably the most popular cricketer in India’s history).
Today was the launch of his autobiography – Playing it my way. While I plan to grab a copy and read shortly, I thought of paying my tribute to my inspiration “Sachin Ramesh Tendulkar”. So, I have created a dashboard in Qlikview to summarize Sachin’s test career and his achievements.
Before we start – a glimpse of Sachin-mania
Sachin has been the most complete batsman in the world cricket. Tendulkar holds about every batting record of the game – be it most runs or hundreds in Tests and ODIs. His stance and stroke making depicts the perfect balance, precision in movement and a wow factor for thousands of fans in anticipation. I can not forget his classical straight drive, back-foot punch and dancing down the track to hit sixes. He held an entire army of strokes in his kitty and would unleash them at the right moment, in the right form. He currently holds 100 centuries including both formats of the game – Test and ODI.
Tendulkar started his test career in Nov 1989 – when i was 5 years old. I started playing cricket watching Sachin bat (and bowl sometimes too). I have been crazy (like a lot of other fans) to watch him bat all these years. So as a small tribute, I have developed a qlikview dashboard to visualize Sachin’s test performance while discussing different visualization methods of Qlikview.
Let’s look at different tabs of this dashboard and what information is available in them
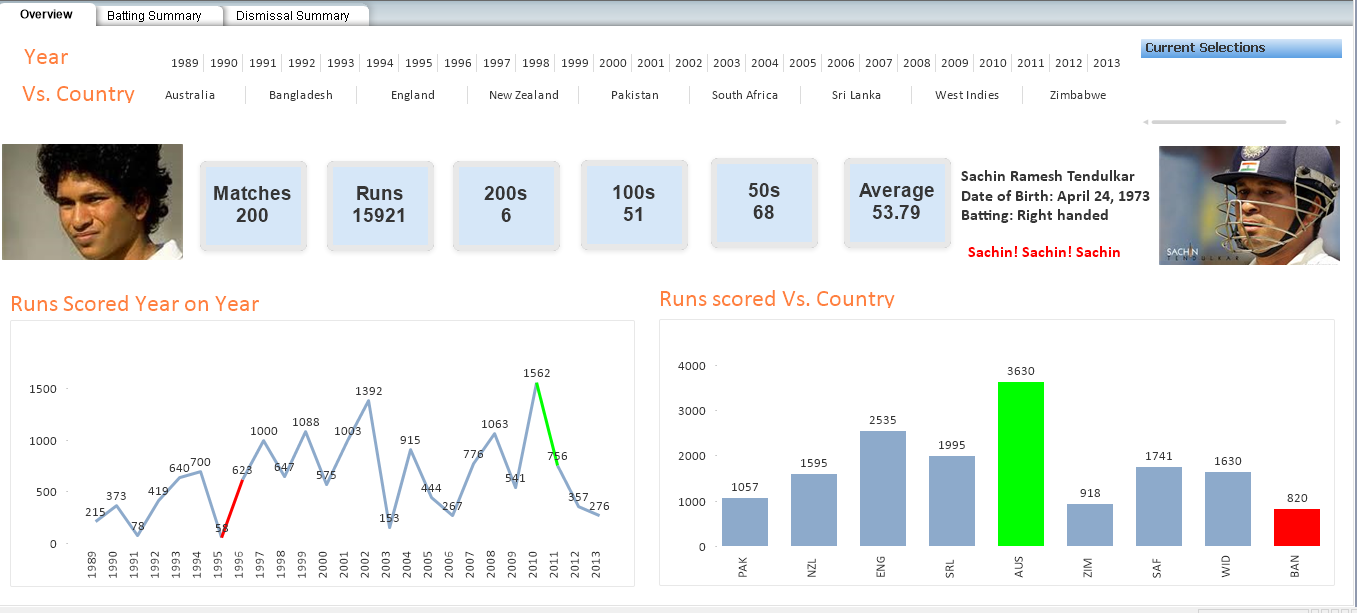
Above is overview of Sachin’s performance summary over the years and against different teams. Here, we have various information about Sachin’s test career:
- On his Test debut, Sachin Tendulkar was the third youngest debutant (16years 205days) in test cricket
- He has played 200 test matches, 15,921 test runs and 51 test hundreds. These are highest compared to any other player on the earth.
- Sachin was first player to reach 12,000, 13,000, 14000 and 15,000 test runs.
- Here, we can easily see that he has scored 1,562 runs in 2010 which is best year of his career and 58 runs in year 1995 (worst year in his career)
- He scored (3,630) highest against Australia (the team which dominated the world of cricket for most of this time) and lowest (820) against Bangladesh (due to low number of matches).
Now lets move to Batting summary of Sachin’s test career:
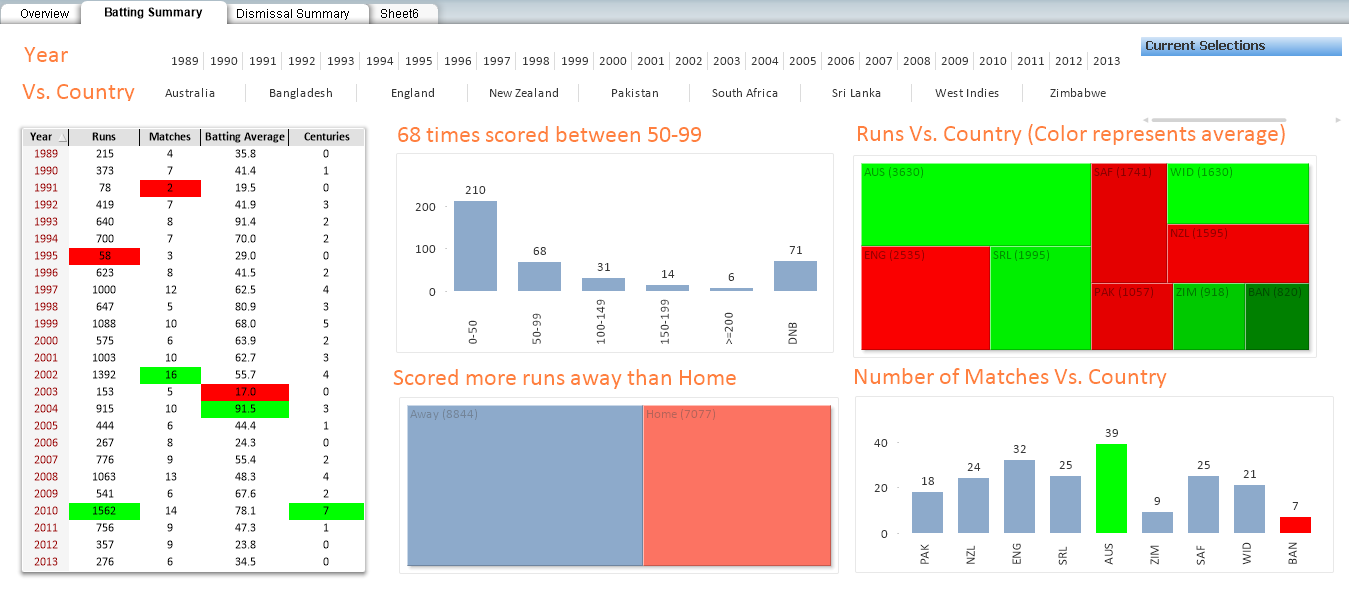
- He made a strong comeback between 2003 and 2004. His batting average increased from a meager 17 to 91.5
- He is the fourth highest runs scorer in a single calendar year in Test History. He has scored 1562 runs in 2010 and is behind Mohammad Yousuf (1780 runs in 2006), Viv Richards (1710 runs in 1976) and Graeme Smith (1656 runs in 2008).
- He scored highest number of 150+ score in Test Cricket (20)
- He has the world record for 8,844 runs in Tests away from home.
- When I select Away as selection in the Block chart, I can see that Sachin has scored 29 test hundreds away from home – which is a world record.
- He scored 7 centuries in year 2010 alone – more than what a lot of batsman manage to score in their entire career.
- In Runs Vs. Country Chart (Block chart), you can see that block size is representing the runs scored against country, where as the color of block represents the average. Sachin has better average against Bangladesh, Zimbabwe and Australia (136, 76.5, 55.5) where as lowest average against Pakistan, South Africa and New Zealand (42.3, 42.5, 46.9). Sachin’s lowest average is better than most of the leading batsman in world – no wonder he was referred to as a run machine.
- Sachin played highest number of matches against Australia (39) and England (32).
Now let’s look at the Sachin’s dismissals
(I know the ardent fans would be shouting that these stats include a few wrong decisions as well)

- As Sachin has scored highest score against Australia, he also got highest dismissals by them
- He was an awesome runner within 22 yards and has only been dismissed 9 times as run out
- He was dismissed highest number of times by McGrath, Gillespie and Murali (6 times) – Oh! How much I loved these battles
- England comes out to be a strong opponent, as Sachin got dismissed second highest number of times (49) by England and he has low average against them. Well done England!
Let’s look at the methods we used to visualize this information
- Represent images, headings and summary in text boxes
- Highlight maximum and minimum value of line chart, Bar chart and pivot tables
- Use color of block chart to represent batting average
- Sorting in bar chart based on expression
- Use of scroll bar in column chart
- Various formatting options for different objects like list box, column, Pie and block chart.
End Note:-
In this article, we looked at various visualization methods to represent information in Qlikview dashboard while discussing about test match performance of the legend Sachin Ramesh Tendulkar. In next article, we will discuss details about these methods, specifically:
- How to highlight maximum and minimum values of column and line charts?
- How to show another expression by color of the section of block?
- Sorting of dimension based on expression
- How to use scroll bar in column chart and many other layout or visualization options.
Have you found this article interesting or you have better visualization methods to represent similar information. If so, I’d love to hear your thoughts through comments below as it also benefit someone while designing dashboard.
If you like what you just read & want to continue your analytics learning, subscribe to our emails, follow us on twitter or like our facebook page.
Sunil Ray is Chief Content Officer at Analytics Vidhya, India's largest Analytics community. I am deeply passionate about understanding and explaining concepts from first principles. In my current role, I am responsible for creating top notch content for Analytics Vidhya including its courses, conferences, blogs and Competitions.
I thrive in fast paced environment and love building and scaling products which unleash huge value for customers using data and technology. Over the last 6 years, I have built the content team and created multiple data products at Analytics Vidhya.
Prior to Analytics Vidhya, I have 7+ years of experience working with several insurance companies like Max Life, Max Bupa, Birla Sun Life & Aviva Life Insurance in different data roles.
Industry exposure: Insurance, and EdTech
Major capabilities: Content Development, Product Management, Analytics, Growth Strategy.


Irrelevant post on this blog...
Venu, Sorry to disappoint you on this post. I personally think that the topic was interesting and would have presented a nice way to get people excited on building some dashboard on a subject they love - which it did to some extent. Thanks for your feedback - highly appreciated. Regards, Kunal
Please share the data source. I would like to try this in Qlikview.
I cannot find the link to the dashboard.. Looks Interesting.