Ultimate guide for Data Exploration in Python using NumPy, Matplotlib and Pandas
Introduction
Exploring data sets and developing deep understanding about the data is one of the most important skills every data scientist should possess. People estimate that the time spent on these activities can go as high as 80% of the project time in some cases.
Python has been gaining a lot of ground as preferred tool for data scientists lately, and for the right reasons. Ease of learning, powerful libraries with integration of C/C++, production readiness and integration with web stack are some of the main reasons for this move lately.
In this guide, I will use NumPy, Matplotlib, Seaborn, and Pandas to perform data exploration. These are powerful libraries to perform data exploration in Python. The idea is to create a ready reference for some of the regular operations required frequently. I am using an iPython Notebook to perform data exploration and would recommend the same for its natural fit for exploratory analysis.
In case you missed it, I would suggest you to refer to the baby steps series of Python to understand the basics of python programming.
- Learning Python for data analysis – with instructions on installation and creating the environment
- Libraries and data structures
- Exploratory analysis in Python (using Pandas)
- Data Munging in Python (using Pandas)
Contents – Data Exploration
Here are the operations I’ll cover in this article (Refer to this article for similar operations in SAS):
-
How to remove duplicate values of a variable?
-
How to group variables to calculate count, average, sum?
-
How to recognize and treat missing values and outliers?
-
How to merge / join data set or dataframes effectively in Pandas?
Part 1: How to load data file(s) using Pandas?
Input data sets can be in various formats (.XLS, .TXT, .CSV, JSON ). In Python, it is easy to load data from any source, due to its simple syntax and availability of predefined libraries, such as Pandas. Here I will make use of Pandas itself.
Pandas features a number of functions for reading tabular data as a Pandas DataFrame object. Below are the common functions that can be used to read data (including read_csv in Pandas):
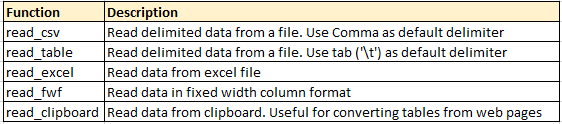
Loading data from a CSV file(s):
Code
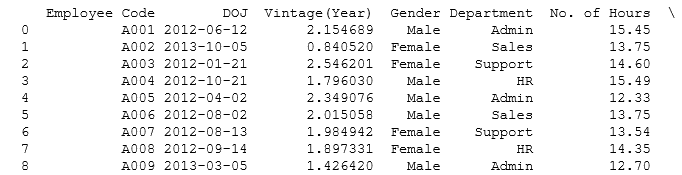
Loading data from excel file(s):
Code
df=pd.read_excel("E:/EMP.xlsx", "Data") # Load Data sheet of excel file EMP
Output
print df
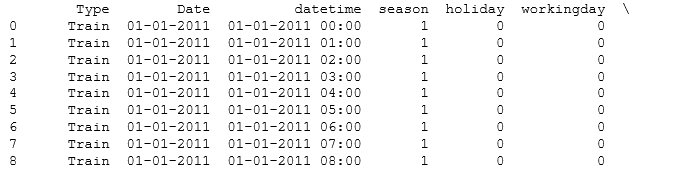
Loading data from a txt file(s):
Code:
df=pd.read_csv("E:/Test.txt",sep='\t') # Load Data from text file having tab '\t' delimeter print df
Part 2: How to convert a variable to a different data type?
Converting a variable data type to others is an important and common procedure we perform after loading data. Let’s look at some of the commands to perform these conversions:
-
Convert numeric variables to string variables and vice versa
srting_outcome = str(numeric_input) #Converts numeric_input to string_outcome
integer_outcome = int(string_input) #Converts string_input to integer_outcome
float_outcome = float(string_input) #Converts string_input to integer_outcome
The later operations are especially useful when you input value from user using raw_input(). By default, the values are read at string.
-
Convert character date to Date:
There are multiple ways to do this. The simplest would be to use the datetime library and strptime function. Here is the code:
from datetime import datetime
char_date = 'Apr 1 2015 1:20 PM' #creating example character date
date_obj = datetime.strptime(char_date, '%b %d %Y %I:%M%p')
print date_obj
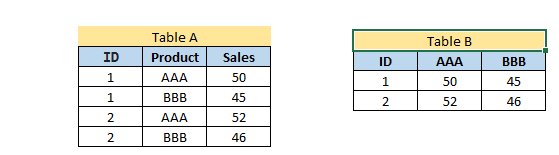
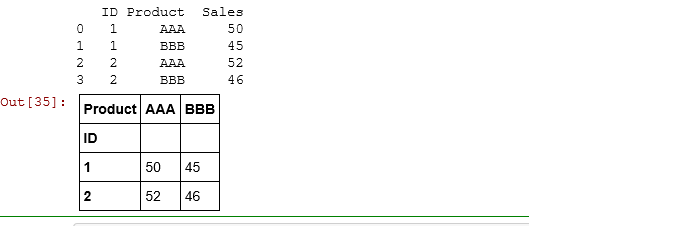
Part 3: How to transpose a Data set or dataframe using Pandas?
Here, I want to transpose Table A into Table B on the variable Product. This task can be accomplished by using Pandas dataframe.pivot:
Code
#Transposing Pandas dataframe by a variable
df=pd.read_excel("E:/transpose.xlsx", "Sheet1") # Load Data sheet of excel file EMP
print df
result= df.pivot(index= 'ID', columns='Product', values='Sales')
result
Output
Part 4: How to sort a Pandas DataFrame?
Sorting of data can be done using dataframe.sort(). It can be based on multiple variables and ascending or descending both orders.
Code
#Sorting Pandas Dataframe
df=pd.read_excel("E:/transpose.xlsx", "Sheet1") #Add by variable name(s) to sort
print df.sort(['Product','Sales'], ascending=[True, False])
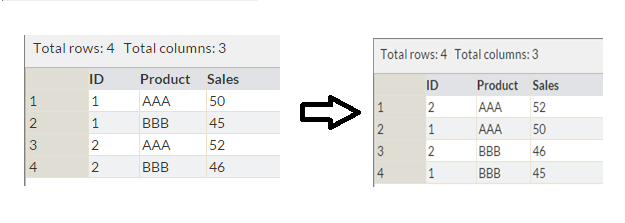 Above, we have a table with variables ID, Product and Sales. Now, we want to sort it by Product and Sales (in descending order) as shown in table 2.
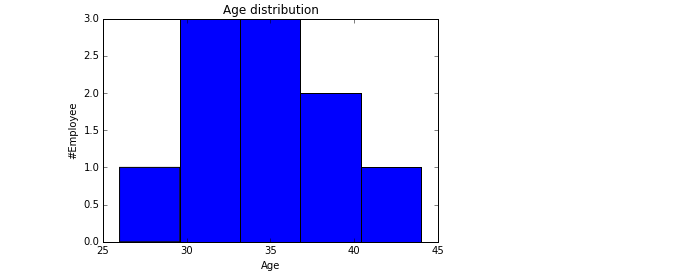
Part 5: How to create plots (Histogram, Scatter, Box Plot)?
Data visualization always helps to understand the data easily. Python has libraries like matplotlib and seaborn to create multiple graphs effectively. Let’s look at the some of the visualizations to understand below behavior of variable(s) .
- The distribution of age
- Relation between age and sales; and
- If sales are normally distributed or not?
Histogram:
Code
#Plot Histogram
import matplotlib.pyplot as plt
import pandas as pd
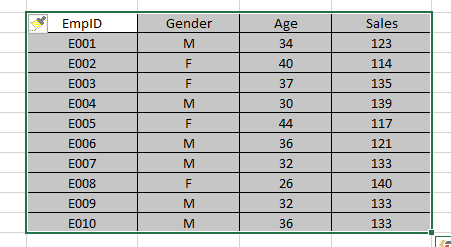
df=pd.read_excel("E:/First.xlsx", "Sheet1")
#Plots in matplotlib reside within a figure object, use plt.figure to create new figure
fig=plt.figure()
#Create one or more subplots using add_subplot, because you can't create blank figure
ax = fig.add_subplot(1,1,1)
#Variable
ax.hist(df['Age'],bins = 5)
#Labels and Tit
plt.title('Age distribution')
plt.xlabel('Age')
plt.ylabel('#Employee')
plt.show()
Output
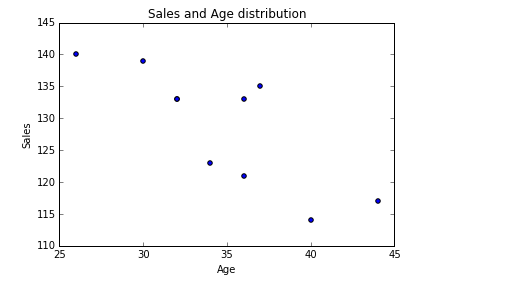
Scatter plot:
Code
#Plots in matplotlib reside within a figure object, use plt.figure to create new figure fig=plt.figure()
#Create one or more subplots using add_subplot, because you can't create blank figure
ax = fig.add_subplot(1,1,1)
#Variable
ax.scatter(df['Age'],df['Sales'])
#Labels and Tit
plt.title('Sales and Age distribution')
plt.xlabel('Age')
plt.ylabel('Sales')
plt.show()
Output
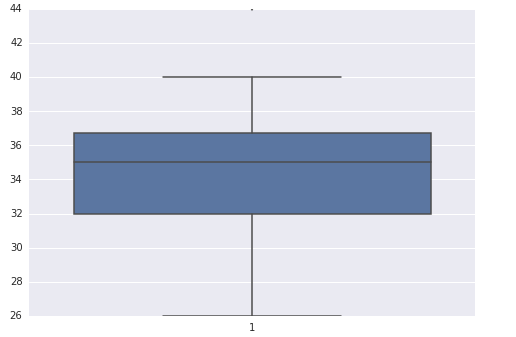
Box-plot:
Code
import seaborn as sns
sns.boxplot(df['Age'])
sns.despine()
Output
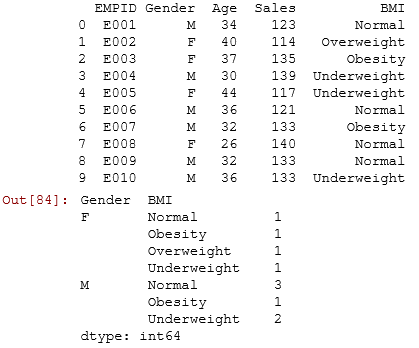
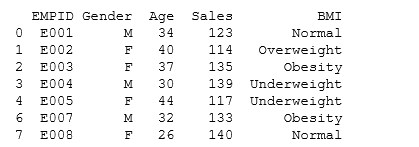
Part 6: How to generate frequency tables with Pandas?
Frequency Tables can be used to understand the distribution of a categorical variable or n categorical variables using frequency tables.
Code
import pandas as pd
df=pd.read_excel("E:/First.xlsx", "Sheet1")
print df
test= df.groupby(['Gender','BMI'])
test.size()
Output
Part 7: How to do sample Data set in Python?
To select sample of a data set, we will use library numpy and random. Sampling of data set always helps to understand data quickly.
Let’s say, from EMP table, I want to select random sample of 5 employees.
Code
#Create Sample dataframe
import numpy as np
import pandas as pd
from random import sample
# create random index
rindex = np.array(sample(xrange(len(df)), 5))
# get 5 random rows from the dataframe df
dfr = df.ix[rindex]
print dfr
Output
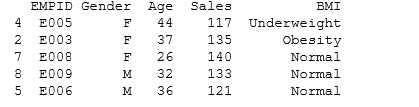
Part 8: How to remove duplicate values of a variable in a Pandas Dataframe?
Often, we encounter duplicate observations. To tackle this in Python, we can use dataframe.drop_duplicates().
Code
#Remove Duplicate Values based on values of variables "Gender" and "BMI"
rem_dup=df.drop_duplicates(['Gender', 'BMI'])
print rem_dup
Output
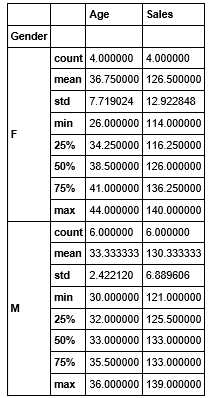
Part 9: How to group variables in Pandas to calculate count, average, sum?
To understand the count, average and sum of variable, I would suggest you use dataframe.describe() with Pandas groupby().
Let’s look at the code:
Code
test= df.groupby(['Gender'])
test.describe()
Output
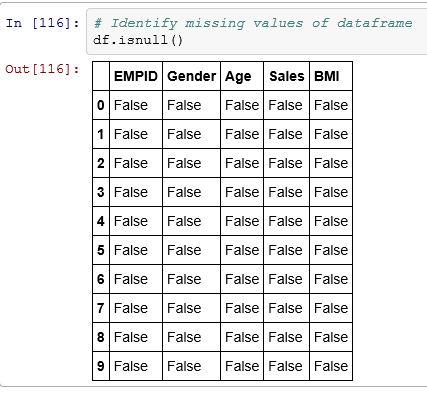
Part 10: How to recognize and Treat missing values and outliers in Pandas?
To identify missing values , we can use dataframe.isnull(). You can also refer article “Data Munging in Python (using Pandas)“, here we have done a case study to recognize and treat missing and outlier values.
Code
# Identify missing values of dataframe
df.isnull()
Output
To treat missing values, there are various imputation methods available. You can refer these articles for methods to detect Outlier and Missing values. Imputation methods for both missing and outlier values are almost similar. Here we will discuss general case imputation methods to replace missing values. Let’s do it using an example:
#Example to impute missing values in Age by the mean
import numpy as np
meanAge = np.mean(df.Age)     #Using numpy mean function to calculate the mean value
df.Age = df.Age.fillna(meanAge) #replacing missing values in the DataFrame
Part 11: How to merge / join data sets and Pandas dataframes?
Joining / merging is one of the common operation required to integrate datasets from different sources. They can be handled effectively in Pandas using merge function:
Code:
df_new = pd.merge(df1, df2, how = 'inner', left_index = True, right_index = True) # merges df1 and df2 on index
# By changing how = 'outer', you can do outer join.
# Similarly how = 'left' will do a left join
# You can also specify the columns to join instead of indexes, which are used by default.
End Notes:
In this comprehensive guide, we looked at the Python codes for various steps in data exploration and munging. We also looked at the python libraries like Pandas, Numpy, Matplotlib and Seaborn to perform these steps. In next article, I will reveal the codes to perform these steps in R.
Also See: If you have any doubts pertaining to Python, feel free to discuss with us.
Did you find the article useful? Do let us know your thoughts about this guide in the comments section below.
If you like what you just read & want to continue your analytics learning, subscribe to our emails, follow us on twitter or like our facebook page.
I am a Business Analytics and Intelligence professional with deep experience in the Indian Insurance industry. I have worked for various multi-national Insurance companies in last 7 years.


Need the same thing/article in R. Please do need full asap. Thanks.
Hi Vikas, Guide for Data Exploration using R is live now. You can access it here http://www.analyticsvidhya.com/blog/2015/04/comprehensive-guide-data-exploration-r/ Thanks
About data imputation... I'm struggling to find methods (read packages / libraries) to carry out imputation in Python beyond the usual mean/ median approach...coming from an R background , there are tonnes of good packages to carry out very sophisticated imputation...this is something I miss in Python (it may be my lack of knowledge). i tried r2py to call imputation packages from R in python but it doesnt run as smoothly do you have suggestions in this regards?
Fantastic article with great examples! Thank you.
Great article. I learned something today. Any books which helps me to do these kind of data analysis?
good article
super
Nice article to start with Python.
Thank you so much. This was very helpful. :)
Nice summary Thank you.
Very Useful, covered all important data manipulation/exploration libraries, very handy.. !
Could you please provide the data sets that can be loaded directly to the code ? It will be really very helpful.
Where can we download the datasets referred to in the examples above? I'd like to replicate the steps exactly first before getting some other sample data. Thanks
AttributeError: 'DataFrame' object has no attribute 'sort'
Hi Anubhaw, Please use dataframe.sort_values().