-
30 Best Data Science Books to Read in 2026
Explore 30 data science books for 2025, covering topics from math to machine learning, perfect for beginners & professionals alike.Read Now!
Aayush Tyagi 06 Jan, 2026
-
Guide to Visual Data Mining using Parallel Coordinates
Master parallel coordinates for visual data mining. Our guide explains how to visualize high-dimensional data, with Python code.
Alec Sproten 04 Sep, 2025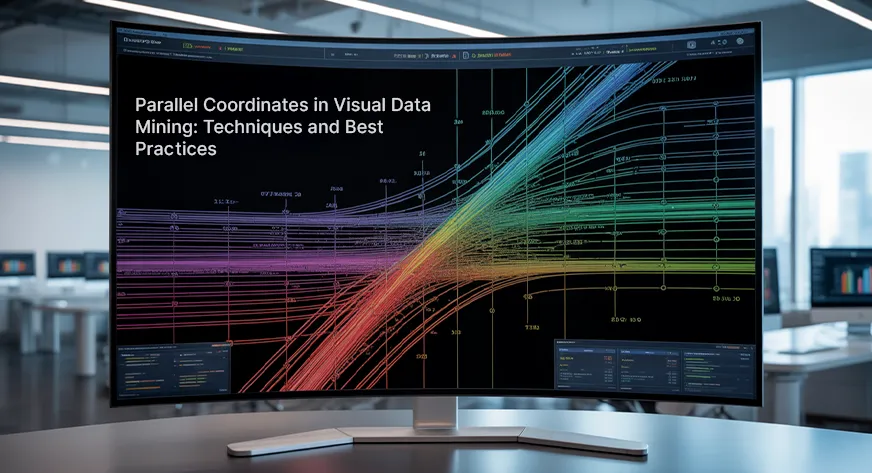
-
9 Steps for Crafting an Interactive Dashboard using Python and Gradio
Learn to create an interactive data dashboard using Python and Gradio. Transform your datasets into powerful web applications.
Harsh Mishra 06 Jul, 2025
-
A Quick Guide to PyLab
Explore PyLab, a powerful Python module combining Matplotlib and NumPy for seamless data visualization and computation.
Kabyik Kayal 20 Mar, 2025
-
20 Examples of Interactive Power BI Dashboards
20 Power BI dashboard examples that showcase the power of data visualization. Gain valuable insights for sales, marketing, HR, and more.
Akash Sharma 01 May, 2025
-
Automate Data Insights with LIDA’s Intelligent Visualization
Explore LIDA, an AI tool automating data visualization, creating infographics to simplify analysis and improve decision-making
Mounish V 12 Oct, 2024
-
Automate Data Insights with InsightMate Using Gemini & LangSmith
Explore data effortlessly with InsightMate: Automate insights and visualizations using Gemini & LangSmith for accuracy.
Katasani Keerthana Reddy 18 Sep, 2024
-
Top 11 YouTube Channels to Learn Tableau
Discover the top 7 YouTube channels to learn Tableau, featuring tutorials for beginners and advanced users in data visualization.
Yana Khare 13 Sep, 2024
-
5 Best YouTube Channels to Learn Statistics for Free
Explore the 5 best YouTube channels to Learn Statistics for Free, offering beginner to advanced content tailored for all.
Ayushi Trivedi 28 Aug, 2024
-
Transforming NLP with Adaptive Prompting and DSPy
Explore how Adaptive Prompting with DSPy enhances NLP interactions, offering dynamic solutions for improved AI responses.
Neil D 28 Aug, 2024
