R is undoubtedly the most popular open source data science tool loved by statisticians and analysts across the globe. It provides one of the best interactive environment for doing statistical analysis, data visualization and predictive modelling.
The language has been supported by thousands of programmers across the world. Recently, New York R Conference held its inaugural version on 24th and 25th April 2015. This conference featured R enthusiasts from across the globe.
What do these talks have to offer?
The videos in these talks go on to reinforce the fact that R has the largest data science community and a thriving ecosystem to offer. From visualizing trends on Ebola virus to using machine learning for recruitment, these talks cover a wide range of topics. These talks tease you enough to get you thinking in these topics and leave you with a flavor of some of the exciting work happening across the globe. Just what you need to create the next multi-billion dollor business idea! So go on and have a look for yourself.

Predictive models & Machine learning related talks:
Hiring by Human / Machine Learning

In this talk, Julie Yoo talks about hiring using machine learning techniques. She discusses the benefits and challenges of using machine learning. It also talks about how machine learning algorithms are efficient and exact for voice & image recognition.
Software Architecture and Predictive Models in R
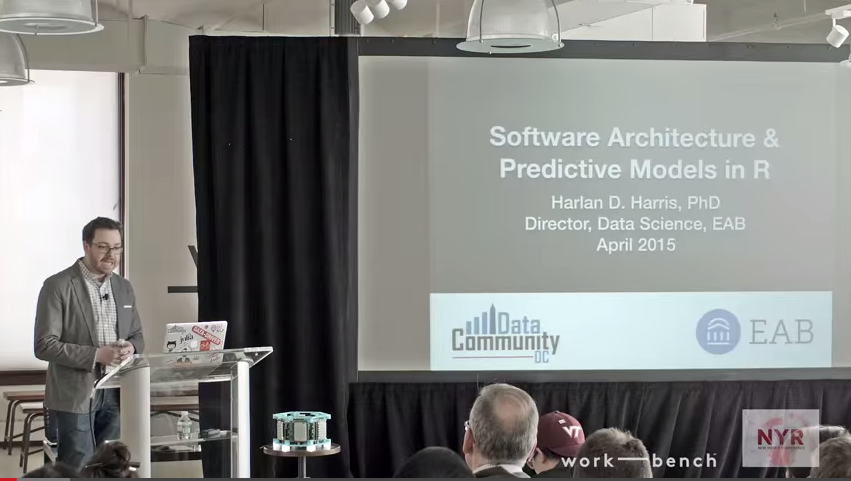
A lot of people have apprehensions in using R for production use. This video talks about software architecture and the questions you need to ask to prepare a better Software Architecture. It also discuss about the role of R in building data related software products.
The Development Process for the Caret Package
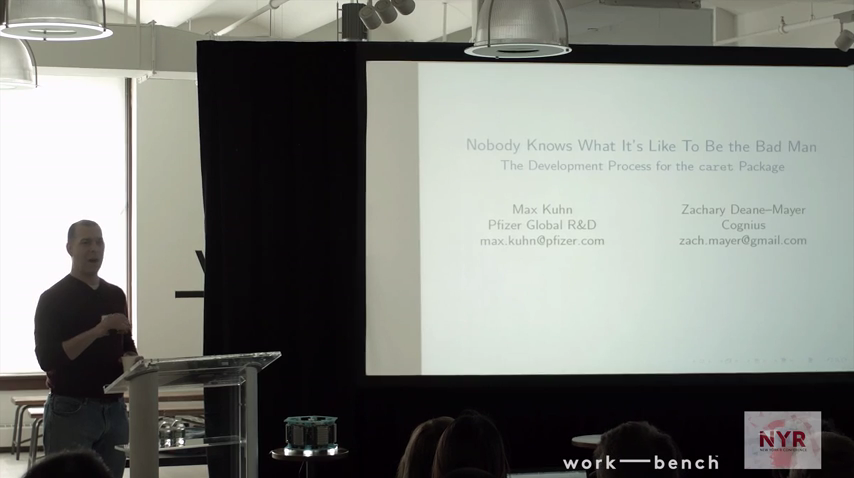
This video talks about the development process, distribution and testing process of Caret package. It gives a good peek into how a package is developed, the testing process, release process and documentation. A must listen talk, if you are planning to build and release your own packages in R at some point in time!
Data Visualization related talks
Dashboarding with Shiny
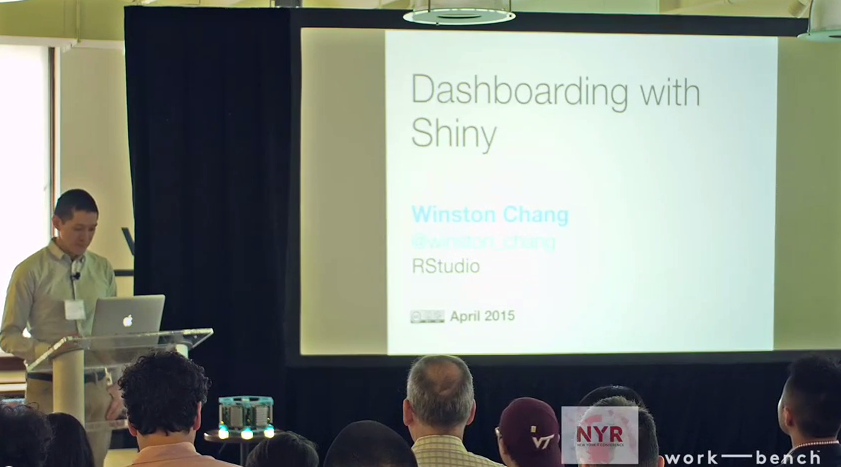
This talk from Winston Chang is about dashboards and how they work. It gives you an introduction to shiny dashboards and R package for creating dashboard style layouts with shiny. It also talks about leafletjs: javascript library for creating interactive maps and use of Leaflet in shiny dashboard. In the second half of the video, it also gives you a tour of shiny dashboard having an interactive map visualization.
Interactive Plots in Shiny using R
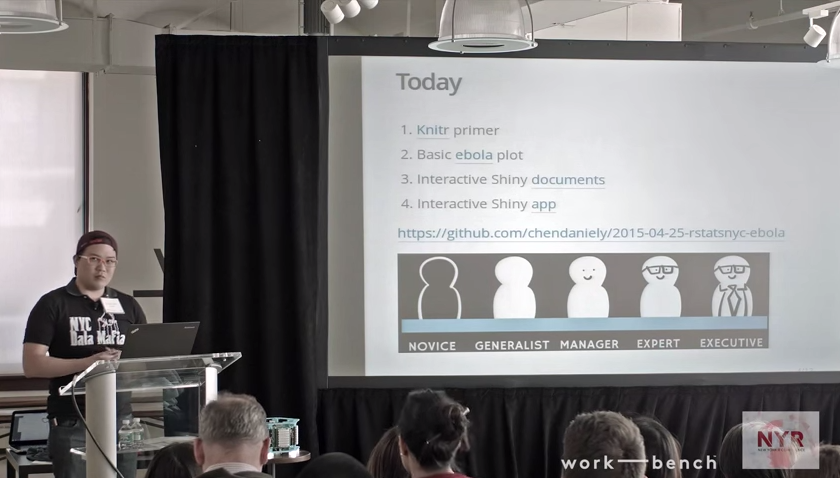
Shiny is an elegant and powerful web framework for building interactive reports and visualizations using R — with or without web development skills. In this talk, a brief demonstration has been given on Shiny using R to plot Ebola data & make it interactive.
Storytelling with Data Visualizations
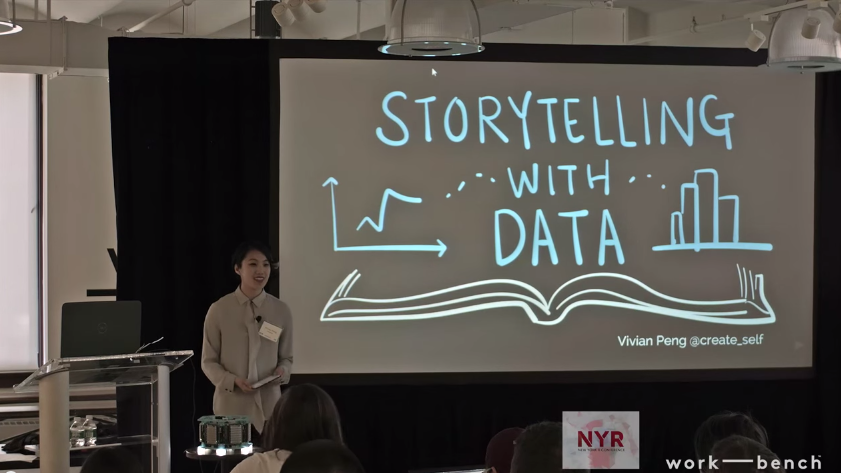
In this talk, Vivian explains how storytelling using data visualization helps to generate insights from the data. She also talks about problems with data visualization, seam story design and discusses these with some examples. She has categorized data visualization process into four categories and talks around these (conception, data collection, Data Analysis and after that visualization).
Visual NYC
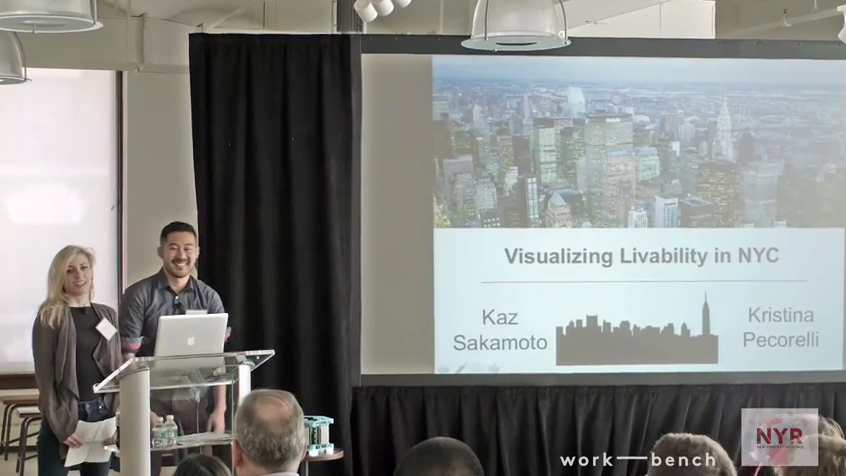
If the previous talks looked like a bit of theory, here is an application. In this video, Kaz & Kristine use visualization (Shiny dashboard and leaflet) to show the rented house affordability in the city New York. They are illustrating the power of visualization to generate actionable insights.
Big Data related talks:
How Data Science is helping Influence the way Big Retailers Work
Delivered by Karen Moon, this talk showcases how small start-ups and companies are using Data Science to create a disruption in large traditional markets. This video, in particular shows how her company is using Data Science and R to predict clothing trends before they hit the masses.
Practical Principles for Scalable Statistical Analysis

With increased data generation and cheap storage options, the need for scalable statistical analysis is obvious, but the solutions are not. This talk addresses this pain point directly. Delivered by Michael Kane, this talk tells about different libraries and packages in R and Python which can be used to scale Data Exploration practically. He uses these methods to improve the performance and handle large amount of data.
Leveraging R, Hadoop in Analyzing Multiple Myeloma Patient Timelines
Delivered by Saar Golde, Chief Data Scientist of Knowledgent, this video starts with talking about Big Data in Pharma Research and the challenges faced in Analyzing Real World Evidences. It then points to some solutions for the same using Hadoop and MapReduce technologies.
Making R Go Faster and Bigger
This video talks about Big Data and challenges which come with it like storing, processing and computing. The speaker also talks about efficient techniques and functions in R to deal with big data calculations and how you can enhance the performance.
Other talks:
DataFrames: The Good, Bad, and Ugly
How can a conference on R not talk about DataFrames? And who better to talk about it than Wes McKinney (Father of Pandas in Python). Wes briefly talks about data frame interfaces, biased information judgments and thoughts on crafting high quality data tools. He also talks about pandas, spark and Julia data frames.
Reproducible Data Analysis with Revolution R Open
In this video, Joseph Rickert talks about reproducible data analysis and packages of past using library checkpoint. He also talks about how this library helps you to solve the problem of different versions of packages. When you share your scripts with others it using this library, it automatically installs the necessary packages. This checkpoint library only works with CRAN packages.
R for every survey analysis
In this talk, Max Richman tells about his learnings from moving young surveyors from commercial software like SAS and SPSS to R (or python) i.e. FOSSS (Fresh and open source software). Max talks about real world situations like variable recoding & statitistical weighing and how R provides an ease in handling data.
End Notes
So, these were some R-related talks in inaugural version of New York R Conference. The idea of a conference in this fashion is definitely exciting and so were the talks. If you have seen PyCon workshops and talks, you might feel that the talks are not as hands on and technical as PyCons, but this was just the inaugural version. Also, the talks were aimed to be high level to cover the breadth of offerings R has to offer. It would be interesting to see how it pans out next year!
We hope you enjoyed and learned watching them. Do let us know your thoughts and views in the comments section below. We would love to talk with you !


Where can i find video links for these? do we have Youtube channel for the same?