Overview
- Get an introduction to logistic regression using R and Python
- Logistic Regression is a popular classification algorithm used to predict a binary outcome
- There are various metrics to evaluate a logistic regression model such as confusion matrix, AUC-ROC curve, etc
Introduction
Every machine learning algorithm works best under a given set of conditions. Making sure your algorithm fits the assumptions/requirements ensures superior performance. You can’t use any algorithm in any condition. For example: Have you ever tried using linear regression on a categorical dependent variable? Don’t even try! Because you won’t be appreciated for getting extremely low values of adjusted R² and F statistic.
Instead, in such situations, you should try using algorithms such as Logistic Regression, Decision Trees, SVM, Random Forest etc. To get a quick overview of these algorithms, I’ll recommend reading – Essentials of Machine Learning Algorithms.
With this post, I give you useful knowledge on Multinomial Logistic Regression in R. After you’ve mastered linear regression, this comes as the natural following step in your journey. It’s also easy to learn and implement, but you must know the science behind this algorithm.
I’ve tried to explain these concepts in the simplest possible manner. Let’s get started.
Project to apply Logistic RegressionProblem StatementHR analytics is revolutionizing the way human resources departments operate, leading to higher efficiency and better results overall. Human resources have been using analytics for years. However, the collection, processing, and analysis of data have been largely manual, and given the nature of human resources dynamics and HR KPIs, the approach has been constraining HR. Therefore, it is surprising that HR departments woke up to the utility of machine learning so late in the game. Here is an opportunity to try predictive analytics in identifying the employees most likely to get promoted. |
What is Logistic Regression?
Logistic Regression is a classification algorithm. It is used to predict a binary outcome (1 / 0, Yes / No, True / False) given a set of independent variables. To represent binary/categorical outcome, we use dummy variables. You can also think of logistic regression as a special case of linear regression when the outcome variable is categorical, where we are using log of odds as dependent variable. In simple words, it predicts the probability of occurrence of an event by fitting data to a logit function.
Derivation of Logistic Regression Equation
Logistic Regression is part of a larger class of algorithms known as Generalized Linear Model (glm). In 1972, Nelder and Wedderburn proposed this model with an effort to provide a means of using linear regression to the problems which were not directly suited for application of linear regression. Infact, they proposed a class of different models (linear regression, ANOVA, Poisson Regression etc) which included logistic regression as a special case.
The fundamental equation of generalized linear model is:
g(E(y)) = α + βx1 + γx2
Here, g() is the link function, E(y) is the expectation of target variable and α + βx1 + γx2 is the linear predictor ( α,β,γ to be predicted). The role of link function is to ‘link’ the expectation of y to linear predictor.
Important Points
- GLM does not assume a linear relationship between dependent and independent variables. However, it assumes a linear relationship between link function and independent variables in logit model.
- The dependent variable need not to be normally distributed.
- It does not uses OLS (Ordinary Least Square) for parameter estimation. Instead, it uses maximum likelihood estimation (MLE).
- Errors need to be independent but not normally distributed.
Let’s understand it further using an example:
We are provided a sample of 1000 customers. We need to predict the probability whether a customer will buy (y) a particular magazine or not. As you can see, we’ve a categorical outcome variable, we’ll use logistic regression. Vidalista 20 https://tyackdentalgroup.com/vidalista
To start with logistic regression, I’ll first write the simple linear regression equation with dependent variable enclosed in a link function:
g(y) = βo + β(Age) ---- (a)
Note: For ease of understanding, I’ve considered ‘Age’ as independent variable.
In logistic regression coefficients, we are only concerned about the probability of outcome dependent variable ( success or failure). As described above, g() is the link function. This function is established using two things: Probability of Success(p) and Probability of Failure(1-p). p should meet following criteria:
- It must always be positive (since p >= 0)
- It must always be less than equals to 1 (since p <= 1)
Now, we’ll simply satisfy these 2 conditions and get to the core of logistic regression. To establish link function, we’ll denote g() with ‘p’ initially and eventually end up deriving this function.
Since probability must always be positive, we’ll put the linear equation in exponential form. For any value of slope and dependent variable, exponent of this equation will never be negative.
p = exp(βo + β(Age)) = e^(βo + β(Age)) ------- (b)
To make the probability less than 1, we must divide p by a number greater than p. This can simply be done by:
p = exp(βo + β(Age)) / exp(βo + β(Age)) + 1 = e^(βo + β(Age)) / e^(βo + β(Age)) + 1 ----- (c)
Using (a), (b) and (c), we can redefine the probability as:
p = e^y/ 1 + e^y --- (d)
where p is the probability of success. This (d) is the Logit Function
If p is the probability of success, 1-p will be the probability of failure which can be written as:
q = 1 - p = 1 - (e^y/ 1 + e^y) --- (e)
where q is the probability of failure
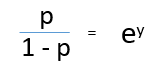
On dividing, (d) / (e), we get,
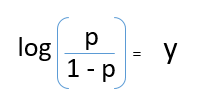
After taking log on both side, we get,
log(p/1-p) is the link function. Logarithmic transformation on the outcome variable allows us to model a non-linear association in a linear way.
After substituting value of y, we’ll get:
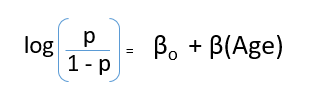
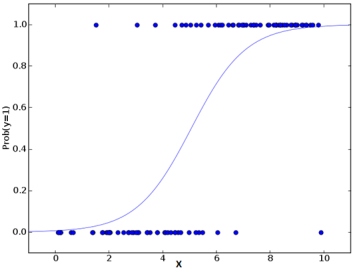
This is the equation used in Logistic Regression. Here (p/1-p) is the odd ratio. Whenever the log of odd ratio is found to be positive, the probability of success is always more than 50%. A typical logistic model plot is shown below. You can see probability never goes below 0 and above 1.
Generalized Linear Model of Regression
In the Generalized Linear Model (GLM) of regression, the dispersion parameter, logistic function, and linear combination play pivotal roles in analyzing relationships between dependent and independent variables. This statistical methodology expands upon traditional linear regression by accommodating various response variable distributions, including continuous, binary, count, and categorical data.
The GLM framework consists of three essential components:
- Random component: This component defines the probability distribution governing the response variable, tailored to match the characteristics of the data being analyzed. Common distributions include the normal distribution for continuous data, binomial for binary data, Poisson for count data, and multinomial for categorical data.
- Systematic component: This part of the model describes how the mean of the response variable depends on the predictor variables. It often takes the form of a linear combination of the predictors, with coefficients that need to be estimated.
- Link function: Acting as a link between the systematic and random components, the link function explains the relationship between the linear predictor (derived from the systematic component) and the expected value of the response variable. Popular link functions include the identity, logit, probit, and log functions.
GLMs provide a flexible and robust analytical framework, widely applicable across various fields such as epidemiology, biology, economics, and social sciences. Their ability to handle different data types and model non-normal distributions makes them indispensable tools for empirical research and data analysis.
Performance of Logistic Regression Model
To evaluate the performance of a logistic regression model, we must consider few metrics. Irrespective of tool (SAS, R, Python) you would work on, always look for:
1. AIC (Akaike Information Criteria) – The analogous metric of adjusted R² in logistic regression is AIC. AIC is the measure of fit which penalizes model for the number of model coefficients. Therefore, we always prefer model with minimum AIC value.
2. Null Deviance and Residual Deviance – Null Deviance indicates the response predicted by a model with nothing but an intercept. Lower the value, better the model. Residual deviance indicates the response predicted by a model on adding independent variables. Lower the value, better the model.
3. Confusion Matrix: It is nothing but a tabular representation of Actual vs Predicted values. This helps us to find the accuracy of the model and avoid overfitting. This is how it looks like:
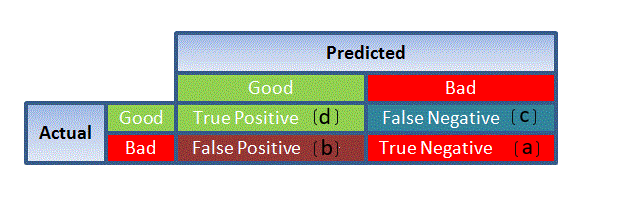
Source: (plug – n – score)
You can calculate the accuracy of your model with:

From confusion matrix, Specificity and Sensitivity can be derived as illustrated below:
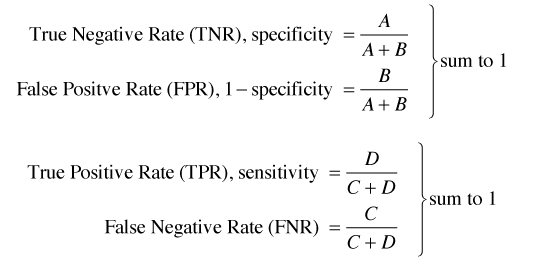
Specificity and Sensitivity plays a crucial role in deriving ROC curve.
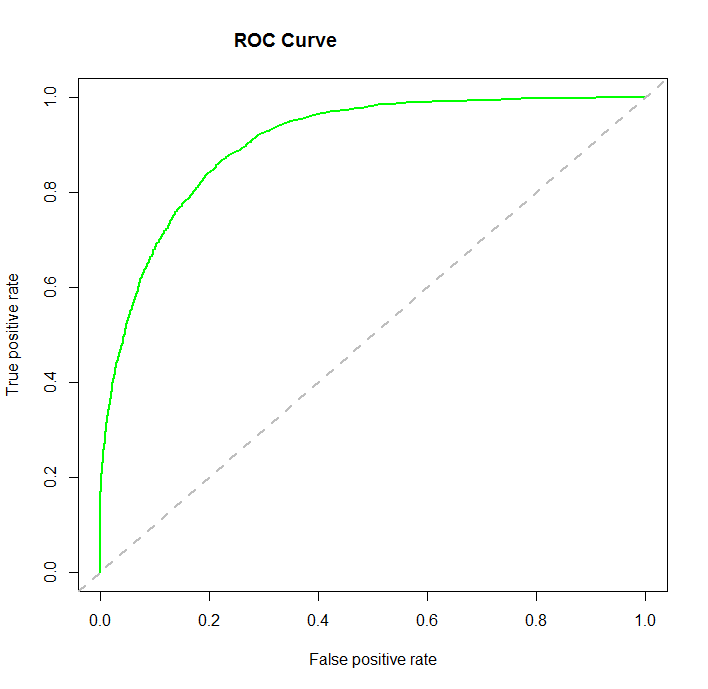
4. ROC Curve: Receiver Operating Characteristic(ROC) summarizes the model’s performance by evaluating the trade offs between true positive rate (sensitivity) and false positive rate(1- specificity). For plotting ROC, it is advisable to assume p > 0.5 since we are more concerned about success rate. ROC summarizes the predictive power for all possible values of p > 0.5. The area under curve (AUC), referred to as index of accuracy(A) or concordance index, is a perfect performance metric for ROC curve. Higher the area under curve, better the prediction power of the model. Below is a sample ROC curve. The ROC of a perfect predictive model has TP equals 1 and FP equals 0. This curve will touch the top left corner of the graph.
Note: For model performance, you can also consider likelihood function. It is called so, because it selects the coefficient values which maximizes the likelihood of explaining the observed data. It indicates goodness of fit as its value approaches one, and a poor fit of the data as its value approaches zero.
Logistic Regression Model in R and Python
The R code is provided below but if you’re a Python user, here’s an awesome code window to build your logistic regression model. No need to open Jupyter – you can do it all here:
# importing required libraries
import pandas as pd
from sklearn.linear_model import LogisticRegression
from sklearn.metrics import accuracy_score

# read the train and test dataset
train_data = pd.read_csv('train-data.csv')
test_data = pd.read_csv('test-data.csv')


print(train_data.head())

# shape of the dataset
print('Shape of training data :',train_data.shape)
print('Shape of testing data :',test_data.shape)

# Now, we need to predict the missing target variable in the test data
# target variable - Survived

# seperate the independent and target variable on training data
train_x = train_data.drop(columns=['Survived'],axis=1)
train_y = train_data['Survived']

# seperate the independent and target variable on testing data
test_x = test_data.drop(columns=['Survived'],axis=1)
test_y = test_data['Survived']

'''
Create the object of the Logistic Regression model
You can also add other parameters and test your code here
Some parameters are : fit_intercept and penalty
Documentation of sklearn LogisticRegression:

https://scikit-learn.org/stable/modules/generated/sklearn.linear_model.LogisticRegression.html

 '''
model = LogisticRegression()

# fit the model with the training data
model.fit(train_x,train_y)

# coefficeints of the trained model
print('Coefficient of model :', model.coef_)

# intercept of the model
print('Intercept of model',model.intercept_)

# predict the target on the train dataset
predict_train = model.predict(train_x)
print('Target on train data',predict_train)

# Accuray Score on train dataset
accuracy_train = accuracy_score(train_y,predict_train)
print('accuracy_score on train dataset : ', accuracy_train)

# predict the target on the test dataset
predict_test = model.predict(test_x)
print('Target on test data',predict_test)

# Accuracy Score on test dataset
accuracy_test = accuracy_score(test_y,predict_test)
print('accuracy_score on test dataset : ', accuracy_test)
Considering the availability, I’ve built this model on our practice problem – Dressify data set. You can download it here.
Without going deep into feature engineering, here’s the script of simple logistic regression model:
setwd('C:/Users/manish/Desktop/dressdata')
#load data
train <- read.csv('Train_Old.csv')
#create training and validation data from given data
install.packages('caTools')
library(caTools)
set.seed(88)
split <- sample.split(train$Recommended, SplitRatio = 0.75)
#get training and test data
dresstrain <- subset(train, split == TRUE)
dresstest <- subset(train, split == FALSE)
#logistic regression model
model <- glm (Recommended ~ .-ID, data = dresstrain, family = binomial)
summary(model)
predict <- predict(model, type = 'response')
#confusion matrix
table(dresstrain$Recommended, predict > 0.5)
#ROCR Curve
library(ROCR)
ROCRpred <- prediction(predict, dresstrain$Recommended)
ROCRperf <- performance(ROCRpred, 'tpr','fpr')
plot(ROCRperf, colorize = TRUE, text.adj = c(-0.2,1.7))#plot glm
library(ggplot2)
ggplot(dresstrain, aes(x=Rating, y=Recommended)) + geom_point() +
stat_smooth(method="glm", family="binomial", se=FALSE)This data require lots of cleaning and feature engineering. The scope of this article restricted me to keep the example focused on building logistic regression model. This data is available for practice. I’d recommend you to work on this problem. There’s a lot to learn.
End Notes
By now, you would know the science behind logistic regression. I’ve seen many times that people know the use of this algorithm without actually having knowledge about its core concepts. I’ve tried my best to explain this part in simplest possible manner. The example above only shows the skeleton of using logistic regression in R. Before actually approaching to this stage, you must invest your crucial time in feature engineering.
Furthermore, I’d recommend you to work on this problem set. You’d explore things which you might haven’t faced before.
Did I miss out on anything important ? Did you find this article helpful? Please share your opinions / thoughts in the comments section below.
Frequently Asked Questions
Q1. Which R library used for logistic regression?
The Logistic Regression package is used for the modelling of statistical regression: base-R and tidy-models in R. Basic R workflow models are simpler and include functions such as summary and glm() to adjust the models and provide the model overview.
Q2.What is the difference between linear and logistic regression in R?
Differentiation of linear regressions from logistical regressions. Linear regression is used in solving regression problems, while linear regression can solve classification issues. Linear regression produces constant data output while logistic regression delivers discrete data.
Q3.What is R logistic?
R Logistic regression is a basic algorithm in statistics used widely in machine learning. It has never been used to develop SOTA models and it serves as a good base to solve binary classification problems. 14 July 2020. I’d like to see it.
Q4.What is the 3 parameter logistic regression?
The three-parameter logistic regression (3PL) is a generalized linear models used in testing and surveys to predict the likelihood of a correct response to a question. Its parameters include discrimination, difficulty, and guessing. It estimates the probability of a correct answer based on the individual’s skill level, akin to linear regression model and binary logistic regression.


Very nice article but the figure of confusion matrix does not match with the specificity/sensitivity formulas. Should change to TNR = D/C+D ; TPR = A/A+B
Hello Thanh Le I too just noticed that. Have made the change. Thank you
Hi Manish, Awesome Article; In this case in the training dataset the deviance are as follows: Null deviance: 366.42 on 269 degrees of freedom Residual deviance: 143.20 on 140 degrees of freedom AIC: 403.2 And the minimum AIC is the better the model is going to be that we know; Can you suggest some way to say whether this AIC is good enough and how do we justify that there will not be any good possible model having lower AIC; And also I want to know some more details about this criterion to check the model; Number of Fisher Scoring iterations: 18
Hi Prakash Thanks for your appreciation. Kudos to my team indeed. You should not consider AIC criterion in isolation. Like, you've run this model and got some AIC value. You must be thinking, what to do next? You can't do anything unless you build another model and then compare their AIC values. Model with lower AIC should be your choice. Always. Number of Fisher Scoring iterations is a derivative of Newton-Raphson algorithm which proposes how the model was estimated. In your case, it can be interpreted as, Fisher scoring algorithm took 18 iterations to perform the fit. This metric doesn't tell you anything which you must know. It just confirms the model convergence. That's it.
Manish, I am working on a project where I am building a model on transaction-wise data; there are some 5000 customer and among them 1200 churned till data; and total transaction is 4.5 Lacs out of that 1 lacs is for the churned and rest is for non churned; Now i am trying to build the model marking those 1 Lacs as 1 and rest all as 0; and took some sample of that; say of 120000 rows; here 35 K rows have marked as 1 and rest all 0; the ratio > 15% so we can go for logistic; (as i know) now when i built the model transaction wise this accuracy from confusion matrix is coming as 76% and when we applt the model in the entire dataset, and aggregated customerwise by doing customerwise averaging the predicted transaction probabilities; and in this case out of 5000 customer, A1P1=950, A1P0=250, A0P0= 3600, A0P1=200 and hence accuracy is 91%; do u think i can feel that this model is pretty good?? in this case i made 5-6 models and the minimum AIC and corresponding tests gave me the confidence to select this model; Please share ur views and hope I am able to convey you my words; https://in.linkedin.com/in/prakashmathsiitg