Introduction
Categorical variables are known to hide and mask lots of interesting information in a data set. It’s crucial to learn the methods of dealing with such variables. If you won’t, many a times, you’d miss out on finding the most important variables in a model. It has happened with me. Initially, I used to focus more on numerical variables. Hence, never actually got an accurate model. But, later I discovered my flaws and learnt the art of dealing with such variables.
If you are a smart data scientist, you’d hunt down the categorical variables in the data set, and dig out as much information as you can. Right? But if you are a beginner, you might not know the smart ways to tackle such situations. Don’t worry. I am here to help you out.
After receiving a lot of requests on this topic, I decided to write down a clear approach to help you improve your models using categorical variables.
Note: This article is best written for beginners and newly turned predictive modelers. If you are an expert, you are welcome to share some useful tips of dealing with categorical variables in the comments section below.

What are the key challenges with categorical variable?
I’ve had nasty experience dealing with categorical variables. I remember working on a data set, where it took me more than 2 days just to understand the science of categorical variables. I’ve faced many such instances where error messages didn’t let me move forward. Even, my proven methods didn’t improve the situation.
But during this process, I learnt how to solve these challenges. I’d like to share all the challenges I faced while dealing with categorical variables. You’d find:
- A categorical variable has too many levels. This pulls down performance level of the model. For example, a cat. variable “zip code” would have numerous levels.
- A categorical variable has levels which rarely occur. Many of these levels have minimal chance of making a real impact on model fit. For example, a variable ‘disease’ might have some levels which would rarely occur.
- There is one level which always occurs i.e. for most of the observations in data set there is only one level. Variables with such levels fail to make a positive impact on model performance due to very low variation.
- If the categorical variable is masked, it becomes a laborious task to decipher its meaning. Such situations are commonly found in data science competitions.
- You can’t fit categorical variables into a regression equation in their raw form. They must be treated.
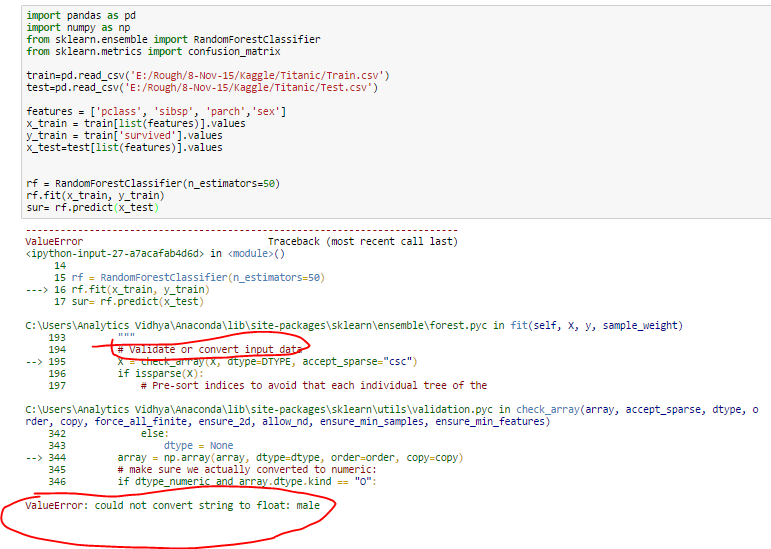
- Most of the algorithms (or ML libraries) produce better result with numerical variable. In python, library “sklearn” requires features in numerical arrays. Look at the below snapshot. I have applied random forest using sklearn library on titanic data set (only two features sex and pclass are taken as independent variables). It has returned an error because feature “sex” is categorical and has not been converted to numerical form.
Python Code:
Proven methods to deal with Categorical Variables
Here are some methods I used to deal with categorical variable(s). A trick to get good result from these methods is ‘Iterations’. You must know that all these methods may not improve results in all scenarios, but we should iterate our modeling process with different techniques. Later, evaluate the model performance. Below are the methods:
Convert to Number
- Convert to number: As discussed above, some ML libraries do not take categorical variables as input. Thus, we convert them into numerical variables. Below are the methods to convert a categorical (string) input to numerical nature:
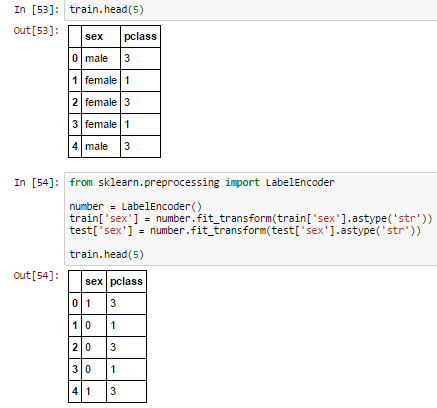
- Label Encoder: It is used to transform non-numerical labels to numerical labels (or nominal categorical variables). Numerical labels are always between 0 and n_classes-1.
 A common challenge with nominal categorical variable is that, it may decrease performance of a model. For example: We have two features “age” (range: 0-80) and “city” (81 different levels). Now, when we’ll apply label encoder to ‘city’ variable, it will represent ‘city’ with numeric values range from 0 to 80. The ‘city’ variable is now similar to ‘age’ variable since both will have similar data points, which is certainly not a right approach.
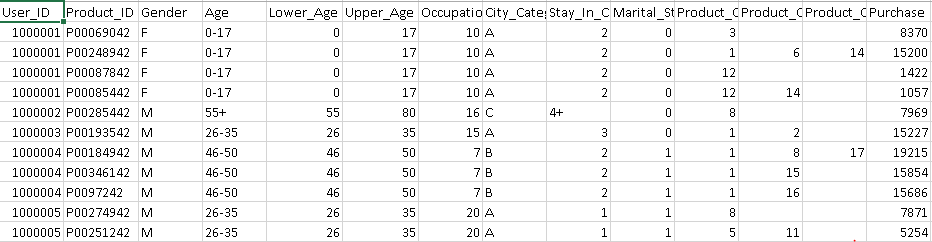
 - Convert numeric bins to number: Let’s say, bins of a continuous variable are available in the data set (shown below).
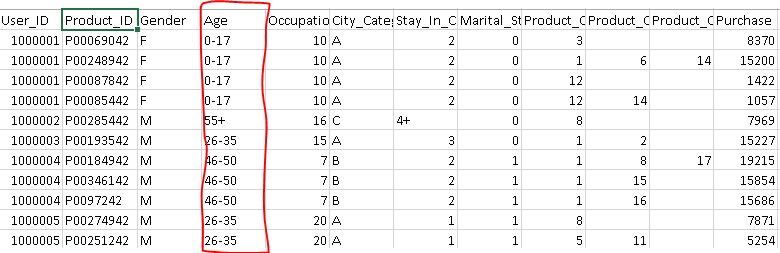 Above, you can see that variable “Age” has bins (0-17, 17-25, 26-35 …). We can convert these bins into definite numbers using the following methods:
- Label Encoder: It is used to transform non-numerical labels to numerical labels (or nominal categorical variables). Numerical labels are always between 0 and n_classes-1.
-
-
- Using label encoder for conversion. But, these numerical bins will be treated same as multiple levels of non-numeric feature. Hence, wouldn’t provide any additional information
- Create a new feature using mean or mode (most relevant value) of each age bucket. It would comprise of additional weight for levels.
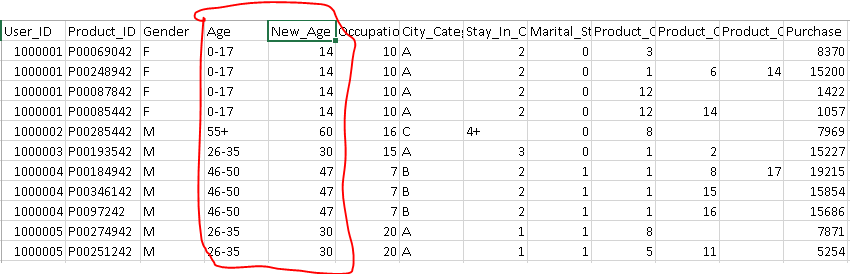
- Create two new features, one for lower bound of age and another for upper bound. In this method, we’ll obtain more information about these numerical bins compare to earlier two methods.
-
Combine Levels
- Combine levels: To avoid redundant levels in a categorical variable and to deal with rare levels, we can simply combine the different levels. There are various methods of combining levels. Here are commonly used ones:
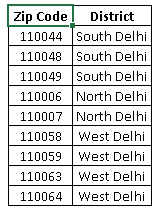
- Using Business Logic: It is one of the most effective method of combining levels. It makes sense also to combine similar levels into similar groups based on domain or business experience. For example, we can combine levels of a variable “zip code” at state or district level. This will reduce the number of levels and improve the model performance also.
- Using frequency or response rate: Combining levels based on business logic is effective but we may always not have the domain knowledge. Imagine, you are given a data set from Aerospace Department, US Govt. How would you apply business logic here? In such cases, we combine levels by considering the frequency distribution or response rate.
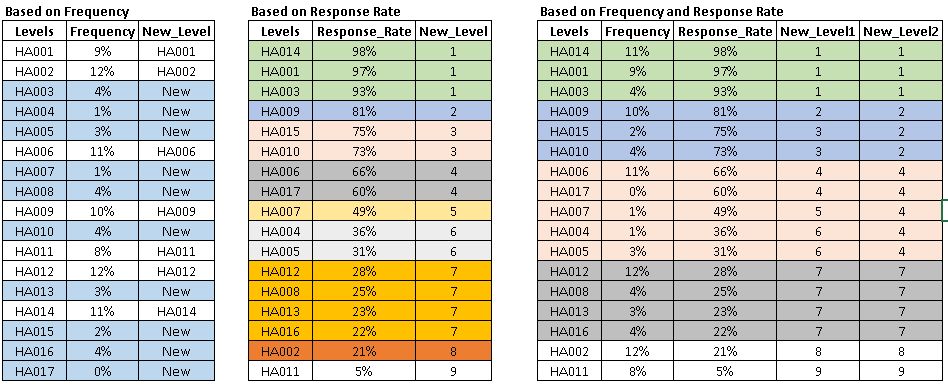
- To combine levels using their frequency, we first look at the frequency distribution of of each level and combine levels having frequency less than 5% of total observation (5% is standard but you can change it based on distribution). This is an effective method to deal with rare levels.
- We can also combine levels by considering the response rate of each level. We can simply combine levels having similar response rate into same group.
- Finally, you can also look at both frequency and response rate to combine levels. You first combine levels based on response rate then combine rare levels to relevant group.
- Using Business Logic: It is one of the most effective method of combining levels. It makes sense also to combine similar levels into similar groups based on domain or business experience. For example, we can combine levels of a variable “zip code” at state or district level. This will reduce the number of levels and improve the model performance also.
Dummy Coding
- Dummy Coding: Dummy coding is a commonly used method for converting a categorical input variable into continuous variable. ‘Dummy’, as the name suggests is a duplicate variable which represents one level of a categorical variable. Presence of a level is represent by 1 and absence is represented by 0. For every level present, one dummy variable will be created. Look at the representation below to convert a categorical variable using dummy variable.
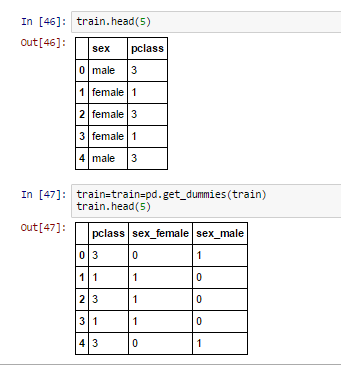 Note: Assume, we have 500 levels in categorical variables. Then, should we create 500 dummy variables? If you can automate it, very well. Or else, I’d suggest you to first, reduce the levels by using combining methods and then use dummy coding. This would save your time.This method is also known as “One Hot Encoding“.
End Notes
In this article, we discussed the challenges you might face while dealing with categorical variable in modelling. We also discussed various methods to overcome those challenge and improve model performance. I’ve used Python for demonstration purpose and kept the focus of article for beginners.
In order to keep article simple and focused towards beginners, I have not described advanced methods like “feature hashing”. I will take it up as a separate article in itself in future.
You must understand that these methods are subject to the data sets in question. I’ve seen even the most powerful methods failing to bring model improvement. Whereas, a basic approach can do wonders. Hence, you must understand the validity of these models in context to your data set. If you still face any trouble, I shall help you out in comments section below.
Did you find this article helpful ? Do you know of other methods which work well with categorical variables? Please share your thoughts in the comments section below. I’d love to hear you.
If you like what you just read & want to continue your analytics learning, subscribe to our emails, follow us on twitter or like our facebook page.
Sunil Ray
16 Jun, 2022
I am a Business Analytics and Intelligence professional with deep experience in the Indian Insurance industry. I have worked for various multi-national Insurance companies in last 7 years.


Sunil, Thanks for sharing your thoughts and experience on how to treat Categorical Variables in a dataset! Can you elaborate more on combining levels based on Response Rate and Frequnecy Distribution? Or any pointers is highly appreciated. Thanks!
I would also appreciate the answer to this question. What do you mean by "response rate' in this context?
Hi Sunil, Thank you for great article. Can you explain how to calculate response rate or what does response rate mean ?. I tried googling but I am unable to relate to this particular data science context.
Please elaborate more on response rate ?
For dummy variables, you need n-1 variables. So for Sex, only one variable with 1 for male and O for female will do.
Hi Sunil, A very informative one, Thanks for sharing. Kindly consider doing the same exercise with an example data set.
Hi, Really Nice article...I would be happy if you explain advanced method also... Thanks
Thanks Veera for comment! I would definitely discuss feature hashing and other advance method in future article. Regards, Sunil
Thanks for the article, was very insightful. Please will you provide more information on calculating the response rate.
Hi Sunil, Well explained but combination based on both frequency and response rate to combine levels do not seems to be logical since it combines low frequency value with high response rate and high frequency and high response rate into same group.
Ashutosh, Thanks! Best way to combine levels of categorical variable is business logic but when you don't have any business logic then we should try different methods and analyse the model performance. It may possible that both masked levels (low and high frequency with similar response rate) are actually representing similar levels. Hope this helps! Regards, Sunil
Hi Sunil Thanks for the Great article! Could you pls explain what is the need to create level 2 in the above data set, how it's differ from level 1 Thanks
Very nice article, I wasn't familiar with the dummy-coding option, thank you! I would like to add that when dealing with a high-dimensional cat. variable, visualization might be insightfull. Converting the variable's levels to numericals and then plotting it can help you visually detect clusters in the variable. In this case, standard dimensionality reduction techniques such as k-means or PCA can be used to reduce levels while still maintaining most of the information (variance).
Hi Sunil thanks for great article because I asked it in forum but didnt get appropriate answer until now but this article solve it completely in concept view but: further to Neehar question I have another question how to create new_level2 in picture? I mean how you combine 2 and 3 but not for example 4
Thanks Hossein, I have combined level 2 and 3 based on similar response rate as level 3 frequency is very low. Hope this helps! Regards, Sunil
Hi All, Thanks for comment! Coming to "Response rate", it can be represented by following equation: Response rate = Positive response / Total Count. Refer below link to see the calculation: http://www.evernote.com/l/Ai1ji6YV4XVL_qXZrN5dVAg6_tFkl_YrWxQ/ Hope this helps! Regards, Sunil
Hi Sunil. Thank you for this helpful overview. I hope you can clarify my question on the challenge faced in label encoding. I can understand this, if for some reason the Age and City variables are highly correlated, but in most cases why would the fact they are similar ranges prevent them from being helpful?
I didn't understand on what basis which ranked the new level 2.Could you please explain?
Another question, assume that we have a categorical variable which has one million levels, obviously it's not a smart choice to create one million dummy variables. As suggested in your post, we should reduce the levels of the categorical variable before representing it as dummy variable, Don't you think that it could be a huge loss of information since we combine 1000,000 levels into a relatively small number,e.g.20, of levels? Is there any specific way to handle with that? Or maybe we can apply algorithms like naive Bayes instead of treating the categorical variable as numerical variable? Combining 500 levels into 20 levels may be acceptable, but how about combing 1000.000 levels into 20 levels?
Hi Suni, Thanks for the article. Could you help by providing the code in R language which will do this categorization? Because doing same in excel for large data set would be very difficult.
Hello, Please help with this question if i have a factor that has string levels eg > (perf$internet) [1] no yes yes yes no yes yes no yes yes yes yes yes yes yes yes yes no yes Levels: no yes do i need to change it to numeric levels ie Levels: 1 2 before i can use it to perform analysis or i can go ahead with the default level?
Hi Sunil, I have more than 800 cities, Day of the Week and Hours as one of the features. Target feature is also categorical (nominal 5 categories ). Can you please help to solve the categorical conversion problem.
Thanks for the article Sunil. When it comes to the advanced techniques, Do you recommend Unary coding or Unary representation should be used in a way to convert categorical variables into vectors?
Hello Sunil, thanks for sharing this knowledge, very useful to me at this moment, best regards
Hii Sunil . ..Nice article ... how to deal with features like Product_id or User_id ?????
Hey - you can find count features for IDs, find groups of IDs with similar behavior or combine a different feature on the basis of IDs
thanks for the great and educational blog specially the part about Using frequency or response rate attracted my attention. iam dealing with data where most of the features are categorical. feature x1 has 1080 categories feature x2 has 560 categories feature x3 has 280 categories and so on about 10 of them are categoric. i am thing of the Using frequency or response rate encoding but i have no experience on the frequency encoding. i wish you can make it a bit detailed and if you can show it in python implementation. specially i am more concerned once it is encoded it that way, will to work perfectly for testing and validating data. i hope that you share a new blog with practical example. tnaks
Hi Sunil For example: We have two features “age” (range: 0-80) and “city” (81 different levels). Now, when we’ll apply label encoder to ‘city’ variable, it will represent ‘city’ with numeric values range from 0 to 80. The ‘city’ variable is now similar to ‘age’ variable since both will have similar data points, which is certainly not a right approach. Can u elaborate this please, I didn't understand why this is certainly not a right approach
Hi Anudeep, Age is a variable where you have a particular order. So you can say that a person with age 20 is young while a person of age 80 is old. Unlike age, cities do not have an order. Performing label encoding, will assign numbers to the cities which is not the correct approach.
Hello Sunil, I have combined many levels of my categorical variables to form new values of a column. But my question is that, should we perform this step on both training and test dataset? Because if you perform it only on training dataset then the test column will have the same old multiple levels. Could you please guide me on this ?