Python is fast becoming the preferred language in data science – and for good reason(s). It provides the larger ecosystem of a programming language and the depth of good scientific computation libraries. If you are starting to learn Python, have a look at learning path on Python.
Among its scientific computation libraries, I found Pandas to be the most useful for data science operations. Pandas, along with Scikit-learn provides almost the entire stack needed by a data scientist. This article focuses on providing 12 ways for data manipulation in Python. I’ve also shared some tips & tricks which will allow you to work faster.
I would recommend that you look at the codes for data exploration before going ahead. To help you understand better, I’ve taken a data set to perform these operations and manipulations.
If you’re just starting out your data science journey, you’ll love the ‘Introduction to Data Science‘ course. It covers the basics of Python, comprehensive introduction to statistics and several machine learning algorithms. A must-have course!
Data Set: I’ve used the data set of Loan Prediction problem. Download the dataset and get started.

I’ll start by importing the Pandas module and loading the data set into Python environment as Pandas Dataframe:
import pandas as pd
import numpy as np
data = pd.read_csv("train.csv", index_col="Loan_ID")
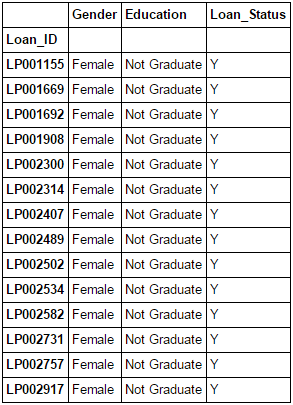
What do you do, if you want to filter values of a column based on conditions from another set of columns from a Pandas Dataframe? For instance, we want a list of all females who are not graduates and got a loan. Boolean indexing can help here. You can use the following code:
data.loc[(data["Gender"]=="Female") & (data["Education"]=="Not Graduate") & (data["Loan_Status"]=="Y"), ["Gender","Education","Loan_Status"]]
Read More about Boolean Indexing in Pandas here: Pandas Selecting and Indexing
It is one of the commonly used Pandas functions for manipulating a pandas dataframe and creating new variables. Pandas Apply function returns some value after passing each row/column of a data frame with some function. The function can be both default or user-defined. For instance, here it can be used to find the #missing values in each row and column.
#Create a new function:
def num_missing(x):
  return sum(x.isnull())

#Applying per column:
print "Missing values per column:"
print data.apply(num_missing, axis=0) #axis=0 defines that function is to be applied on each column

#Applying per row:
print "\nMissing values per row:"
print data.apply(num_missing, axis=1).head() #axis=1 defines that function is to be applied on each row
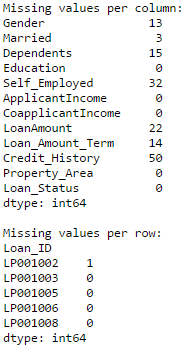
Thus we get the desired result.
Note: Pandas head() function is used in second output because it contains many rows.
Read More about Pandas Apply here: Pandas Reference (apply)
‘fillna()’ does it in one go. It is used for updating missing values with the overall mean/mode/median of the column. Let’s impute the ‘Gender’, ‘Married’ and ‘Self_Employed’ columns with their respective modes.
#First we import scipy function to determine the mode
from scipy.stats import mode
mode(data['Gender'])
Output: ModeResult(mode=array([‘Male’], dtype=object), count=array([489]))
This returns both mode and count. Remember that mode can be an array as there can be multiple values with high frequency. We will take the first one by default always using:
mode(data['Gender']).mode[0]
![]()
Now we can fill the missing values in the Pandas Dataframe data and check using technique #2.
#Impute the values:
data['Gender'].fillna(mode(data['Gender']).mode[0], inplace=True)
data['Married'].fillna(mode(data['Married']).mode[0], inplace=True)
data['Self_Employed'].fillna(mode(data['Self_Employed']).mode[0], inplace=True)

#Now check the #missing values again to confirm:
print data.apply(num_missing, axis=0)
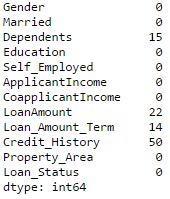
Hence, it is confirmed that missing values in Pandas dataframe are imputed. Please note that this is the most primitive form of imputation. Other sophisticated techniques include modeling the missing values, using grouped averages (mean/mode/median). I’ll cover that part in my next articles.
Read More about imputing missing values in Pandas dataframe here: Pandas Reference (fillna)
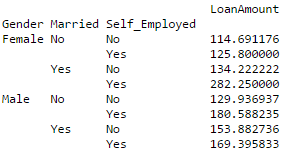
Pandas can be used to create MS Excel style pivot tables. For instance, in this case, a key column is “LoanAmount” which has missing values. We can impute it using mean amount of each ‘Gender’, ‘Married’ and ‘Self_Employed’ group. The mean ‘LoanAmount’ of each group in Pandas dataframe can be determined as:
#Determine pivot table
impute_grps = data.pivot_table(values=["LoanAmount"], index=["Gender","Married","Self_Employed"], aggfunc=np.mean)
print impute_grps
Read more about Pandas Pivot Table here: Pandas Reference (Pivot Table)
If you notice the output of step #3, it has a strange property. Each Pandas index is made up of a combination of 3 values. This is called Multi-Indexing. It helps in performing operations really fast.
Continuing the example from #3, we have the values for each group but they have not been imputed.
This can be done using the various techniques from pandas learned till now.
#iterate only through rows with missing LoanAmount
for i,row in data.loc[data['LoanAmount'].isnull(),:].iterrows():
  ind = tuple([row['Gender'],row['Married'],row['Self_Employed']])
  data.loc[i,'LoanAmount'] = impute_grps.loc[ind].values[0]

#Now check the #missing values again to confirm:
print data.apply(num_missing, axis=0)

Note:
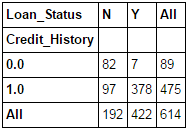
This function is used to get an initial “feel” (view) of the data. Here, we can validate some basic hypothesis. For instance, in this case, “Credit_History” is expected to affect the loan status significantly. This can be tested using cross-tabulation as shown below:
pd.crosstab(data["Credit_History"],data["Loan_Status"],margins=True)
These are absolute numbers. But, percentages can be more intuitive in making some quick insights. We can do this using the Pandas apply function:
def percConvert(ser):
  return ser/float(ser[-1])
  pd.crosstab(data["Credit_History"],data["Loan_Status"],margins=True).apply(percConvert, axis=1)
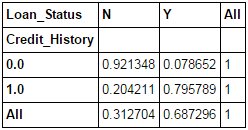
Now, it is evident that people with a credit history have much higher chances of getting a loan as 80% people with credit history got a loan as compared to only 9% without credit history.
But that’s not it. It tells an interesting story. Since I know that having a credit history is super important, what if I predict loan status to be Y for ones with credit history and N otherwise. Surprisingly, we’ll be right 82+378=460 times out of 614 which is a whopping 75%!
I won’t blame you if you’re wondering why the hell do we need statistical models. But trust me, increasing the accuracy by even 0.001% beyond this mark is a challenging task. Would you take this challenge?
Note: 75% is on train set. The test set will be slightly different but close. Also, I hope this gives some intuition into why even a 0.05% increase in accuracy can result in jump of 500 ranks on the Kaggle leaderboard.
Read More about Pandas Crosstab function here: Pandas Reference (crosstab)
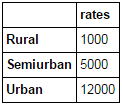
Merging Pandas dataframes become essential when we have information coming from different sources to be collated. Consider a hypothetical case where the average property rates (INR per sq meters) is available for different property types. Let’s define a Pandas dataframe as:
prop_rates = pd.DataFrame([1000, 5000, 12000], index=['Rural','Semiurban','Urban'],columns=['rates'])
prop_rates
Now we can merge this information with the original Pandas dataframe as:
data_merged = data.merge(right=prop_rates, how='inner',left_on='Property_Area',right_index=True, sort=False)
data_merged.pivot_table(values='Credit_History',index=['Property_Area','rates'], aggfunc=len)
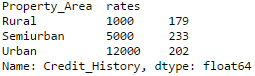
The pivot table validates successful merge operation. Note that the ‘values’ argument is irrelevant here because we are simply counting the values.
ReadMore: Pandas Reference (merge)
Pandas allow easy sorting based on multiple columns. This can be done as:
data_sorted = data.sort_values(['ApplicantIncome','CoapplicantIncome'], ascending=False)
data_sorted[['ApplicantIncome','CoapplicantIncome']].head(10)
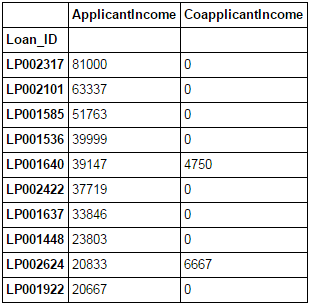
Note: Pandas “sort” function is now deprecated. We should use “sort_values” instead.
More: Pandas Reference (sort_values)
Many of you might be unaware that boxplots and histograms can be directly plotted in Pandas and calling matplotlib separately is not necessary. It’s just a 1-line command. For instance, if we want to compare the distribution of ApplicantIncome by Loan_Status:
import matplotlib.pyplot as plt
%matplotlib inline
data.boxplot(column="ApplicantIncome",by="Loan_Status")
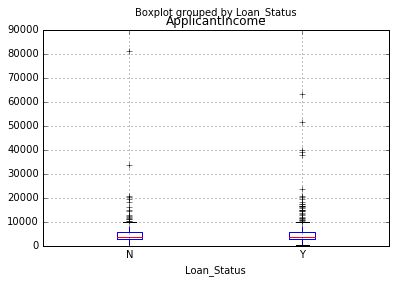
data.hist(column="ApplicantIncome",by="Loan_Status",bins=30)
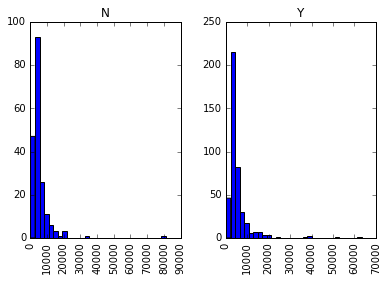
This shows that income is not a big deciding factor on its own as there is no appreciable difference between the people who received and were denied the loan.
Read More about Pandas Histogram & Pandas Boxplot here: Pandas Reference (hist) | Pandas Reference (boxplot)
Sometimes numerical values make more sense if clustered together. For example, if we’re trying to model traffic (#cars on road) with time of the day (minutes). The exact minute of an hour might not be that relevant for predicting traffic as compared to actual period of the day like “Morning”, “Afternoon”, “Evening”, “Night”, “Late Night”. Modeling traffic this way will be more intuitive and will avoid overfitting.
Here we define a simple function which can be re-used for binning any variable fairly easily.
#Binning:
def binning(col, cut_points, labels=None):
#Define min and max values:
minval = col.min()
maxval = col.max()
#create list by adding min and max to cut_points
break_points = [minval] + cut_points + [maxval]
#if no labels provided, use default labels 0 ... (n-1)
if not labels:
labels = range(len(cut_points)+1)
#Binning using cut function of pandas
colBin = pd.cut(col,bins=break_points,labels=labels,include_lowest=True)
return colBin
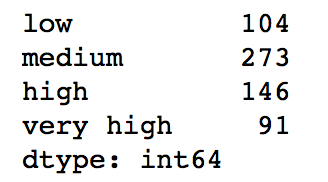
#Binning age:
cut_points = [90,140,190]
labels = ["low","medium","high","very high"]
data["LoanAmount_Bin"] = binning(data["LoanAmount"], cut_points, labels)
print pd.value_counts(data["LoanAmount_Bin"], sort=False)
Read More about Pandas Cut Function here: Pandas Reference (cut)
Often, we find a case where we’ve to modify the categories of a nominal variable. This can be due to various reasons:
Here I’ve defined a generic function which takes in input as a dictionary and codes the values using ‘replace’ function in Pandas.
#Define a generic function using Pandas replace function
def coding(col, codeDict):
  colCoded = pd.Series(col, copy=True)
  for key, value in codeDict.items():
    colCoded.replace(key, value, inplace=True)
  return colCoded

#Coding LoanStatus as Y=1, N=0:
print 'Before Coding:'
print pd.value_counts(data["Loan_Status"])
data["Loan_Status_Coded"] = coding(data["Loan_Status"], {'N':0,'Y':1})
print '\nAfter Coding:'
print pd.value_counts(data["Loan_Status_Coded"])
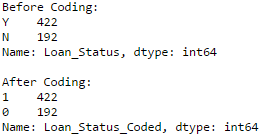
Similar counts before and after proves the coding.
Read More about Pandas Replace Function here: Pandas Reference (replace)
This is not a frequently used Pandas operation. Still, you don’t want to get stuck. Right? At times you may need to iterate through all rows of a Pandas dataframe using a for loop. For instance, one common problem we face is the incorrect treatment of variables in Python. This generally happens when:
So it’s generally a good idea to manually define the column types. If we check the data types of all columns:
#Check current type:
data.dtypes
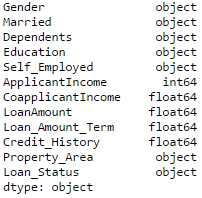
Here we see that Credit_History is a nominal variable but appearing as float. A good way to tackle such issues is to create a csv file with column names and types. This way, we can make a generic function to read the file and assign column data types. For instance, here I have created a csv file datatypes.csv.
#Load the file:
colTypes = pd.read_csv('datatypes.csv')
print colTypes
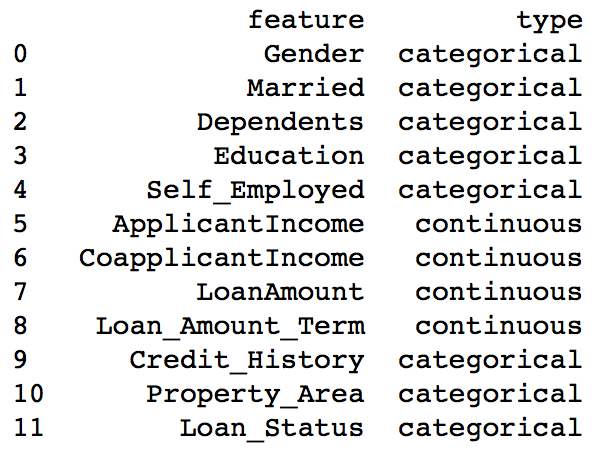
After loading this file, we can iterate through each row and assign the datatype using column ‘type’ to the variable name defined in the ‘feature’ column.
#Iterate through each row and assign variable type in a Pandas dataframe
#Note: astype is used to assign types

for i, row in colTypes.iterrows():  #i: dataframe index; row: each row in series format
    if row['type']=="categorical":
        data[row['feature']]=data[row['feature']].astype(np.object)
    elif row['type']=="continuous":
        data[row['feature']]=data[row['feature']].astype(np.float)
print data.dtypes
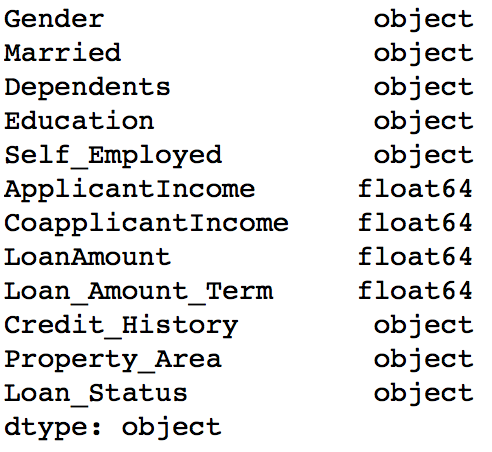
Now the credit history column is modified to ‘object’ type which is used for representing nominal variables in Pandas.
Read More about Pandas iterrows here: Pandas Reference (iterrows)
Now, its time to take the plunge and actually play with some other real datasets and test your learning in Pandas. So are you ready to take on the challenge? Accelerate your data science journey with the following Practice Problems:
 |
Practice Problem: Food Demand Forecasting Challenge | Predict the demand of meals for a meal delivery company |
 |
Practice Problem: HR Analytics Challenge | Identify the employees most likely to get promoted |
 |
Practice Problem: Predict Number of Upvotes | Predict number of upvotes on a query asked at an online question & answer platform |
In this article, we covered various functions of Pandas which can make our life easy while performing data exploration and feature engineering. Also, we defined some generic functions which can be reused for achieving similar objective on different datasets.
Also See: If you have any doubts pertaining to Pandas or Python in general, feel free to discuss with us.
Did you find the article useful? Do you use some better (easier/faster) techniques for performing the tasks discussed above? Do you think there are better alternatives to Pandas in Python? We’ll be glad if you share your thoughts as comments below.
Lorem ipsum dolor sit amet, consectetur adipiscing elit,


For #3 - Imputing missing values, where do "ModeResult" come from? Using it as it's given in the example above gives error: "ModeResult is not defined."
Actually the line "ModeResult(mode=array(['Male'], dtype=object), count=array([489]))" is the output of the above code: "mode(data['Gender'])". This shows that the output is not a scalar but an array containing 'mode' and 'count' as the 2 parts. To extract the mode value as a scalar, we need to write: mode(data['Gender']).mode[0] ".mode" would point to the mode element of the array. But this results in again an array because mode need not always be a unique value. Thus, we have to include "[0]" to get the first element of the array as a scalar, which can be used for imputation. Hope this makes sense.
While Imputing the values in the blank places data['Gender'].fillna(mode(data['Gender']).mode[0], inplace=True) I am getting error: data['Gender'].fillna(mode(data['Gender']).mode[0], inplace=True) AttributeError: 'tuple' object has no attribute 'mode'
Hi Mudit, Please refer to the discussion above with "CowboyBobJr". It's probably because you have scipy version 0.15.0 Please upgrade to 0.16.0. Let me know if it still gives an error. Cheers!
Hello @Mudit Rastogi, I had the same error as you, but solve it by using astype() function. try the example below. mode(df['Gender'].astype(str))
Why not use map in #11. data["Loan_Status_Coded"] = coding(data["Loan_Status"], {'N':0,'Y':1}) --> data["Loan_Status_Coded"] = data["Loan_Status"].map( {'N':0,'Y':1}) http://pandas.pydata.org/pandas-docs/version/0.17.1/generated/pandas.Series.map.html
Hello, Yes using map is another way of doing this. But there is one catch which should be kept in mind. Map requires all the possible values to be entered and would return NaN for others. For example, suppose: x = pd.Series(['Yes','No','Y','No','Yes']) Now we see that one element 'Y' has to be re-coded to 'Yes' but I don't want to change the others. Case1 - Using map: x.map({'Y':'Yes'}) Output: Nan Nan Yes Nan Nan This is because map required all the elements to be passed. Case2 - Using replace: x.replace('Y','Yes') Output: Yes No Yes No Yes This works with only a single value being passed. To summarize, map can be used but we should take special care to mention all the unique values even if they are not to be re-coded. On the other hand, replace is more generic. Hope this makes sense. Cheers!
For 11, Coding nominal data I found a better way to encode categorical data to numerical using from sklearn.preprocessing.LabelEncoder. This encodes the data to numeric and later once can reproduce labels back passing the numeric data to decoder. Eg. >>> from sklearn import preprocessing >>> le = preprocessing.LabelEncoder() >>> le.fit([1, 2, 2, 6]) LabelEncoder() >>> le.classes_ array([1, 2, 6]) >>> le.transform([1, 1, 2, 6]) # Encode array([0, 0, 1, 2]...) >>> le.inverse_transform([0, 0, 1, 2]) #Decode array([1, 1, 2, 6]) http://scikit-learn.org/stable/modules/generated/sklearn.preprocessing.LabelEncoder.html
Hi Shravan, Thanks for sharing this information. Yes this is definitely another way and looks to be shorter. Please note that this will automatically assign values [0 1 . . . . (#classes-1)] and it applies them on sorted categories. Sometimes, we might want to assign different codes which won't be possible with this. But these cases are rare and your code would work in most cases. Thanks! Aarshay
I have a pandas problem of creating additional columns. Can you look into it? I have a pandas data frame (X11) like this: dx1 dx2 dx3 dx4 0 25041 40391 5856 0 1 25041 40391 25081 5856 2 25041 40391 42822 0 3 25061 40391 0 0 4 25041 40391 0 5856 5 40391 25002 5856 3569 I want to create dummy column(s) for cell values like 25041,40391,5856 etc. So there will be a column 25041 with value as 1 or 0 if 25041 occurs in that particular row in any dxs columns. I am using this code and it works when number of rows are less. Final outcome is at bottom. mat = X11.as_matrix(columns=None) values, counts = np.unique(mat.astype(str), return_counts=True) for x in values: X11[x] = X11.isin([x]).any(1).astype(int) When number of rows are many thousands or in millions, it hangs and takes forever and I am not getting any result. The output should be like this. dx1 dx2 dx3 dx4 0 25002 25041 25061 25081 3569 40391 42822 5856 25041 40391 5856 0 0 0 1 0 0 0 1 0 1 25041 40391 25081 5856 0 0 1 0 1 0 1 0 1 25041 40391 42822 0 0 0 1 0 0 0 1 1 0 25061 40391 0 0 0 0 0 1 0 0 1 0 0 25041 40391 0 5856 0 0 1 0 0 0 1 0 1 40391 25002 5856 3569 0 1 0 0 0 1 1 0 1 I tried pd.get_dummies(X11[column_name]). But it creates multiple dummies for same cell value and last one overwrites the earlier occurrence and I loose previous values. Any idea?
Hi Sanoj, You seem to be using a pretty complicated way. I have shared my code where i have first replicated your data and then performed the necessary steps to get the output: import pandas as pd import numpy as np #preparing data: matrix = [[25041, 40391, 5856, 0], [25041, 40391, 25081, 5856], [25041, 40391, 42822, 0], [25061, 40391, 0, 0], [25041, 40391, 0, 5856], [40391, 25002, 5856, 3569]] data = pd.DataFrame(matrix, columns = ['dx1', 'dx2', 'dx3', 'dx4']) #performing action: for col in data.columns: data[col].astype(np.object,copy=False) unq = data[col].unique() for val in unq: data[val] = data[col].apply(lambda x: 1 if x==val else 0) print data result: dx1 dx2 dx3 dx4 25041 25061 40391 25002 5856 25081 42822 \ 0 25041 40391 5856 0 1 0 1 0 0 0 0 1 25041 40391 25081 5856 1 0 1 0 1 1 0 2 25041 40391 42822 0 1 0 1 0 0 0 1 3 25061 40391 0 0 0 1 1 0 0 0 0 4 25041 40391 0 5856 1 0 1 0 1 0 0 5 40391 25002 5856 3569 0 0 0 1 0 0 0 0 3569 0 1 0 1 0 0 2 1 0 3 1 0 4 0 0 5 0 1 Try running this on your end and let me know if you face challenges in understanding the code. Cheers, aarshay
I have used different approach for binning the LoanAmount column but I am getting few values diffrent can anyone help me why this is occuring. My Approach for binning : minimum = data['LoanAmount'].min() maximum = data['LoanAmount'].max() cut_points = [minimum,90,140,190,maximum] labels = ['low','medium','high','veryhigh'] data['LoanAmount_bin'] = pd.cut(data['LoanAmount'],cut_points,labels=labels) pd.value_counts(data['LoanAmount_bin'],sort=False) Output: low 103 medium 273 high 146 veryhigh 91
Hi Harmandeep, You should add a parameter: 'include_lowest = True' Update 1 line: data[‘LoanAmount_bin’] = pd.cut(data[‘LoanAmount’],cut_points,labels=labels,include_lowest=True) You are just 1 short and this is because the minimum value is not being included. Hope this answers the query. Feel free to reach out in case you have more concerns. :)
Hi Aarshay, It is really helpful and a great tutorial. There is a small correction in #12 point stated. if row['feature']=="categorical": data[row['feature']]=data[row['feature']].astype(np.object) elif row['feature']=="continuous": data[row['feature']]=data[row['feature']].astype(np.float I think the 'if' condition should be row['type']. I think the image after changing the datatype is also wrong. Please let me know if my interpretation is wrong.
Point well taken.. I'm feeling really happy that people are going into such depth.. Things like these make AV the right ecosystem for learning for everyone. Please see the updated changes. Thanks! :)
Thank you for a valuable post. I really learned so much on Python and Pandas by reading it. I needed to learn how to loop through Pandas DataFrame, which I did learn but you put so much more valuable stuff. Again, thanks, Regards, Freddy
I'm glad you liked it. Stay tuned for many more of this kind!
Hi Aarshay, I have practiced your code and data, but i made the mistake! My python's edition is the 3.5. #3 #first we import a function to determine the mode from scipy.stats import mode mode(data['Gender']).mode[0] #Impute the values: data['Gender'].fillna(mode(data['Gender']).mode[0],inplace=True) data['Married'].fillna(mode(data['Married']).mode[0],inplace=True) data['Self_Employed'].fillna(mode(data['Self_Employed']).mode[0],inplace=True) #Now check the #missing values again to confirm: print (data.apply(num_missing,axis=0)) the output error: TypeError: unorderable types: str() > float() What should I do? Thank you very much!
which line are you getting this error? check this post out, you might be having a similar problem - http://stackoverflow.com/questions/10779187/what-does-the-unorderable-type-error-mean-in-python
mode(x.astype('str')).mode[0]
I cannot find the data set in the link that is pointed to. Can someone please help me?
You need to make an account and register for the practise problem. You'll get the data set then.
The BOXPLOT and HISTOGRAM features were something that i did not know. Pretty useful for me
I figured it out. Silly mistake. I logged out of Jupyter and then when reopened forgot to run code to insert file into 'data'
Hi everyone, I am new to python and data science altogether. Pardon because because my question is not directly related to the post. I am writing a program to read and analyze a csv with pandas. The problem is that the csv will be supplied by the user and it can have variable number of columns depending on the user. I do not have a prior knowledge of the column names. What I did is to read the csv using pandas and read the colum names into a python list. However problem ensued when I attempted to access the dataframe column by doing something like this: #List of column names, coln coln = df.columns df.ix[:, df.coln[0]] # to access the first column of the dataframe. But this did not work. Please help how do I do this?
Such a helpful tutorial, thank you.
I have read many articles on Data Science with Python (Pandas) and this is by far the most lucidly explained and to the point article I have come across. Thanks for the efforts and also the complete tutorial to data science from scratch was great!
Hi Naval, Glad you found it useful!
This article has good info about pandas.
hi, i want to know, can we do imputation on credit history and how will do that?
Hi There, First of all thank you for this very useful resources. I have got one question: Please bear in mind that I am using a different csv file. When I run this code (from "#3 imputing missing file" paragraph). Input[ *] from scipy.stats import mode mode(data['Workclass']) I read the following message before the output: /anaconda/lib/python3.6/site-packages/scipy/stats/stats.py:253: RuntimeWarning: The input array could not be properly checked for nan values. nan values will be ignored. "values. nan values will be ignored.", RuntimeWarning) The problem is the following: I am not always getting an output! Below you find the summary of the missing values: Missing values per column: Age 0 Workclass 1836 Education 0 Marital.Status 0 Occupation 1843 Relationship 0 Race 0 Sex 0 Hours.Per.Week 0 Native.Country 583 Income.Group 0 dtype: int64 The line of scripts seems to be working correctly only with those columns that do not show any missing data... The version of the scipy library is 0.19.0 Can someone help me? Many Thanks
Thank you so much for explanation. I have been trying to learn Python, sorry for my basic question, but I tried to send a job to cluster using a python script. I haven't managed, it only runs the number of line i say. For example: last part: if __name__ == '__main__': import sys file = sys.argv[1: ] ## reference a slice of a list / get everything after the script name lst(int(arg[0]),1000) # running time so when I say python job.py 1 It runs first line of the file, but it does not continue iterating until line 2000 (number of runs). Any help is very much appreciated.
While using, #First we import a function to determine the mode from scipy.stats import mode mode(data['Gender']) I am getting an error, TypeError: '>' not supported between instances of 'str' and 'float' Please help troublesheet
Hi Aarshay, When i'm trying to run mode(train['Gender'],nan_policy='propagate') , it throws an error "TypeError: '<' not supported between instances of 'str' and 'float'" . The type of the gender column is object. Scipy version : scipy.__version__ Out[25]: '0.19.1' Any help with this is much appreciated! Thanks for putting together an excellent tutorial.
It was really helpful. Thank you.
Hi, I am just new to python and very keen on data analytics. Could you please share the project. Thanks,
Hi Gangadhar, You can download the dataset from this link.
So many functions to keep in mind. How to do that?
Good article Aarshay. Few questions - 1. Imputing missing values - You did not show it for Dependents, Term and Cr History. I used same pivot table approach for Dependents based on Gender and Married. For Term, I simply used the mode which was 360. But for Credit History, not sure what to do. Tried building a Binary Logit model to predict the missing Credit History but there is no variable which could predict the History. All P values were pretty high. How do we fill these missing values? 2. Data Type for Credit History - I believe it should be kept as integer as not sure how 'N' and 'Y' for a response variable would help. (Just thinking in terms of Logistic Regression though, not sure about other models.)
Hi Pravin, Like you filled the values with the mode in 'Term', you can similarly do it for 'credit_history'. Another idea could be, missing values in credit_history mean that there is no credit history for the person, and so the missing values could be made 0. Also, you certainly can change the data type for the variable to integer for credit_history
This is really helpful. Very well laid out and easy to follow. Thank you very much for posting this.
Hi Phil, Glad you found this useful.
Hi, Good to have such blog.. I have some other concern, can anyone guide here. Having excel sheet, where I need to copy value of one cell to another cell alternatively. say, from B3 to C2, B5 to C4 and so on. So that, further we can analyze value of B2 and C2, B4 and C4.... Thanks Subhendu
Hi Subhendu, You can use the shift function in pandas for this task.
I'm new to Pandas and data frames, and am facing a task that has me stumped. My dataframe has 12 columns, but the only one affected here is the first column. This column contains string values with the following format: 1.New York 2.New York ... 11.New York 12.New York 13.California 14.California ... 100.California 101.California 102.North Dakota 103.North Dakota ... Each value contains a period, and I want to replace the existing values with only the respective text components that follow the period. Thus, '1.New York' should become 'New York', '101.California' should become 'California', and so on. I thought that I would use the 'find' function (ex. find('.') to locate the period in each entry, as the placement of the period will vary depending on the number that precedes the period. I thought that I would incorporate this into a FOR loop, such as "for x in df['location']', and then replace the existing value with a "sliced" version of each respective value, beginning at one position past the period, and going to the end of the value, but I'm having trouble making this work. As I'm testing, I can isolate the text that follows the period for each value in the column, but I'm unable to set each entry to this revised string. I feel like I'm very close to what needs to be done, but I can't get there. I'm hoping that someone has an idea that I haven't considered.
Hi Amir, You can post your query on the discuss portal so that the community can help you.
Hi there, Very interesting post, I know that this is a 2016 posts. I had some difficulties to find the files. Would you please update/send a link with the files. thanks in advance
Hi vitovla, Thank you for pointing it out. Here is the link for the dataset. I have also updated the same in the article.