Overview
- Learn the methods to impute missing values in R for data cleaning and exploration
- Understand how to use packages like amelia, missForest, hmisc, mi and mice which use bootstrap sampling and predictive modeling
Introduction
Missing values are considered to be the first obstacle in predictive modeling. Hence, it’s important to master the methods to overcome them. Though, some machine learning algorithms claim to treat them intrinsically, but who knows how good it happens inside the ‘black box’.
The choice of method to impute missing values, largely influences the model’s predictive ability. In most statistical analysis methods, listwise deletion is the default method used to impute missing values. But, it not as good since it leads to information loss.
Do you know R has robust packages for missing value imputations?
Yes! R Users have something to cheer about. We are endowed with some incredible R packages for missing values imputation. These packages arrive with some inbuilt functions and a simple syntax to impute missing data at once. Some packages are known best working with continuous variables and others for categorical. With this article, you can make a better decision choose the best suited package.
In this article, I’ve listed 5 R packages popularly known for missing value imputation. There might be more packages. But, I decided to focus on these ones. I’ve tried to explain the concepts in simplistic manner with practice examples in R.

Tutorial on 5 Powerful R Packages used for imputing missing values
List of R Packages
- MICE
- Amelia
- missForest
- Hmisc
- mi
MICE Package
MICE (Multivariate Imputation via Chained Equations) is one of the commonly used package by R users. Creating multiple imputations as compared to a single imputation (such as mean) takes care of uncertainty in missing values.
MICE assumes that the missing data are Missing at Random (MAR), which means that the probability that a value is missing depends only on observed value and can be predicted using them. It imputes data on a variable by variable basis by specifying an imputation model per variable.
For example: Suppose we have X1, X2….Xk variables. If X1 has missing values, then it will be regressed on other variables X2 to Xk. The missing values in X1 will be then replaced by predictive values obtained. Similarly, if X2 has missing values, then X1, X3 to Xk variables will be used in prediction model as independent variables. Later, missing values will be replaced with predicted values.
By default, linear regression is used to predict continuous missing values. Logistic regression is used for categorical missing values. Once this cycle is complete, multiple data sets are generated. These data sets differ only in imputed missing values. Generally, it’s considered to be a good practice to build models on these data sets separately and combining their results.
Precisely, the methods used by this package are:
- PMM (Predictive Mean Matching) – For numeric variables
- logreg(Logistic Regression) – For Binary Variables( with 2 levels)
- polyreg(Bayesian polytomous regression) – For Factor Variables (>= 2 levels)
- Proportional odds model (ordered, >= 2 levels)
Let’s understand it practically now.
> path <- "../Data/Tutorial"
> setwd(path)
#load data
> data <- iris
#Get summary
> summary(iris)
Since, MICE assumes missing at random values. Let’s seed missing values in our data set using prodNA function. You can access this function by installing missForest package.
#Generate 10% missing values at Random
> iris.mis <- prodNA(iris, noNA = 0.1)
#Check missing values introduced in the data
> summary(iris.mis)
I’ve removed categorical variable. Let’s here focus on continuous values. To treat categorical variable, simply encode the levels and follow the procedure below.
#remove categorical variables
> iris.mis <- subset(iris.mis, select = -c(Species))
> summary(iris.mis)
#install MICE
> install.packages("mice")
> library(mice)
mice package has a function known as md.pattern(). It returns a tabular form of missing value present in each variable in a data set.
> md.pattern(iris.mis)
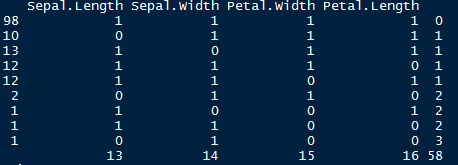
Let’s understand this table. There are 98 observations with no missing values. There are 10 observations with missing values in Sepal.Length. Similarly, there are 13 missing values with Sepal.Width and so on.
This looks ugly. Right ? We can also create a visual which represents missing values. It looks pretty cool too. Let’s check it out.
> install.packages("VIM")
> library(VIM)
> mice_plot <- aggr(iris.mis, col=c('navyblue','yellow'),
numbers=TRUE, sortVars=TRUE,
labels=names(iris.mis), cex.axis=.7,
gap=3, ylab=c("Missing data","Pattern"))
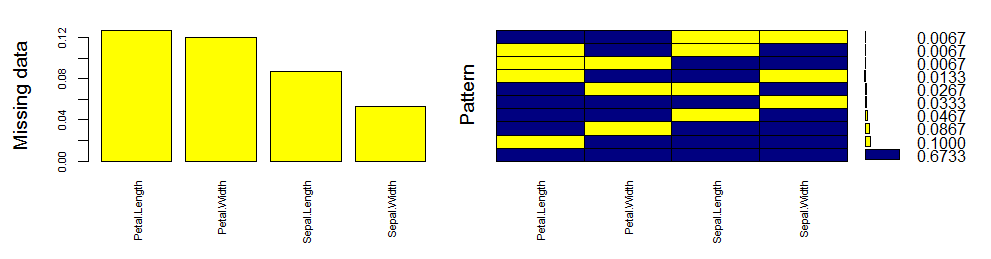
Let’s quickly understand this. There are 67% values in the data set with no missing value. There are 10% missing values in Petal.Length, 8% missing values in Petal.Width and so on. You can also look at histogram which clearly depicts the influence of missing values in the variables.
Now, let’s impute the missing values.
> imputed_Data <- mice(iris.mis, m=5, maxit = 50, method = 'pmm', seed = 500)
> summary(imputed_Data)
Multiply imputed data set
Call:
mice(data = iris.mis, m = 5, method = "pmm", maxit = 50, seed = 500)
Number of multiple imputations: 5
Missing cells per column:
Sepal.Length Sepal.Width Petal.Length Petal.Width
13 14 16 15
Imputation methods:
Sepal.Length Sepal.Width Petal.Length Petal.Width
"pmm" "pmm" "pmm" "pmm"
VisitSequence:
Sepal.Length Sepal.Width Petal.Length Petal.Width
1 2 3 4
PredictorMatrix:
Sepal.Length Sepal.Width Petal.Length Petal.Width
Sepal.Length 0 1 1 1
Sepal.Width 1 0 1 1
Petal.Length 1 1 0 1
Petal.Width 1 1 1 0
Random generator seed value: 500
Here is an explanation of the parameters used:
- m – Refers to 5 imputed data sets
- maxit – Refers to no. of iterations taken to impute missing values
- method – Refers to method used in imputation. we used predictive mean matching.
#check imputed values
> imputed_Data$imp$Sepal.Width
Since there are 5 imputed data sets, you can select any using complete() function.
#get complete data ( 2nd out of 5)
> completeData <- complete(imputed_Data,2)
Also, if you wish to build models on all 5 datasets, you can do it in one go using with() command. You can also combine the result from these models and obtain a consolidated output using pool() command.
#build predictive model
> fit <- with(data = iris.mis, exp = lm(Sepal.Width ~ Sepal.Length + Petal.Width))
#combine results of all 5 models
> combine <- pool(fit)

> summary(combine)
Please note that I’ve used the command above just for demonstration purpose. You can replace the variable values at your end and try it.
Amelia
 This package (Amelia II) is named after Amelia Earhart, the first female aviator to fly solo across the Atlantic Ocean. History says, she got mysteriously disappeared (missing) while flying over the pacific ocean in 1937, hence this package was named to solve missing value problems.
This package also performs multiple imputation (generate imputed data sets) to deal with missing values. Multiple imputation helps to reduce bias and increase efficiency. It is enabled with bootstrap based EMB algorithm which makes it faster and robust to impute many variables including cross sectional, time series data etc. Also, it is enabled with parallel imputation feature using multicore CPUs.
It makes the following assumptions:
- All variables in a data set have Multivariate Normal Distribution (MVN). It uses means and covariances to summarize data.
- Missing data is random in nature (Missing at Random)
It works this way. First, it takes m bootstrap samples and applies EMB algorithm to each sample. The m estimates of mean and variances will be different. Finally, the first set of estimates are used to impute first set of missing values using regression, then second set of estimates are used for second set and so on.
On comparing with MICE, MVN lags on some crucial aspects such as:
- MICE imputes data on variable by variable basis whereas MVN uses a joint modeling approach based on multivariate normal distribution.
- MICE is capable of handling different types of variables whereas the variables in MVN need to be normally distributed or transformed to approximate normality.
- Also, MICE can manage imputation of variables defined on a subset of data whereas MVN cannot.
Hence, this package works best when data has multivariable normal distribution. If not, transformation is to be done to bring data close to normality.
Let’s understand it practically now.
#install package and load library
> install.packages("Amelia")
> library(Amelia)
#load data
> data("iris")
The only thing that you need to be careful about is classifying variables. It has 3 parameters:
- idvars – keep all ID variables and other variables which you don’t want to impute
- noms – keep nominal variables here
#seed 10% missing values
> iris.mis <- prodNA(iris, noNA = 0.1)
> summary(iris.mis)
#specify columns and run amelia
> amelia_fit <- amelia(iris.mis, m=5, parallel = "multicore", noms = "Species")
#access imputed outputs
> amelia_fit$imputations[[1]]
> amelia_fit$imputations[[2]]
> amelia_fit$imputations[[3]]
> amelia_fit$imputations[[4]]
> amelia_fit$imputations[[5]]
To check a particular column in a data set, use the following commands
> amelia_fit$imputations[[5]]$Sepal.Length
#export the outputs to csv files
> write.amelia(amelia_fit, file.stem = "imputed_data_set")
missForest
As the name suggests, missForest is an implementation of random forest algorithm. It’s a non parametric imputation method applicable to various variable types. So, what’s a non parametric method ?
Non-parametric method does not make explicit assumptions about functional form of f (any arbitary function). Instead, it tries to estimate f such that it can be as close to the data points without seeming impractical.
How does it work ? In simple words, it builds a random forest model for each variable. Then it uses the model to predict missing values in the variable with the help of observed values.
It yield OOB (out of bag) imputation error estimate. Moreover, it provides high level of control on imputation process. It has options to return OOB separately (for each variable) instead of aggregating over the whole data matrix. This helps to look more closely as to how accurately the model has imputed values for each variable.
Let’s understand it practically. Since bagging works well on categorical variable too, we don’t need to remove them here. It very well takes care of missing value pertaining to their variable types:
#missForest
> install.packages("missForest")
> library(missForest)
#load data
> data("iris")
#seed 10% missing values
> iris.mis <- prodNA(iris, noNA = 0.1)
> summary(iris.mis)
#impute missing values, using all parameters as default values
> iris.imp <- missForest(iris.mis)
#check imputed values
> iris.imp$ximp
#check imputation error
> iris.imp$OOBerror
NRMSE PFC
0.14148554 0.02985075
NRMSE is normalized mean squared error. It is used to represent error derived from imputing continuous values. PFC (proportion of falsely classified) is used to represent error derived from imputing categorical values.
#comparing actual data accuracy
> iris.err <- mixError(iris.imp$ximp, iris.mis, iris)
>iris.err
NRMSE PFC
0.1535103 0.0625000
This suggests that categorical variables are imputed with 6% error and continuous variables are imputed with 15% error. This can be improved by tuning the values of mtry and ntree parameter. mtry refers to the number of variables being randomly sampled at each split. ntree refers to number of trees to grow in the forest.
Hmisc
Hmisc is a multiple purpose package useful for data analysis, high – level graphics, imputing missing values, advanced table making, model fitting & diagnostics (linear regression, logistic regression & cox regression) etc. Amidst, the wide range of functions contained in this package, it offers 2 powerful functions for imputing missing values. These are impute() and aregImpute(). Though, it also has transcan() function, but aregImpute() is better to use.
impute() function simply imputes missing value using user defined statistical method (mean, max, mean). It’s default is median. On the other hand, aregImpute() allows mean imputation using additive regression, bootstrapping, and predictive mean matching.
In bootstrapping, different bootstrap resamples are used for each of multiple imputations. Then, a flexible additive model (non parametric regression method) is fitted on samples taken with replacements from original data and missing values (acts as dependent variable) are predicted using non-missing values (independent variable).
Then, it uses predictive mean matching (default) to impute missing values. Predictive mean matching works well for continuous and categorical (binary & multi-level) without the need for computing residuals and maximum likelihood fit.
Here are some important highlights of this package:
- It assumes linearity in the variables being predicted.
- Fisher’s optimum scoring method is used for predicting categorical variables.
Let’s understand it practically.
#install package and load library
> install.packages("Hmisc")
> library(Hmisc)
#load data
> data("iris")
#seed missing values ( 10% )
> iris.mis <- prodNA(iris, noNA = 0.1)
> summary(iris.mis)
# impute with mean value
> iris.mis$imputed_age <- with(iris.mis, impute(Sepal.Length, mean))
# impute with random value
> iris.mis$imputed_age2 <- with(iris.mis, impute(Sepal.Length, 'random'))
#similarly you can use min, max, median to impute missing value
#using argImpute
> impute_arg <- aregImpute(~ Sepal.Length + Sepal.Width + Petal.Length + Petal.Width +

Species, data = iris.mis, n.impute = 5)
argImpute() automatically identifies the variable type and treats them accordingly.
> impute_arg
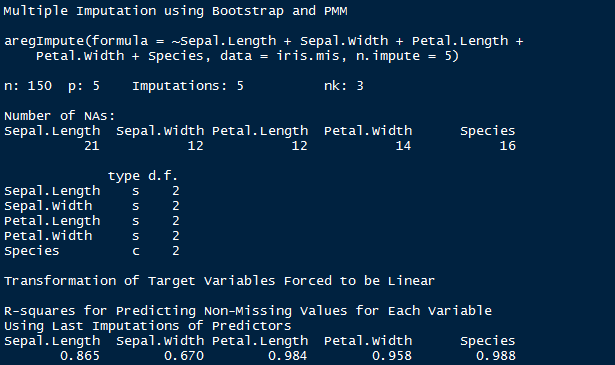
The output shows R² values for predicted missing values. Higher the value, better are the values predicted. You can also check imputed values using the following command
#check imputed variable Sepal.Length
> impute_arg$imputed$Sepal.Length
mi
mi (Multiple imputation with diagnostics) package provides several features for dealing with missing values. Like other packages, it also builds multiple imputation models to approximate missing values. And, uses predictive mean matching method.
Though, I’ve already explained predictive mean matching (pmm) above, but if you haven’t understood yet, here’s a simpler version: For each observation in a variable with missing value, we find observation (from available values) with the closest predictive mean to that variable. The observed value from this “match” is then used as imputed value.
Below are some unique characteristics of this package:
- It allows graphical diagnostics of imputation models and convergence of imputation process.
- It uses bayesian version of regression models to handle issue of separation.
- Imputation model specification is similar to regression output in R
- It automatically detects irregularities in data such as high collinearity among variables.
- Also, it adds noise to imputation process to solve the problem of additive constraints.
Let’s understand it practically.
#install package and load library
> install.packages("mi")
> library(mi)
#load data
> data("iris")
#seed missing values ( 10% )
> iris.mis <- prodNA(iris, noNA = 0.1)
> summary(iris.mis)
#imputing missing value with mi
> mi_data <- mi(iris.mis, seed = 335)
I’ve used default values of parameters namely:
- rand.imp.method as “bootstrap”
- n.imp (number of multiple imputations) as 3
- n.iter ( number of iterations) as 30
> summary(mi_data)
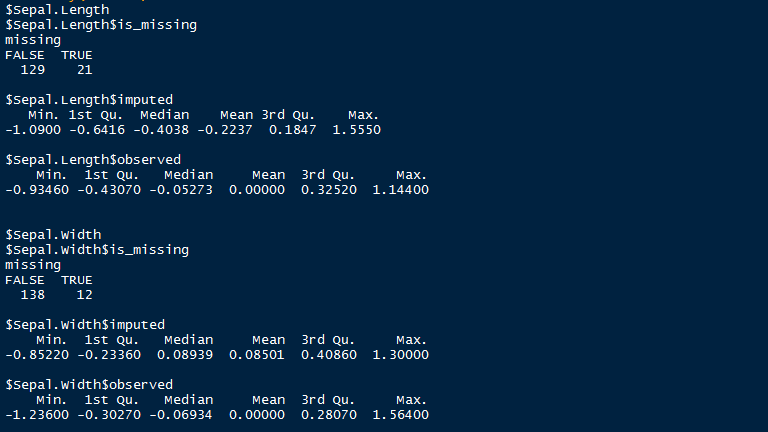
Here is a snapshot o summary output by mi package after imputing missing values. As shown, it uses summary statistics to define the imputed values.
End Notes
So, which is the best of these 5 packages ? I am sure many of you would be asking this! Having created this tutorial, I felt Hmisc should be your first choice of missing value imputation followed by missForest and MICE.
Hmisc automatically recognizes the variables types and uses bootstrap sample and predictive mean matching to impute missing values. You don’t need to separate or treat categorical variable, just like we did while using MICE package. However, missForest can outperform Hmisc if the observed variables supplied contain sufficient information.
In this article, I explain using 5 different R packages for missing value imputation. Such advanced methods can help you score better accuracy in building predictive models.
Did you find this article useful ? Which package do you generally use to impute missing values ? Do share your experience / suggestions in the comments section below.


Hi Manish, thanks for spending your precious time in writing this nice article. I have one doubt whether transformation has to be done after or before imputing missing values. Secondly is there any method to impute outliers.
Hi Surya In case of Amelia, if the data does not have multivariate normal distribution, transformation is required. Alternatively, you can use aregImpute() function from Hmisc package. It also uses predictive mean matching, bootstrapping and addition regression methods.
Thanks Manish for an excellent article. . For a feature, how much % of values if missing should be considered for imputation ? What I mean is - if a feature has values in 5-10 % of total rows - it is good to drop the feature. Please correct my understanding if I am wrong. Thanks again!
Sadashiv, I'm doing some research to be presented at ISPOR that you really don't want to go over the 10% level.
newdata<-read.csv(file="C:\\Users\\e885735\\Desktop\\Prakash\\train_u6lujuX.csv",head=TRUE,sep=",",stringsAsFactors = TRUE,na.strings=c("","NA", "-", "?")) newdata1<-na.omit(newdata) newdata$Credit_History<-as.factor(newdata$Credit_History) install.packages("missForest") library(missForest) newdata.imp<-missForest(newdata[c(2,3,4,5,6,7,8,9,10,11,12,13)]) Now I am comparing actual data accuracy. However I got the below error newdata.err <- mixError(newdata.imp$ximp,newdata,newdata1) :Error in ximp[mis] - xtrue[mis] : non-numeric argument to binary operator In addition: Warning messages: 1: In as.character(as.matrix(ximp[, t.ind])) != as.character(as.matrix(xtrue[, : longer object length is not a multiple of shorter object length 2: In as.character(as.matrix(ximp[, t.ind])) != as.character(as.matrix(xtrue[, : longer object length is not a multiple of shorter object length 3: In as.character(as.matrix(ximp[, t.ind])) != as.character(as.matrix(xtrue[, : longer object length is not a multiple of shorter object length 4: In as.character(as.matrix(ximp[, t.ind])) != as.character(as.matrix(xtrue[, : longer object length is not a multiple of shorter object length 5: In as.character(as.matrix(ximp[, t.ind])) != as.character(as.matrix(xtrue[, : longer object length is not a multiple of shorter object length
Hi Surya The error "Longer object length is not a multiple of shorter object length" pops up when one tries to compare two data frames / vectors / arrays of unequal dimensions or sizes. In your case, newdata1 has only 641 observations as compared to newdata which has 981 observations. Since we don't have complete data, it would be difficult to check the accuracy of imputed values. Alternatively, OOB error is also a good estimate of error accuracy. You can always check OOB error using newdata.imp$OOBerror