Creating Interactive data visualization using Shiny App in R (with examples)
Introduction
There is magic in graphs. The profile of a curve reveals a whole situation in a flash – history of an epidemic, a panic or an era of prosperity. The curve awakens the imagination.
– Henry D. Hubbard
Data visualization plays a vital role in life of a Data Scientist. It is easier to visualize complex data and relationships than deciphering them from spreadsheets / tables.
There are several tools for visualizing data such as Tableau, Qlik, Dygraphs, Kibana etc. If I talk specifically about R, it provides three plotting systems:
- The Base Plotting System.
- The Lattice System.
- The ggplot2 System.
But, writing codes for plotting graphs in R time & again can get very tiring. Also, it is very difficult to create an interactive visualization for story narration using above packages. These problems can be resolved by dynamically creating interactive plots in R using Shiny with minimal effort.
If you use R, chances are that you might have come across Shiny. It is an open package from RStudio, used to build interactive web pages with R. It provides a very powerful way to share your analysis in an interactive manner with the community. The best part about shiny is that you don’t need any knowledge of HTML, CSS or JavaScript to get started.
Today, I will walk you through all the steps involved in creating a shiny app as well as deploying it online to make it accessible to everyone. This article will provide you a good understanding n how shiny apps work and how they can be useful. To provide you a hands on experience on creating Shiny Apps on your own I will be using the Loan Prediction III Practice Problem. And am sure by the end of this article you will be able to create Shiny apps yourself.
Note: This article requires basic knowledge of R language.
Table of Contents
- Shiny: Overview
- Setting up Shiny
- Creating User Interface (Writing “ui.R”)
- Creating the data flow (Writing “server.R”)
- Deploying Shiny App on the Web
- Creating Interactive Visualization for Data Sets
- Add-on Packages for Shiny app
- Advantages and Disadvantages of Shiny
- Additional resources
1. Shiny: Overview
Shiny is an open package from RStudio, which provides a web application framework to create interactive web applications (visualization) called “Shiny apps”. The ease of working with Shiny has what popularized it among R users. These web applications seamlessly display R objects (like plots, tables etc.) and can also be made live to allow access to anyone.
Shiny provides automatic reactive binding between inputs and outputs which we will be discussing in the later parts of this article. It also provides extensive pre-built widgets which make it possible to build elegant and powerful applications with minimal effort.
Any shiny app is built using two components:
1.UI.R: This file creates the user interface in a shiny application. It provides interactivity to the shiny app by taking the input from the user and dynamically displaying the generated output on the screen.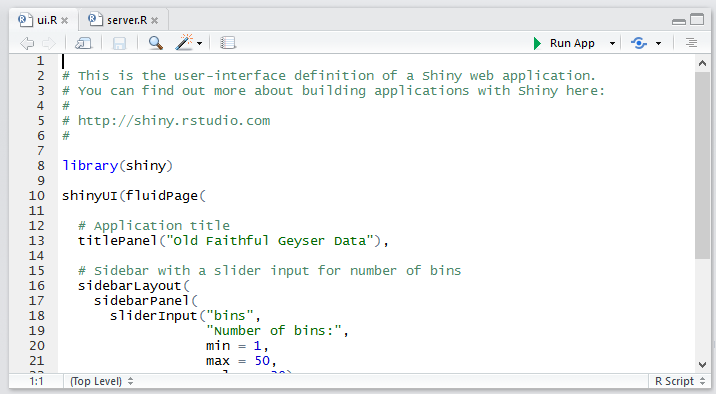
2. Server.R: This file contains the series of steps to convert the input given by user into the desired output to be displayed.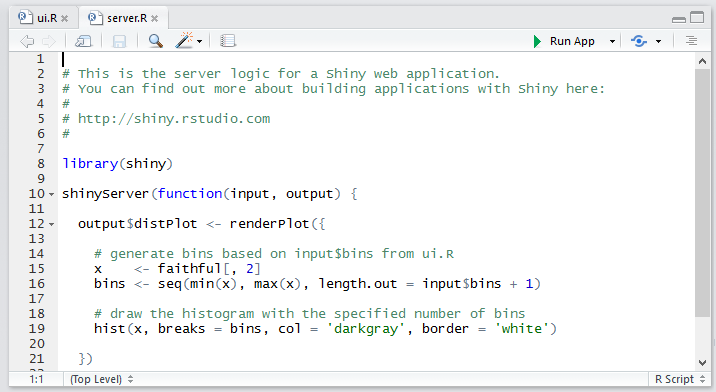
2. Setting up shiny
Before we proceed further you need to set up Shiny in your system. Follow these steps to get started.
1. Create a new project in R Studio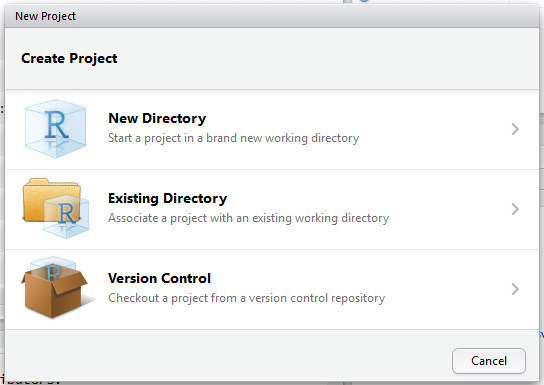 2. Select type as Shiny web application.
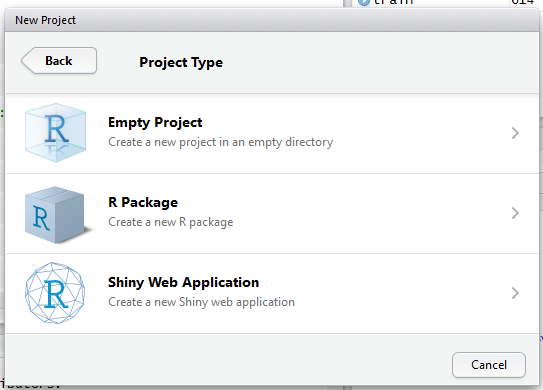
3. It creates two scripts in R Studio named ui.R and server.R.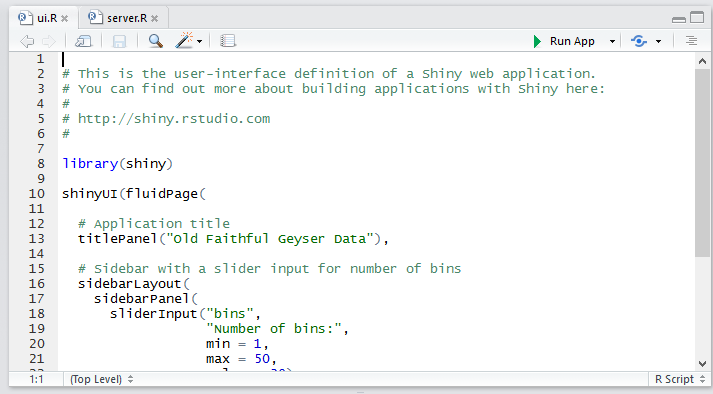
4. Each file needs to be coded separately and the flow of input and output between two is possible.
3. Writing “ui.R”
If you are creating a shiny application, the best way to ensure that the application interface runs smoothly on different devices with different screen resolutions is to create it using fluid page. This ensures that the page is laid out dynamically based on the resolution of each device.

The user interface can be broadly divided into three categories:
- Title Panel: The content in the title panel is displayed as metadata, as in top left corner of above image which generally provides name of the application and some other relevant information.
- Sidebar Layout: Sidebar layout takes input from the user in various forms like text input, checkbox input, radio button input, drop down input, etc. It is represented in dark background in left section of the above image.
- Main Panel: It is part of screen where the output(s) generated as a result of performing a set of operations on input(s) at the server.R is / are displayed.
Let’s understand UI.R and Server.R with an example:
#UI.R #loading shiny librarylibrary(shiny)shinyUI(fluidPage(#fluid page for dynamically adapting to screens of different resolutions.titlePanel("Iris Dataset"),sidebarLayout(sidebarPanel( #implementing radio buttonsradioButtons("p", "Select column of iris dataset:",list("Sepal.Length"='a', "Sepal.Width"='b', "Petal.Length"='c', "Petal.Width"='d')),#slider input for bins of histogramsliderInput("bins","Number of bins:",min = 1,max = 50,value = 30)# Show a plot of the generated distribution),mainPanel(plotOutput("distPlot")))))
4. Writing SERVER.R
This acts as the brain of web application. The server.R is written in the form of a function which maps input(s) to the output(s) by some set of logical operations. The inputs taken in ui.R file are accessed using $ operator (input$InputName). The outputs are also referred using the $ operator (output$OutputName). We will be discussing a few examples of server.R in the coming sections of the article for better understanding.
#SERVER.Rlibrary(shiny)#writing server functionshinyServer(function(input, output) {#referring output distPlot in ui.r as output$distPlotoutput$distPlot <- renderPlot({#referring input p in ui.r as input$pif(input$p=='a'){i<-1}if(input$p=='b'){i<-2}if(input$p=='c'){i<-3}if(input$p=='d'){i<-4}x <- iris[, i]#referring input bins in ui.r as input$binsbins <- seq(min(x), max(x), length.out = input$bins + 1)#producing histogram as outputhist(x, breaks = bins, col = 'darkgray', border = 'white')})})
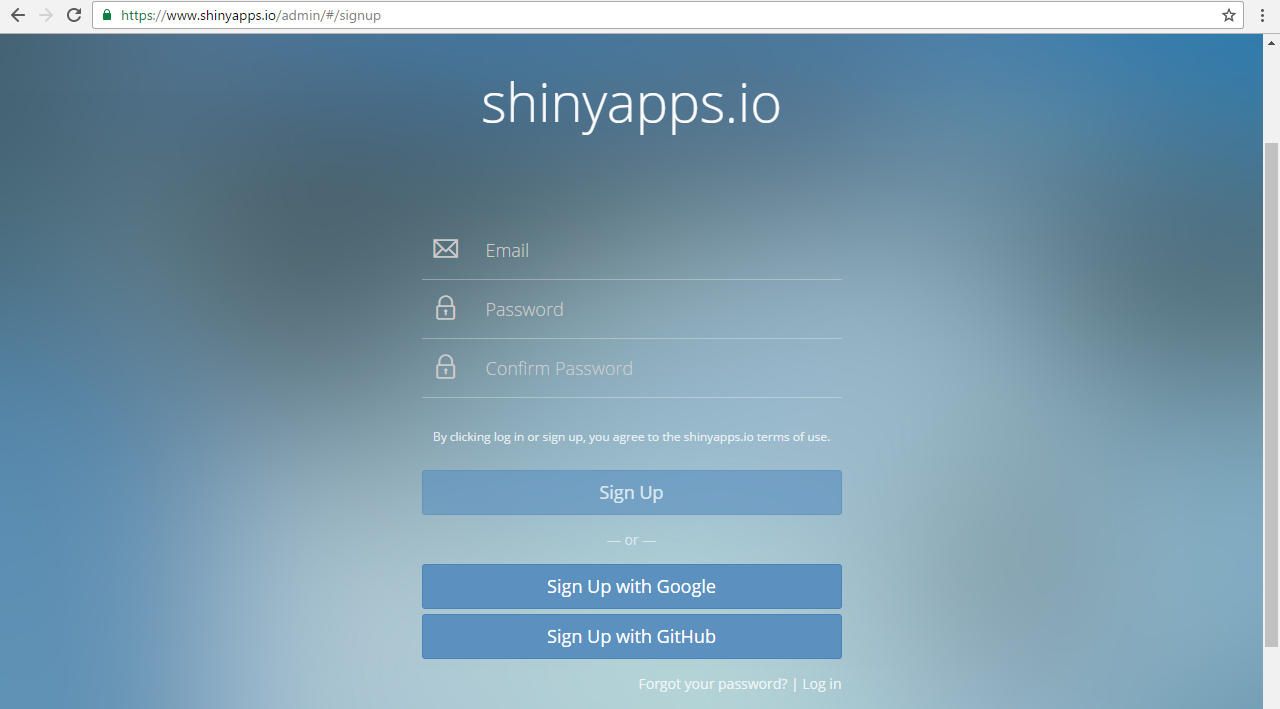
5. Deploying the Shiny app on the Web
The shiny apps which you have created can be accessed and used by anyone only if, it is deployed on the web. You can host your shiny application on “Shinyapps.io”. It provides free of cost platform as a service [PaaS] for deployment of shiny apps, with some restrictions though like only 25 hours of usage in a month, limited memory space, etc. You can also use your own server for deploying shiny apps.
Steps for using shiny cloud:
Step 1: Sign up on shinyapps.io
 Step 2: Go to Tools in R Studio.
Step 3: Open global options.
Step 4: Open publishing tab
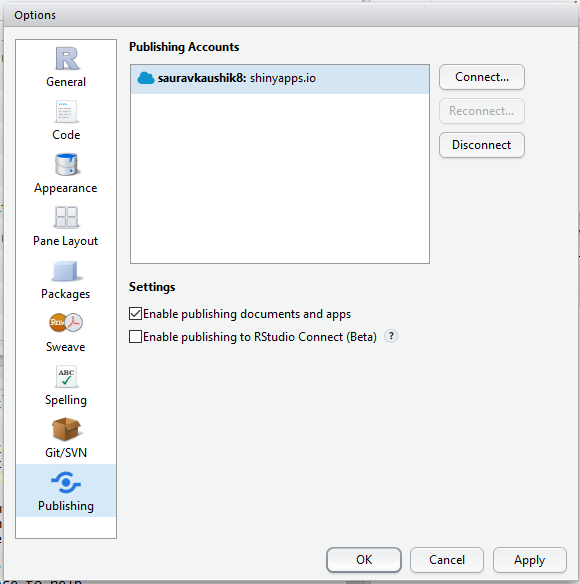 Step 5: Manage your account(s).
That’s it! Using Shiny Cloud is that easy!
6. Creating interactive visualization for data sets
- The basic layout for writing ui.R is :
library(shiny)shinyUI(fluidPage(titlePanel("#Title"),sidebarLayout(sidebarPanel(),mainPanel(#write output))))
- Similarly, the basic layout for writing server.R is :
library(shiny)shinyServer(function(input, output) {#write server function})
Let’s see a few examples:
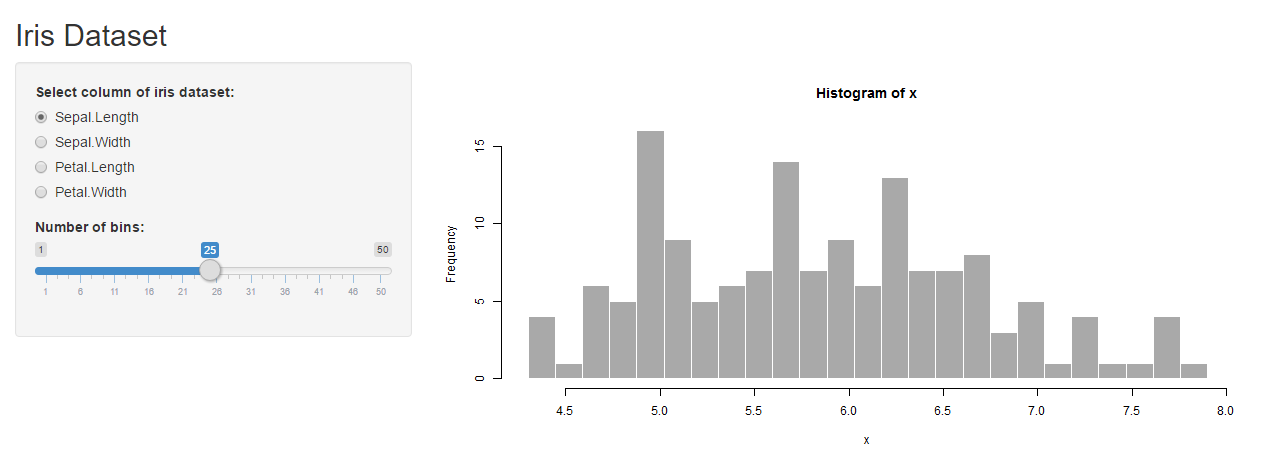
Example 1: Drawing histograms for iris dataset in R using Shiny
- Writing ui.R :
#UI.Rlibrary(shiny)shinyUI(fluidPage(titlePanel("Iris Dataset"),sidebarLayout(sidebarPanel(radioButtons("p", "Select column of iris dataset:",list("Sepal.Length"='a', "Sepal.Width"='b', "Petal.Length"='c', "Petal.Width"='d')),sliderInput("bins","Number of bins:",min = 1,max = 50,value = 30)),mainPanel(plotOutput("distPlot")))))
- Writing server.R :
#SERVER.Rlibrary(shiny)shinyServer(function(input, output) {output$distPlot <- renderPlot({if(input$p=='a'){i<-1}if(input$p=='b'){i<-2}if(input$p=='c'){i<-3}if(input$p=='d'){i<-4}x <- iris[, i]bins <- seq(min(x), max(x), length.out = input$bins + 1)hist(x, breaks = bins, col = 'darkgray', border = 'white')})})
- Output :
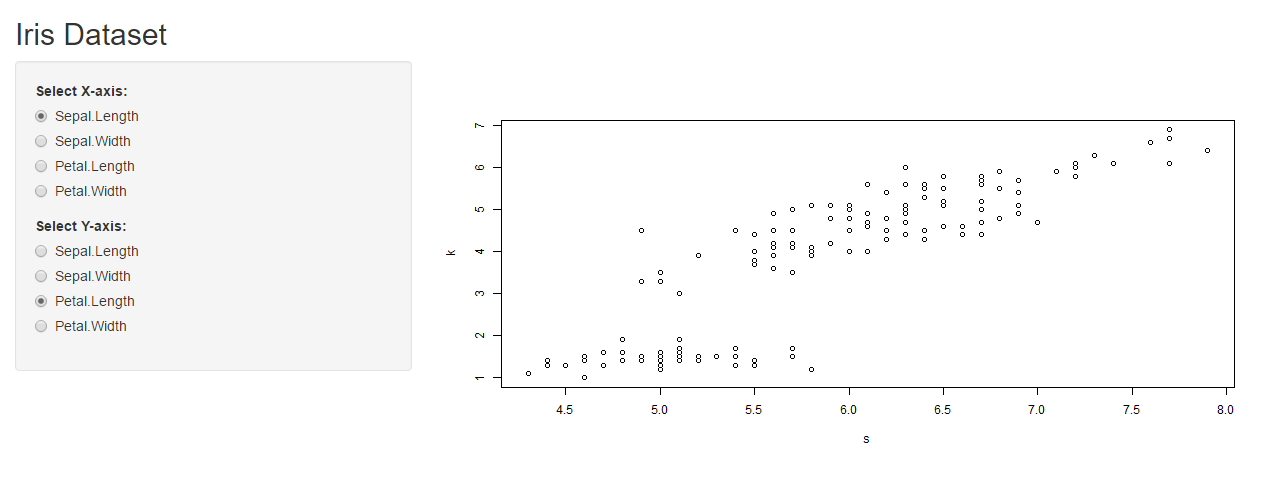
Example 2: Drawing Scatterplots for iris dataset in R using Shiny
- Writing ui.R :
#UI.Rlibrary(shiny)shinyUI(fluidPage(titlePanel("Iris Dataset"),sidebarLayout(sidebarPanel(radioButtons("x", "Select X-axis:",list("Sepal.Length"='a', "Sepal.Width"='b', "Petal.Length"='c', "Petal.Width"='d')),radioButtons("y", "Select Y-axis:",list("Sepal.Length"='e', "Sepal.Width"='f', "Petal.Length"='g', "Petal.Width"='h'))),mainPanel(plotOutput("distPlot")))))
- Writing server.R :
#SERVER.Rlibrary(shiny)shinyServer(function(input, output) {output$distPlot <- renderPlot({if(input$x=='a'){i<-1}if(input$x=='b'){i<-2}if(input$x=='c'){i<-3}if(input$x=='d'){i<-4}if(input$y=='e'){j<-1}if(input$y=='f'){j<-2}if(input$y=='g'){j<-3}if(input$y=='h'){j<-4}s <- iris[, i]k <- iris[, j]plot(s,k)})})
- Output :
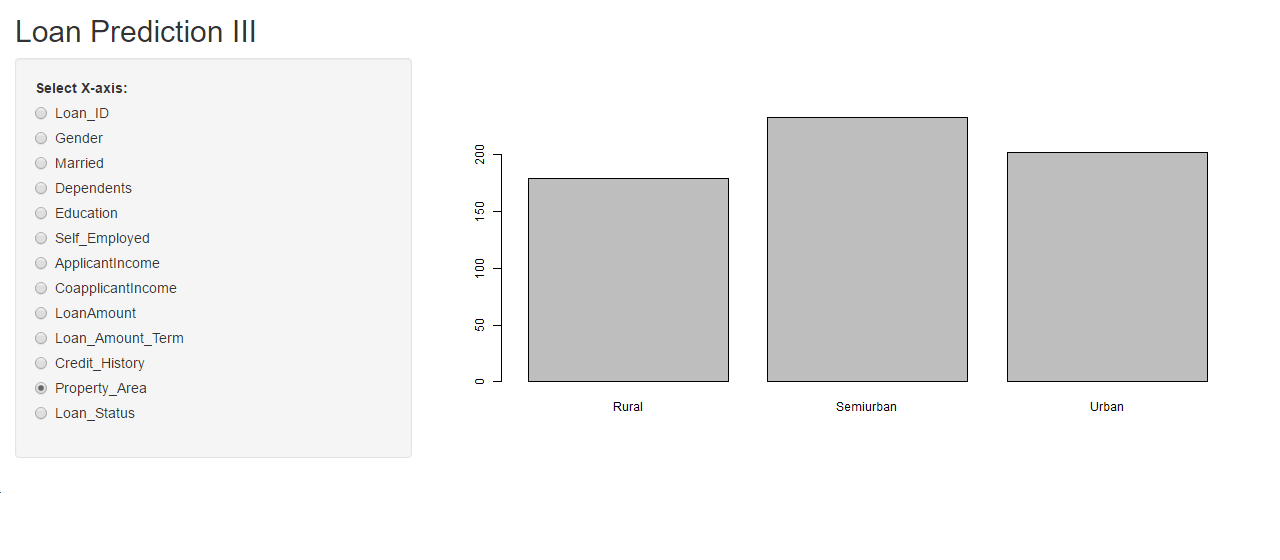
Example 3: Loan Prediction Practice problem
To provide you hands on experience of creating shiny app, we will be using the Loan Prediction practice problem.
To brief you about the data set, the dataset we will be using is a Loan Prediction problem set in which Dream Housing Finance Company provides loans to customers based on their need. They want to automate the process of loan approval based on the personal details the customers provide like Gender, Marital Status, Education, Number of Dependents, Income, Loan Amount, Credit History and others.
1. We will be creating an explanatory analysis of individual variables of the practice problem.
- Writing ui.R :
#UI.R #loading shinylibrary(shiny)shinyUI(fluidPage(titlePanel("Loan Prediction III"),sidebarLayout(sidebarPanel( #input using radiobuttonsradioButtons("s", "Select X-axis:",list("Loan_ID"='a', "Gender"='b', "Married"='c', "Dependents"='d',"Education"='e', "Self_Employed"='f', "ApplicantIncome"='g', "CoapplicantIncome"='h', "LoanAmount"='i', "Loan_Amount_Term"='j', "Credit_History"='k', "Property_Area"='l', "Loan_Status"='m'))),# Show a plot of the generated distributionmainPanel(plotOutput("distPlot")))))
- Writing server.R :
#SERVER.Rlibrary(shiny)#loading shinyshinyServer(function(input, output) {#writing server functionoutput$distPlot <- renderPlot({#creating distPlotif(input$s=='a') { i<-1 }if(input$s=='b') { i<-2 }if(input$s=='c') { i<-3 }if(input$s=='d') { i<-4 }if(input$s=='e') { i<-5 }if(input$s=='f') { i<-6 }if(input$s=='g') { i<-7 }if(input$s=='h') { i<-8 }if(input$s=='i') { i<-9 }if(input$s=='j') { i<-10 }if(input$s=='k') { i<-11 }if(input$s=='l') { i<-12 }if(input$s=='m') { i<-13 } #reading training datasettrain<-read.csv("train_u6lujuX_CVtuZ9i.csv")X <- train[, i]plot(X)})})
- Output :
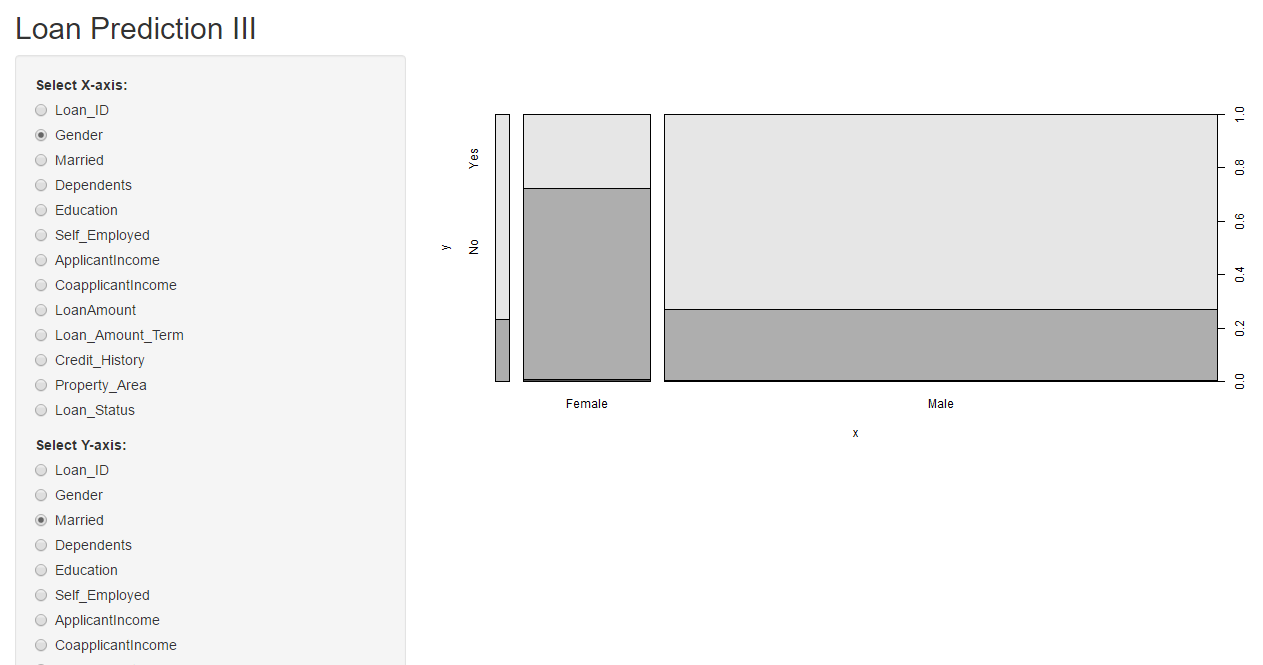
2. Explanatory analysis of multiple variables of Loan Prediction Practice problem.
Writing ui.R :
#UI.Rlibrary(shiny)shinyUI(fluidPage( #writing titletitlePanel("Loan Prediction III"),sidebarLayout(sidebarPanel( #taking inputs using radiobuttonsradioButtons("s", "Select X-axis:",list("Loan_ID"='a1', "Gender"='b1', "Married"='c1', "Dependents"='d1',"Education"='e1', "Self_Employed"='f1', "ApplicantIncome"='g1', "CoapplicantIncome"='h1', "LoanAmount"='i1', "Loan_Amount_Term"='j1', "Credit_History"='k1', "Property_Area"='l1', "Loan_Status"='m1')),#taking input k using radiobuttonsradioButtons("k", "Select Y-axis:",list("Loan_ID"='a2', "Gender"='b2', "Married"='c2', "Dependents"='d2',"Education"='e2', "Self_Employed"='f2', "ApplicantIncome"='g2', "CoapplicantIncome"='h2', "LoanAmount"='i2', "Loan_Amount_Term"='j2', "Credit_History"='k2', "Property_Area"='l2', "Loan_Status"='m2'))),#displaying the output plotmainPanel(plotOutput("distPlot")))))
Writing Server.R
#SERVER.Rlibrary(shiny)#writing Server functionshinyServer(function(input, output) {output$distPlot <- renderPlot({if(input$s=='a1') { i<-1 }if(input$s=='b1') { i<-2 }if(input$s=='c1') { i<-3 }if(input$s=='d1') { i<-4 }if(input$s=='e1') { i<-5 }if(input$s=='f1') { i<-6 }if(input$s=='g1') { i<-7 }if(input$s=='h1') { i<-8 }if(input$s=='i1') { i<-9 }if(input$s=='j1') { i<-10 }if(input$s=='k1') { i<-11 }if(input$s=='l1') { i<-12 }if(input$s=='m1') { i<-13 }if(input$k=='a2') { j<-1 }if(input$k=='b2') { j<-2 }if(input$k=='c2') { j<-3 }if(input$k=='d2') { j<-4 }if(input$k=='e2') { j<-5 }if(input$k=='f2') { j<-6 }if(input$k=='g2') { j<-7 }if(input$k=='h2') { j<-8 }if(input$k=='i2') { j<-9 }if(input$k=='j2') { j<-10 }if(input$k=='k2') { j<-11 }if(input$k=='l2') { j<-12 }if(input$k=='m2') { j<-13 }#read datatrain<-read.csv("train_u6lujuX_CVtuZ9i.csv")X <- train[, i]Y <- train[, j]plot(X,Y)})})
7. Explore Shiny app with these add-on packages
To add some more functionality to your Shiny App, there are some kick-ass packages available at your disposal. Here are few from RStudio.
- http://rstudio.github.io/shinythemes/
- http://rstudio.github.io/leaflet/
- https://rstudio.github.io/shinydashboard/
- http://shiny.rstudio.com/reference/shiny/latest/
8. Advantages and Disadvantages of Shiny
There are plenty of other data visualization tools out there. So, to help you compare what differentiates Shiny and what you can and cannot do with Shiny, let’s look at the advantages and disadvantages of using shiny.
Advantages :
- Efficient Response Time: The response time of shiny app is very small, making it possible to deliver real time output(s) for the given input.
- Complete Automation of the app: A shiny app can be automated to perform a set of operations to produce the desire output based on input.
- Knowledge of HTML, CSS or JavaScript not required: It requires absolutely no prior knowledge of HTML, CSS or JavaScript to create a fully functional shiny app.
- Advance Analytics: Shiny app is very powerful and can be used to visualize even the most complex of data like 3D plots, maps, etc.
- Cost effective: The paid versions of shinyapps.io and shiny servers provide a cost effective scalable solution for deployment of shiny apps online.
- Open Source: Building and getting a shiny app online is free of cost, if you wish to deploy your app on the free version of shinyapps.io
- Requires timely updates: As the functions used in the app gets outdated sometimes with newer package versions, it becomes necessary to update your shiny app time to time.
- No selective access and permissions: There’s no provision for blocking someone’s access to your app or proving selective access. Once the app is live on the web, it is freely accessible by everyone
- Restriction on traffic in free version: In free version of shinyapps.io, you only get 25 active hours of your app per month per account.
9. Additional Resources
In the article I have covered the key areas of Shiny to help you get started with it. Personally to me Shiny is an interesting creation and to make the most of it, I think you should explore more. Here are few additional resources for you to become an adept in creating Shiny Apps.
- http://shiny.rstudio.com/tutorial/
- http://shiny.rstudio.com/images/shiny-cheatsheet.pdf
- http://shiny.rstudio.com/articles/
- http://www.showmeshiny.com/.
- http://www.shinyapps.io/
- http://shiny.rstudio.com/gallery/google-charts.html
- Shiny Google User Group
End Notes
I hope you enjoyed reading the article. Now you should be able to create Shiny apps at your end, try on your ends on building web applications using Shiny with Loan Prediction Practice Problem.
If you have created a Shiny App before, drop in your comments below and tell me more about it. Can you think of some other innovative ideas where Shiny can be useful? Which is the best Shiny app you have ever seen? Do let me know.
You can test your skills and knowledge. Check out Live Competitions and compete with best Data Scientists from all over the world.
Saurav is a Data Science enthusiast, currently in the final year of his graduation at MAIT, New Delhi. He loves to use machine learning and analytics to solve complex data problems.


Thank you for sharing
Thank you for this post.
Welcome, Hena. I'm glad that you liked it.
Thanks Saurav for writing this article. I have myself tried creating couple of Shiny Apps in the past. However, couldn't figure out how to add the option of selecting an Excel based data file to perform some cool analysis using the API. Any understanding related to the above capability will highly benefit a new bee like me.
Hey Sunil, good to see you liked this article. For selecting/importing a file interactively using shiny you can use fileInput() function in your ui.R file in sidebar panel section and access it on server side using input$YourFiileName. You might find this link useful : http://shiny.rstudio.com/reference/shiny/latest/fileInput.html Check out this shiny app which performs similar operations : http://shiny.rstudio.com/gallery/file-upload.html
Nice informative article.
HI Saurav , Nice Article . In disadvantages list -" selective access and permissions" is achievable by creating login page with specific ID and Password . We have implemented in our application. .
Yeah, Chandrasekhar. That's indeed a great idea.
User Privileges in Shiny apps can be created when using Shiny Server Pro and the app will recognise users based on log-in information and deliver personalized content in response. This feature can also be used to control who gets to see what content in your Shiny web application.
Yeah, its certainly available in the pro version. Also, its possible in free version too as Chandrasekhar pointed out.
Awesome explanation Thanks!
Welcome, Marco. I’m glad that you liked it.
Many thanks for your sharing
Very well written, Saurav. Can you do a similar article on setting up your own Shiny server and hosting an app please?
Good to see you liked the article. Yeah definitely. It;s already in my To-Do list. Stay tuned.
This is a great piece of work. Well explained and easy to understand. Thanks Saurav
Anytime. Glad you found it helpful.
Good one. Content is written in very professional way and it make us to read till the end. Thanks for this valuable sharing.
I am trying to plot the real time data of Firebase Server in order to make interactive dashboard , Till now i couldn't found the documentation with R and Firebase , written the javscript code in order to fetch data. Can I add javascript in Shiny app.
Very well written and explained with easy from the basics. Thanks saurav