Generate Quick and Accurate Time Series Forecasts using Facebook’s Prophet (with Python & R codes)
Introduction
Understanding time based patterns is critical for any business. Questions like how much inventory to maintain, how much footfall do you expect in your store to how many people will travel by an airline – all of these are important time series problems to solve.
This is why time series forecasting is one of the must-know techniques for any data scientist. From predicting the weather to the sales of a product, it is integrated into the data science ecosystem and that makes it a mandatory addition to a data scientist’s skillset.
If you are a beginner, time series also provides a good way to start working on real life projects. You can relate to time series very easily and they help you enter the larger world of machine learning.

Prophet is an open source library published by Facebook that is based on decomposable (trend+seasonality+holidays) models. It provides us with the ability to make time series predictions with good accuracy using simple intuitive parameters and has support for including impact of custom seasonality and holidays!
In this article, we shall cover some background on how Prophet fills the existing gaps in generating fast reliable forecasts followed by a demonstration using Python. The final results will surprise you!
Table of Contents
- What’s new in Prophet?
- The Prophet Forecasting Model
- Trend
- Saturating growth
- Changepoints
- Seasonality
- Holidays and events
- Trend
- Prophet in action (using Python & R)
- Trend Parameters
- Seasonality and Holiday Parameters
- Predicting passsenger traffic using Prophet
What’s new in Prophet?
When a forecasting model doesn’t run as planned, we want to be able to tune the parameters of the method with regards to the specific problem at hand. Tuning these methods requires a thorough understanding of how the underlying time series models work. The first input parameters to automated ARIMA, for instance, are the maximum orders of the differencing, the auto-regressive components, and the moving average components. A typical analyst will not know how to adjust these orders to avoid the behaviour and this is the type of expertise that is hard to acquire and scale.

The Prophet package provides intuitive parameters which are easy to tune. Even someone who lacks expertise in forecasting models can use this to make meaningful predictions for a variety of problems in a business scenario.
The Prophet Forecasting Model
We use a decomposable time series model with three main model components: trend, seasonality, and holidays. They are combined in the following equation:
![]()
- g(t): piecewise linear or logistic growth curve for modelling non-periodic changes in time series
- s(t): periodic changes (e.g. weekly/yearly seasonality)
- h(t): effects of holidays (user provided) with irregular schedules
- εt: error term accounts for any unusual changes not accommodated by the model
Using time as a regressor, Prophet is trying to fit several linear and non linear functions of time as components. Modeling seasonality as an additive component is the same approach taken by exponential smoothing in Holt-Winters technique . We are, in effect, framing the forecasting problem as a curve-fitting exercise rather than looking explicitly at the time based dependence of each observation within a time series.
Trend
Trend is modelled by fitting a piece wise linear curve over the trend or the non-periodic part of the time series. The linear fitting exercise ensures that it is least affected by spikes/missing data.
Saturating growth
An important question to ask here is – Do we expect the target to keep growing/falling for the entire forecast interval?
More often than not, there are cases with non-linear growth with a running maximum capacity. I will illustrate this with an example below.
Let’s say we are trying to forecast number of downloads of an app in a region for the next 12 months. The maximum downloads is always capped by the total number of smartphone users in the region. The number of smartphone users will also, however, increase with time.
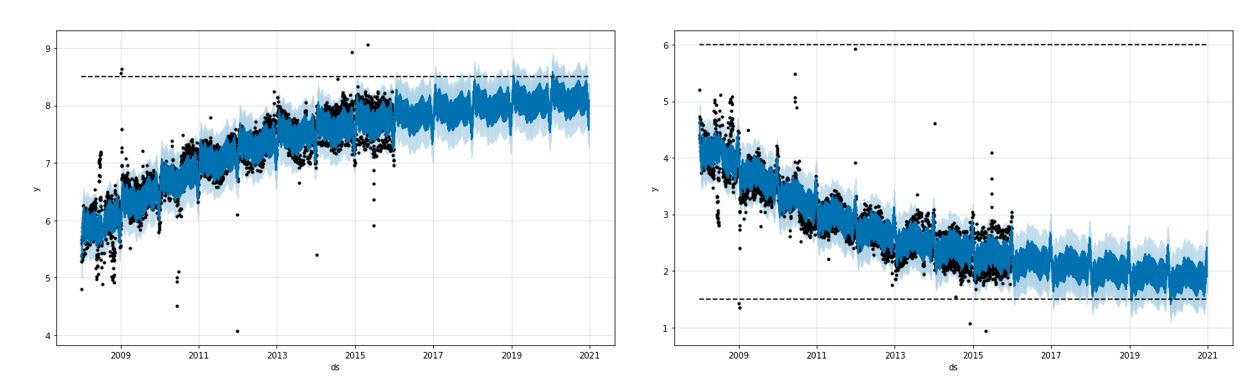
With domain knowledge at his/her disposal, an analyst can then define a varying capacity C(t) for the time series forecasts he/she is trying to make.
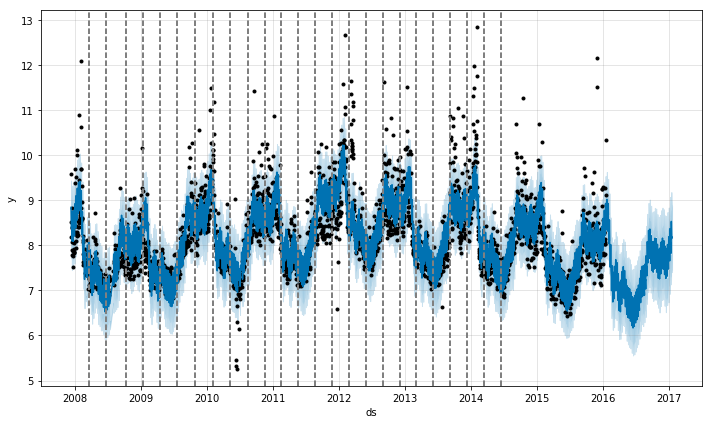
Changepoints
Another question to answer is whether my time series encounters any underlying changes in the phenomena e.g. a new product launch, unforeseen calamity etc. At such points, the growth rate is allowed to change. These changepoints are automatically selected. However, a user can also feed the changepoints manually if it is required. In the below plot, the dotted lines represent the changepoints for the given time series.
As the number of changepoints allowed is increased the fit becomes more flexible. There are basically 2 problems an analyst might face while working with the trend component:
- Overfitting
- Underfitting
A parameter called changepoint_prior_scale could be used to adjust the trend flexibility and tackle the above 2 problems. Higher value will fit a more flexible curve to the time series.
Seasonality
To fit and forecast the effects of seasonality, prophet relies on fourier series to provide a flexible model. Seasonal effects s(t) are approximated by the following function:
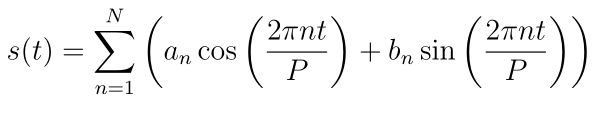
P is the period (365.25 for yearly data and 7 for weekly data)
Parameters [a1, b1, ….., aN, bN] need to be estimated for a given N to model seasonality.
The fourier order N that defines whether high frequency changes are allowed to be modelled is an important parameter to set here. For a time series, if the user believes the high frequency components are just noise and should not be considered for modelling, he/she could set the values of N from to a lower value. If not, N can be tuned to a higher value and set using the forecast accuracy.
Holidays and events
Holidays and events incur predictable shocks to a time series. For instance, Diwali in India occurs on a different day each year and a large portion of the population buy a lot of new items during this period.
Prophet allows the analyst to provide a custom list of past and future events. A window around such days are considered separately and additional parameters are fitted to model the effect of holidays and events.
Prophet in action (using Python)
Currently implementations of Prophet are available in both Python and R. They have exactly the same features.
Prophet() function is used do define a Prophet forecasting model in Python. Let us look at the most important parameters:
3.1 Trend parameters
| Parameter | Description |
| growth | linear’ or ‘logistic’ to specify a linear or logistic trend |
| changepoints | List of dates at which to include potential changepoints (automatic if not specified) |
| n_changepoints | If changepoints in not supplied, you may provide the number of changepoints to be automatically included |
| changepoint_prior_scale | Parameter for changing flexibility of automatic changepoint selection |
3.2 Seasonality & Holiday Parameters
| Parameter | Description |
| yearly_seasonality | Fit yearly seasonality |
| weekly_seasonality | Fit weekly seasonality |
| daily_seasonality | Fit daily seasonality |
| holidays | Feed dataframe containing holiday name and date |
| seasonality_prior_scale | Parameter for changing strength of seasonality model |
| holiday_prior_scale | Parameter for changing strength of holiday model |
yearly_seasonality, weekly_seasonality & daily_seasonality can take values as True, False and no of fourier terms which was discussed in the last section. If the value is True, default number of fourier terms (10) are taken. Prior scales are defined to tell the model how strongly it needs to consider the seasonal/holiday components while fitting and forecasting.
Predicting passsenger traffic using Prophet
Now that we are well versed with nuts and bolts of this amazing tool. Lets dive into a real dataset to see its potential. Here I have used Prophet in python for one of the practice problems available on datahack platform at this link.
The dataset is a univariate time series that contains hourly passenger traffic for a new public transport service. We are trying to forecast the traffic for next 7 months given historical traffic data of last 25 months. Basic EDA for this can be accessed from this course.
Python Code:
We see that this time series has a lot of noise. We could re-sample it day wise and sum to get a new series with reduced and noise and thereby easier to model.
# Calculate average hourly fraction
hourly_frac = train.groupby(['hour']).mean()/np.sum(train.groupby(['hour']).mean())
hourly_frac.drop(['ID'], axis = 1, inplace = True)
hourly_frac.columns = ['fraction']


# convert to time series from dataframe
train.index = train.Datetime
train.drop(['ID','hour','Datetime'], axis = 1, inplace = True)

daily_train = train.resample('D').sum()
Prophet requires the variable names in the time series to be:
- y – Target
- ds – Datetime
So, the next step is to convert the dataframe according to the above specifications
daily_train['ds'] = daily_train.index
daily_train['y'] = daily_train.Count
daily_train.drop(['Count'],axis = 1, inplace = True)
Fitting the prophet model:
m = Prophet(yearly_seasonality = True, seasonality_prior_scale=0.1)
m.fit(daily_train)
future = m.make_future_dataframe(periods=213)
forecast = m.predict(future)
We can look at the various components using the following command:
m.plot_components(forecast)
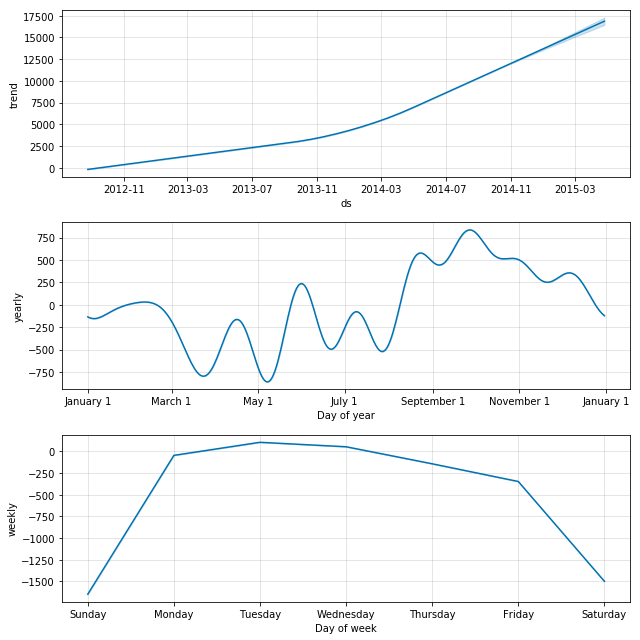
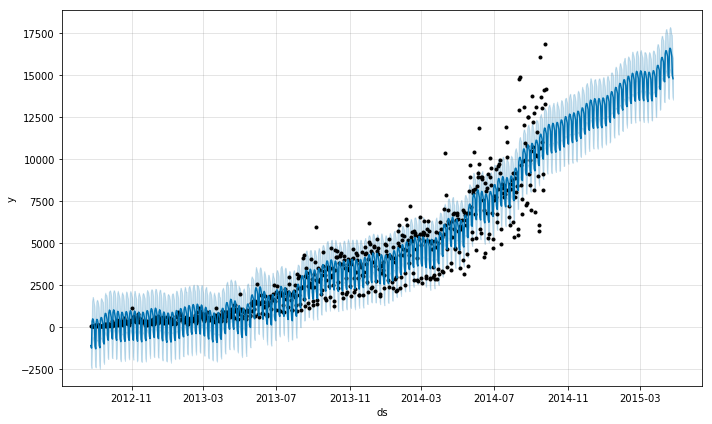
Using the mean hourly fraction for each hour from 0 to 23, we could then convert the daily forecasts into hourly forecasts make submission. This is how our forecasts over the daily data looks like.
# Extract hour, day, month and year from both dataframes to merge
for df in [test, forecast]:
    df['hour'] = df.Datetime.dt.hour
    df['day'] = df.Datetime.dt.day
    df['month'] = df.Datetime.dt.month
    df['year'] = df.Datetime.dt.year

# Merge forecasts with given IDs
test = pd.merge(test,forecast, on=['day','month','year'], how='left')
cols = ['ID','hour','yhat']
test_new = test[cols]

# Merging hourly average fraction to the test data
test_new = pd.merge(test_new, hourly_frac, left_on = ['hour'], right_index=True, how = 'left')
# Convert daily aggregate to hourly traffic
test_new['Count'] = test_new['yhat'] * test_new['fraction']
test_new.drop(['yhat','fraction','hour'],axis = 1, inplace = True)
test_new.to_csv('prophet_sub.csv',index = False)
This gets a score of 206 on the public leaderboard and does produce a stable model. Readers can go ahead and tweak the hyperparameters (fourier order for seasonality/changeover) to get a better score. Reader could also try and use a different technique to convert the daily predictions to hourly data for submission and may get a better score.
R Code
Implementation in R for the same problem statement is given below.
library(prophet)
library(data.table)
library(dplyr)
library(ggplot2)

# read data
train = fread("Train_SU63ISt.csv")
test = fread("Test_0qrQsBZ.csv")

# Extract date from the Datetime variable
train$Date = as.POSIXct(strptime(train$Datetime, "%d-%m-%Y"))
test$Date = as.POSIXct(strptime(test$Datetime, "%d-%m-%Y"))

# Convert 'Datetime' variable from character to date-time format
train$Datetime = as.POSIXct(strptime(train$Datetime, "%d-%m-%Y %H:%M"))
test$Datetime = as.POSIXct(strptime(test$Datetime, "%d-%m-%Y %H:%M"))

# Aggregate train data day-wise
aggr_train = train[,list(Count = sum(Count)), by = Date]

# Visualize the data
ggplot(aggr_train) + geom_line(aes(Date, Count))

# Change column names
names(aggr_train) = c("ds", "y")

# Model building
m = prophet(aggr_train)
future = make_future_dataframe(m, periods = 213)
forecast = predict(m, future)

# Visualize forecast
plot(m, forecast)

# proportion of mean hourly 'Count' based on train data
mean_hourly_count = train %>%
 group_by(hour = hour(train$Datetime)) %>%
 summarise(mean_count = mean(Count))

s = sum(mean_hourly_count$mean_count)
mean_hourly_count$count_proportion = mean_hourly_count$mean_count/s

# variable to store hourly Count
test_count = NULL

for(i in 763:nrow(forecast)){
 test_count = append(test_count, mean_hourly_count$count_proportion * forecast$yhat[i])
}

test$Count = test_count
End Notes
Prophet certainly is a good choice for producing quick accurate forecasts. It has intuitive parameters that can be tweaked by someone who has good domain knowledge but lacks technical skills in forecasting models. Readers can also try and fit Prophet directly over the hourly data and discuss in the comments if they are able to get a better result.
IIT Bombay Graduate with a Masters and Bachelors in Electrical Engineering. I have previously worked as a lead decision scientist for Indian National Congress deploying statistical models (Segmentation, K-Nearest Neighbours) to help party leadership/Team make data-driven decisions. My interest lies in putting data in heart of business for data-driven decision making.


Great article, Ankit! Learned a lot about a different approach to doing time series.
Where is 'Train_SU63ISt.csv file.
You can download this dataset from this practice problem page: https://datahack.analyticsvidhya.com/contest/practice-problem-time-series-2/
Great job Ankit ! However I think something is missing. By example, there's no feature named "hour" or "fraction" or "D" in train dataset in python code, I mean. Thank you
Hi Gianni, Thanks for notifying me about the error. It turns out a code snippet was missing in the article. I have made the necessary updates and these should reflect in the article soon.'fraction' is contained inside the dataframe hourly_frac which is then multiplied with daily forecasts to reproduce hourly forecasts. 'D' is not a feature, its an attribute we are providing to resample function in Pandas library.
How is it differing from the ARIMA model?
That's a good question. Prophet is based on curve fitting while an ARIMA model can be viewed as a “filter” that tries to separate the signal from the noise, and the signal is then extrapolated into the future to obtain forecasts.
Someday could you do an article on changepoint detection, please? Thank you.
I second this request - changepoint detection would be very useful. I'd greatly appreciate it if someone could post some useful links on this topic. Thanks,
Can you draw a comparison of Prophet wrt other Time series models such as ARIMA or Regression methods. It would be helpful
on running this code - for df in [test, forecast]: df['hour'] = df.Datetime.dt.hour df['day'] = df.Datetime.dt.day df['month'] = df.Datetime.dt.month df['year'] = df.Datetime.dt.year getting error Traceback (most recent call last): File "", line 44, in df['hour'] = df.Datetime.dt.hour File "D:\anaconda5.1\lib\site-packages\pandas\core\generic.py", line 3614, in __getattr__ return object.__getattribute__(self, name) AttributeError: 'DataFrame' object has no attribute 'Datetime'
Hi Kabir, I have made some updates to the code. Seems like a code snippet was missing. Please check it again.
Hi Ankit, Very helpful article. I created a small app on prophet in Shiny. https://gkourogiorgas.shinyapps.io/ProphetForecasting/ Please take a look and let me know of improvements. I am interested in parametrizing further the app but I am lacking some knowledge in prophet. I you are willing to cover the gap then we could work together
> aggr_train = train[,list(Count = sum(Count)),by=train$Date] Error in `[.data.frame`(train, , list(Count = sum(Count)), by = train$Date) : unused argument (by = train$Date)
Hi Rohini, Can you give me more insight into the issue you are facing?
install 'data.table' package
Ankit , I want to understand how does it manage Multivariate things specially outliers like price and Weather Also , is the Univariate output not baised ( Co-efficient) Will this hold true in case of outliers E,g Stock Markets - based on results or Price Elasticity
Right now, it does not support multivariate time series. Prophet is robust to outliers, if the outliers are periodic/correspond to an event, they can be handled using the holiday functionality.
Hi, im confused. Is Facebook Prophet is a machine learning method? Under which method does this tool falls under?
Hi Ady, Prophet is a time series forecasting technique. If you are new to time series , you can go through this article : Comprehensive beginner's guide to time series forecasting
data set not available.
Hi Rohini, You can find the dataset in this link. Open the link and register for the practice problem. After that, you can find the dataset under the Data section.
How we can use this for large number of time series , for e.g. if we have 4000 time series to forecast , is it support by group processing or we have to call simply externally in the loop. Also does it do some reconciliation if we have product sales office hierarchy ?