Introduction
My latest data science project involved predicting the sales of each product in a particular store. There were several ways I could approach the problem. But no matter which model I used, my accuracy score would not improve.
I figured out the problem after spending some time inspecting the data – outliers!
This is a commonly overlooked mistake we tend to make. The temptation is to start building models on the data you’ve been given. But that’s essentially setting yourself up for failure.
There are no shortcuts to data exploration. Building models will only get you so far if you’ve skipped this stage of your data science project. After a point of time, you’ll hit the accuracy ceiling – the model’s performance just won’t budge.
Data exploration consists of many things, such as variable identification, treating missing values, feature engineering, etc. Detecting and treating outliers is also a major cog in the data exploration stage. The quality of your inputs decide the quality of your output!
PyOD is one such library to detect outliers in your data. It provides access to more than 20 different algorithms to detect outliers and is compatible with both Python 2 and 3. An absolute gem!
In this article, I will take you on a journey to understand outliers and how you can detect them using PyOD in Python.
This article assumes you have a basic knowledge of machine learning algorithms and the Python language. You can refer to this article -“Essentials of Machine Learning“, to understand or refresh these concepts.
Table of contents
What is an Outlier?
An outlier is any data point which differs greatly from the rest of the observations in a dataset. Let’s see some real life examples to understand outlier detection:
- When one student averages over 90% while the rest of the class is at 70% – a clear outlier
- While analyzing a certain customer’s purchase patterns, it turns out there’s suddenly an entry for a very high value. While most of his/her transactions fall below Rs. 10,000, this entry is for Rs. 1,00,000. It could be an electronic item purchase – whatever the reason, it’s an outlier in the overall data
- How about Usain Bolt? Those record breaking sprints are definitely outliers when you factor in the majority of athletes

There are a plethora of reasons why outliers exist. Perhaps an analyst made an error in the data entry, or the machine threw up an error in measurement, or the outlier could even be intentional! Some people do not want to disclose their information and hence input false information in forms.
Outliers are of two types: Univariate and Multivariate. A univariate outlier is a data point that consists of extreme values in one variable only, whereas a multivariate outlier is a combined unusual score on at least two variables. Suppose you have three different variables – X, Y, Z. If you plot a graph of these in a 3-D space, they should form a sort of cloud. All the data points that lie outside this cloud will be the multivariate outliers.
I would highly recommend you to read this amazing guide on data exploration which covers outliers in detail.
Why do we need to Detect Outliers?
Outliers can impact the results of our analysis and statistical modeling in a drastic way. Check out the below image to visualize what happens to a model when outliers are present versus when they have been dealt with:

But here’s the caveat – outliers aren’t always a bad thing. It’s very important to understand this. Simply removing outliers from your data without considering how they’ll impact the results is a recipe for disaster.
“Outliers are not necessarily a bad thing. These are just observations that are not following the same pattern as the other ones. But it can be the case that an outlier is very interesting. For example, if in a biological experiment, a rat is not dead whereas all others are, then it would be very interesting to understand why. This could lead to new scientific discoveries. So, it is important to detect outliers.”– Pierre Lafaye de Micheaux, Author and Statistician
Our tendency is to use straightforward methods like box plots, histograms and scatter-plots to detect outliers. But dedicated outlier detection algorithms are extremely valuable in fields which process large amounts of data and require a means to perform pattern recognition in larger datasets.
Applications like fraud detection in finance and intrusion detection in network security require intensive and accurate techniques to detect outliers. Can you imagine how embarrassing it would be if you detected an outlier and it turned out to be genuine?
The PyOD library can step in to bridge this gap. Let’s see what it’s all about.
Why should we use PyOD for Outlier Detection?
Numerous outlier detection packages exist in various programming languages. I particularly found these languages helpful in R. But when I switched to Python, there was a glaring lack of an outlier detection library. How was this even possible?!
Existing implementations like PyNomaly are not specifically designed for outlier detection (though it’s still worth checking out!). To fill this gap, Yue Zhao, Zain Nasrullah, and Zheng Li designed and implemented the PyOD library.
PyOD is a scalable Python toolkit for detecting outliers in multivariate data. It provides access to around 20 outlier detection algorithms under a single well-documented API.
Features of PyOD
PyOD has several advantages and comes with quite a few useful features. Here’s my pick of the bunch:
- Open Source with detailed documentation and examples across various algorithms
- Supports advanced models, including Neural Networks, Deep Learning, and Outlier Ensembles
- Optimized performance with JIT (Just in Time) and parallelization using numba and joblib
- Compatible with both Python 2 & 3
Installing PyOD in Python
Time to power up our Python notebooks! Let’s first install PyOD on our machines:
pip install pyod
pip install --upgrade pyod  # to make sure that the latest version is installed!
As simple as that!
Note that PyOD also contains some neural network based models which are implemented in Keras. PyOD will NOT install Keras or TensorFlow automatically. You will need to install Keras and other libraries manually if you want to use neural net based models.
Outlier Detection Algorithms used in PyOD
Let’s see the outlier detection algorithms that power PyOD. It’s well and good implementing PyOD but I feel it’s equally important to understand how it works underneath. This will give you more flexibility when you’re using it on a dataset.
Note: We will be using a term Outlying score in this section. It means every model, in some way, scores a data point than uses threshold value to determine whether the point is an outlier or not.
Angle-Based Outlier Detection (ABOD)
- It considers the relationship between each point and its neighbor(s). It does not consider the relationships among these neighbors. The variance of its weighted cosine scores to all neighbors could be viewed as the outlying score
- ABOD performs well on multi-dimensional data
- PyOD provides two different versions of ABOD:
- Fast ABOD: Uses k-nearest neighbors to approximate
- Original ABOD: Considers all training points with high-time complexity
k-Nearest Neighbors Detector
- For any data point, the distance to its kth nearest neighbor could be viewed as the outlying score
- PyOD supports three kNN detectors:
- Largest: Uses the distance of the kth neighbor as the outlier score
- Mean: Uses the average of all k neighbors as the outlier score
- Median: Uses the median of the distance to k neighbors as the outlier score
Isolation Forest
- It uses the scikit-learn library internally. In this method, data partitioning is done using a set of trees. Isolation Forest provides an anomaly score looking at how isolated the point is in the structure. The anomaly score is then used to identify outliers from normal observations
- Isolation Forest performs well on multi-dimensional data
Histogram-based Outlier Detection
- It is an efficient unsupervised method which assumes the feature independence and calculates the outlier score by building histograms
- It is much faster than multivariate approaches, but at the cost of less precision
Local Correlation Integral (LOCI)
- LOCI is very effective for detecting outliers and groups of outliers. It provides a LOCI plot for each point which summarizes a lot of the information about the data in the area around the point, determining clusters, micro-clusters, their diameters, and their inter-cluster distances
- None of the existing outlier-detection methods can match this feature because they output only a single number for each point
Feature Bagging
- A feature bagging detector fits a number of base detectors on various sub-samples of the dataset. It uses averaging or other combination methods to improve the prediction accuracy
- By default, Local Outlier Factor (LOF) is used as the base estimator. However, any estimator could be used as the base estimator, such as kNN and ABOD
- Feature bagging first constructs n sub-samples by randomly selecting a subset of features. This brings out the diversity of base estimators. Finally, the prediction score is generated by averaging or taking the maximum of all base detectors
Clustering Based Local Outlier Factor
- It classifies the data into small clusters and large clusters. The anomaly score is then calculated based on the size of the cluster the point belongs to, as well as the distance to the nearest large cluster
Extra Utilities provided by PyOD
- A function generate_data can be used to generate random data with outliers. Inliers data is generated by a multivariate Gaussian distribution and outliers are generated by a uniform distribution.
- We can provide our own values of outliers fraction and the total number of samples that we want in our dataset. We will use this utility function to create data in the implementation part.
Implementation of PyOD
Enough talk – let’s see some action. In this section, we’ll implement the PyOD library in Python. I’m going to use two different approaches to demonstrate PyOD:
- Using a simulated dataset
- Using a real-world dataset – The Big Mart Sales Challenge
PyOD on a Simulated Dataset
First, let’s import the required libraries:
import numpy as np
from scipy import stats
import matplotlib.pyplot as plt
%matplotlib inline
import matplotlib.font_manager
Now, we’ll import the models we want to use to detect the outliers in our dataset. We will be using ABOD (Angle Based Outlier Detector) and KNN (K Nearest Neighbors):
from pyod.models.abod import ABOD
from pyod.models.knn import KNN
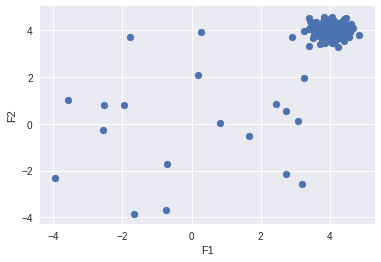
Now, we will create a random dataset with outliers and plot it.
Python Code:
Create a dictionary and add all the models that you want to use to detect the outliers:
classifiers = {
     'Angle-based Outlier Detector (ABOD)'   : ABOD(contamination=outlier_fraction),
     'K Nearest Neighbors (KNN)' :  KNN(contamination=outlier_fraction)
}
Fit the data to each model we have added in the dictionary, Then, see how each model is detecting outliers:
#set the figure size
plt.figure(figsize=(10, 10))

for i, (clf_name,clf) in enumerate(classifiers.items()) :
    # fit the dataset to the model
    clf.fit(X_train)

    # predict raw anomaly score
    scores_pred = clf.decision_function(X_train)*-1

    # prediction of a datapoint category outlier or inlier
    y_pred = clf.predict(X_train)

    # no of errors in prediction
    n_errors = (y_pred != Y_train).sum()
    print('No of Errors : ',clf_name, n_errors)

    # rest of the code is to create the visualization

    # threshold value to consider a datapoint inlier or outlier
    threshold = stats.scoreatpercentile(scores_pred,100 *outlier_fraction)

    # decision function calculates the raw anomaly score for every point
    Z = clf.decision_function(np.c_[xx.ravel(), yy.ravel()]) * -1
    Z = Z.reshape(xx.shape)

    subplot = plt.subplot(1, 2, i + 1)

    # fill blue colormap from minimum anomaly score to threshold value
    subplot.contourf(xx, yy, Z, levels = np.linspace(Z.min(), threshold, 10),cmap=plt.cm.Blues_r)

    # draw red contour line where anomaly score is equal to threshold
    a = subplot.contour(xx, yy, Z, levels=[threshold],linewidths=2, colors='red')

    # fill orange contour lines where range of anomaly score is from threshold to maximum anomaly score
    subplot.contourf(xx, yy, Z, levels=[threshold, Z.max()],colors='orange')

    # scatter plot of inliers with white dots
    b = subplot.scatter(X_train[:-n_outliers, 0], X_train[:-n_outliers, 1], c='white',s=20, edgecolor='k')
    # scatter plot of outliers with black dots
    c = subplot.scatter(X_train[-n_outliers:, 0], X_train[-n_outliers:, 1], c='black',s=20, edgecolor='k')
    subplot.axis('tight')

    subplot.legend(
        [a.collections[0], b, c],
        ['learned decision function', 'true inliers', 'true outliers'],
        prop=matplotlib.font_manager.FontProperties(size=10),
        loc='lower right')

    subplot.set_title(clf_name)
    subplot.set_xlim((-10, 10))
    subplot.set_ylim((-10, 10))
plt.show()
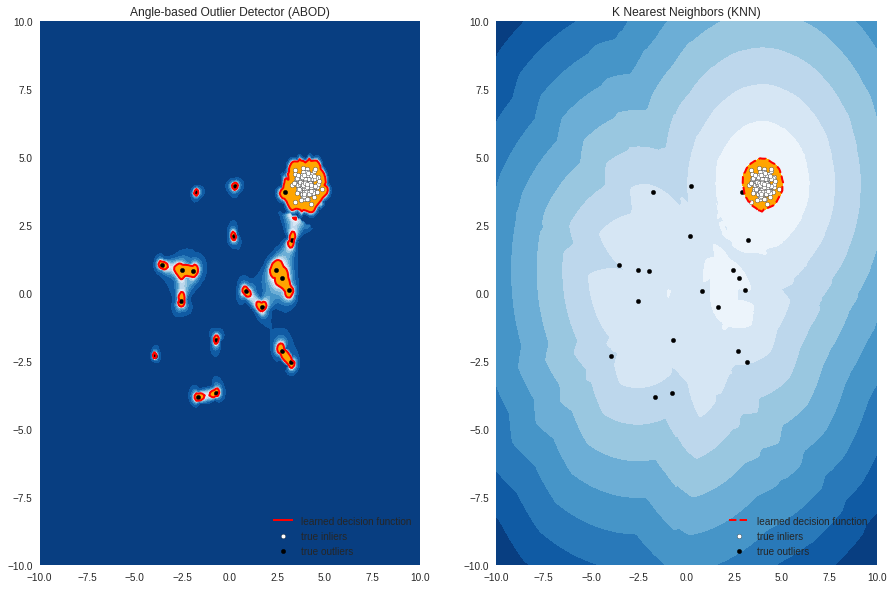
Looking good!
PyOD on the Big Mart Sales Problem
Now, let’s see how PyOD does on the famous Big Mart Sales Problem.
Go ahead and download the dataset from the above link. Let’s start with importing the required libraries and loading the data:
import pandas as pd
import numpy as np

# Import models
from pyod.models.abod import ABOD
from pyod.models.cblof import CBLOF
from pyod.models.feature_bagging import FeatureBagging
from pyod.models.hbos import HBOS
from pyod.models.iforest import IForest
from pyod.models.knn import KNN
from pyod.models.lof import LOF
# reading the big mart sales training data
df = pd.read_csv("train.csv")
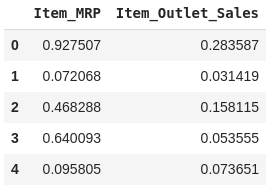
Let’s plot Item MRP vs Item Outlet Sales to understand the data:
df.plot.scatter('Item_MRP','Item_Outlet_Sales')
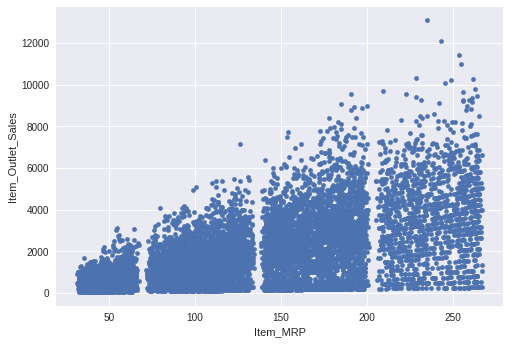
The range of Item Outlet Sales is from 0 to 12000 and Item MRP is from 0 to 250. We will scale down both these features to a range between 0 and 1. This is required to create a explainable visualization (it will become way too stretched otherwise). As for this data, using the same approach will take much more time to create the visualization.
Note: If you don’t want the visualization, you can use the same scale to predict whether a point is an outlier or not.
from sklearn.preprocessing import MinMaxScaler

scaler = MinMaxScaler(feature_range=(0, 1))
df[['Item_MRP','Item_Outlet_Sales']] = scaler.fit_transform(df[['Item_MRP','Item_Outlet_Sales']])
df[['Item_MRP','Item_Outlet_Sales']].head()
Store these values in the NumPy array for using in our models later:
X1 = df['Item_MRP'].values.reshape(-1,1)
X2 = df['Item_Outlet_Sales'].values.reshape(-1,1)

X = np.concatenate((X1,X2),axis=1)
Again, we will create a dictionary. But this time, we will add some more models to it and see how each model predicts outliers.
You can set the value of the outlier fraction according to your problem and your understanding of the data. In our example, I want to detect 5% observations that are not similar to the rest of the data. So, I’m going to set the value of outlier fraction as 0.05.
random_state = np.random.RandomState(42)
outliers_fraction = 0.05
# Define seven outlier detection tools to be compared
classifiers = {
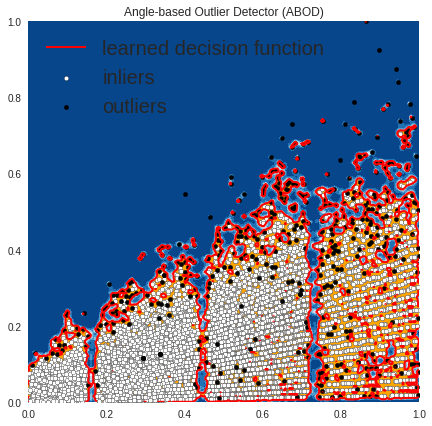
'Angle-based Outlier Detector (ABOD)': ABOD(contamination=outliers_fraction),
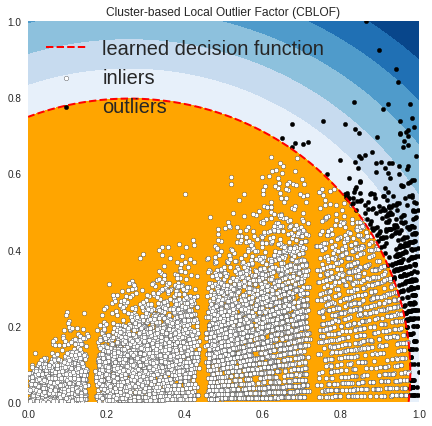
'Cluster-based Local Outlier Factor (CBLOF)':CBLOF(contamination=outliers_fraction,check_estimator=False, random_state=random_state),
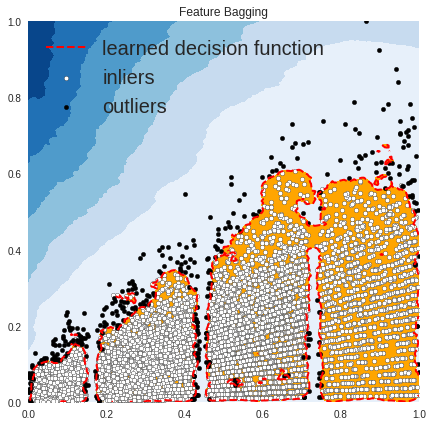
'Feature Bagging':FeatureBagging(LOF(n_neighbors=35),contamination=outliers_fraction,check_estimator=False,random_state=random_state),
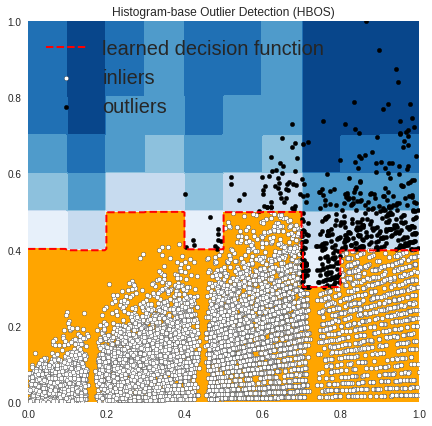
'Histogram-base Outlier Detection (HBOS)': HBOS(contamination=outliers_fraction),
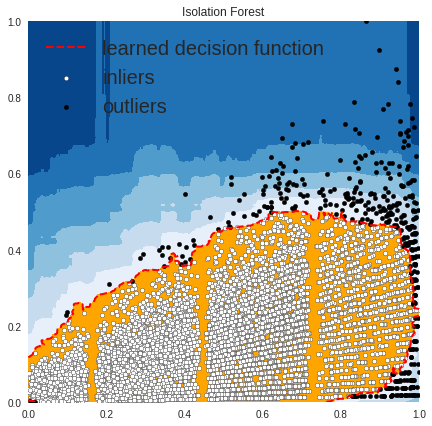
'Isolation Forest': IForest(contamination=outliers_fraction,random_state=random_state),
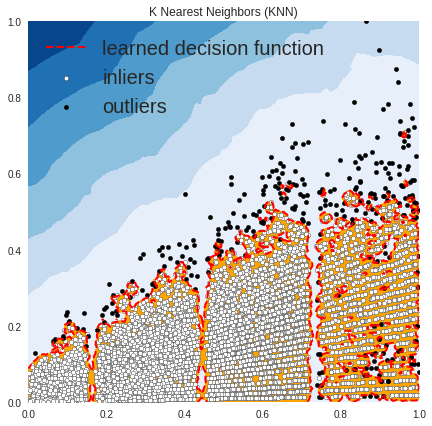
'K Nearest Neighbors (KNN)': KNN(contamination=outliers_fraction),
'Average KNN': KNN(method='mean',contamination=outliers_fraction)
}
Now, we will fit the data to each model one by one and see how differently each model predicts the outliers.
xx , yy = np.meshgrid(np.linspace(0,1 , 200), np.linspace(0, 1, 200))

for i, (clf_name, clf) in enumerate(classifiers.items()):
    clf.fit(X)
    # predict raw anomaly score
    scores_pred = clf.decision_function(X) * -1

    # prediction of a datapoint category outlier or inlier
    y_pred = clf.predict(X)
    n_inliers = len(y_pred) - np.count_nonzero(y_pred)
    n_outliers = np.count_nonzero(y_pred == 1)
    plt.figure(figsize=(10, 10))

    # copy of dataframe
    dfx = df
    dfx['outlier'] = y_pred.tolist()

    # IX1 - inlier feature 1,  IX2 - inlier feature 2
    IX1 =  np.array(dfx['Item_MRP'][dfx['outlier'] == 0]).reshape(-1,1)
    IX2 =  np.array(dfx['Item_Outlet_Sales'][dfx['outlier'] == 0]).reshape(-1,1)

    # OX1 - outlier feature 1, OX2 - outlier feature 2
    OX1 =  dfx['Item_MRP'][dfx['outlier'] == 1].values.reshape(-1,1)
    OX2 =  dfx['Item_Outlet_Sales'][dfx['outlier'] == 1].values.reshape(-1,1)

    print('OUTLIERS : ',n_outliers,'INLIERS : ',n_inliers, clf_name)

    # threshold value to consider a datapoint inlier or outlier
    threshold = stats.scoreatpercentile(scores_pred,100 * outliers_fraction)

    # decision function calculates the raw anomaly score for every point
    Z = clf.decision_function(np.c_[xx.ravel(), yy.ravel()]) * -1
    Z = Z.reshape(xx.shape)

    # fill blue map colormap from minimum anomaly score to threshold value
    plt.contourf(xx, yy, Z, levels=np.linspace(Z.min(), threshold, 7),cmap=plt.cm.Blues_r)

    # draw red contour line where anomaly score is equal to thresold
    a = plt.contour(xx, yy, Z, levels=[threshold],linewidths=2, colors='red')

    # fill orange contour lines where range of anomaly score is from threshold to maximum anomaly score
    plt.contourf(xx, yy, Z, levels=[threshold, Z.max()],colors='orange')

    b = plt.scatter(IX1,IX2, c='white',s=20, edgecolor='k')

    c = plt.scatter(OX1,OX2, c='black',s=20, edgecolor='k')

    plt.axis('tight')

    # loc=2 is used for the top left corner
    plt.legend(
        [a.collections[0], b,c],
        ['learned decision function', 'inliers','outliers'],
        prop=matplotlib.font_manager.FontProperties(size=20),
        loc=2)

    plt.xlim((0, 1))
    plt.ylim((0, 1))
    plt.title(clf_name)
    plt.show()
OUTPUT
OUTLIERS : 447 INLIERS : 8076 Angle-based Outlier Detector (ABOD)
OUTLIERS : 427 INLIERS : 8096 Cluster-based Local Outlier Factor (CBLOF)
OUTLIERS : 386 INLIERS : 8137 Feature Bagging
OUTLIERS : 501 INLIERS : 8022 Histogram-base Outlier Detection (HBOS)
OUTLIERS : 427 INLIERS : 8096 Isolation Forest
OUTLIERS : 311 INLIERS : 8212 K Nearest Neighbors (KNN)
OUTLIERS : 176 INLIERS : 8347 Average KNN
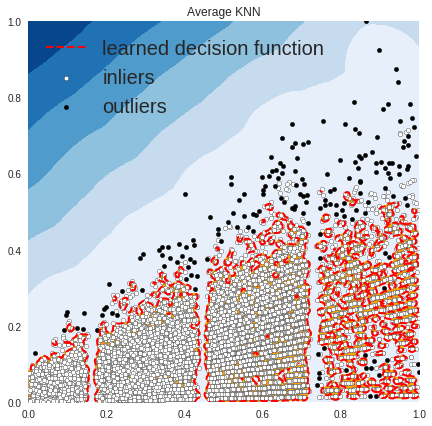
In the above plots, the white points are inliers surrounded by red lines, and the black points are outliers in the blue zone.
Frequently Asked Questions
Q1. What is PyOD in Python?
A. PyOD (Python Outlier Detection) is a Python library that provides a collection of outlier detection algorithms. It offers a wide range of techniques, including statistical approaches, proximity-based methods, and advanced machine learning models. PyOD is used for detecting and identifying anomalies or outliers in datasets using a variety of statistical and algorithmic techniques.
Q2. How to install PyOD in Python?
A. To install PyOD in Python, you can use the pip package manager. Open your command prompt or terminal and run the following command:
pip install pyod
This will download and install the PyOD library and its dependencies, allowing you to use it in your Python projects.
End Notes
That was an incredible learning experience for me as well. I spent a lot of time researching PyOD and implementing it in Python. I would encourage you to do the same. Practice using it on different datasets – it’s such a useful library!
PyOD already supports around 20 classical outlier detection algorithms which can be used in both academic and commercial projects. Its contributors are planning to enhance the toolbox by implementing models that will work well with time series and geospatial data.
If you have any suggestions/feedback related to the article, please post them in the comments section below. I look forward to hearing your experience using PyOD as well. Happy learning.
Check out the below awesome courses to learn data science and it’s various aspects:


Great post!, I hope you write a second edition talking about categorical features and examples with n variables>2
Hello Lakshay, amazing article, but please do add this line in the import section: from pyod.models.lof import LOF also these modifie lines X1 = df['Item_MRP'].values.reshape(-1,1) X2 = df['Item_Outlet_Sales'].values.reshape(-1,1) Thanks again
Hi, Ibrahem Kandel Thanks for pointing it out. I have updated the code.
Really, nice article.
Thanks, Gaurav
Thanks for this Lakshay, this is really interesting. How would you compare the performance of each model in the Big Mart sales example? Would you have to do a train test split with the data or is there a easier way to do so that I'm missing?
Hi Lakshay, Good article. Would have liked if you provided a complete forecasting. After identifying outliers how do you account them while predicting sales. I can see the outliers but how does it help me in predicting sales , is my question.
Great Post! Thank you for the knowledge you shared. I have some questions: How to optimize hyper-parameters? What are the hyper-parameters here (I see contamination is a hyper-parameter but there should be more)
why you did this *-1? Please help with more understanding. # predict raw anomaly score scores_pred = clf.decision_function(X_train)*-1 # prediction of a datapoint category outlier or inlier y_pred = clf.predict(X_train) # no of errors in prediction n_errors = (y_pred != Y_train).sum() print('No of Errors : ',clf_name, n_errors) # rest of the code is to create the visualization # threshold value to consider a datapoint inlier or outlier threshold = stats.scoreatpercentile(scores_pred,100 *outlier_fraction) # decision function calculates the raw anomaly score for every point Z = clf.decision_function(np.c_[xx.ravel(), yy.ravel()]) * -1
Awesome Experience. Thanx Gaurav. I would like to ask one thing, is there any way of partail_fit or batch size learning or online learning whatever you called but I mean retraining with the new instances inclusive of the previously trained model. Thanx, once again Gaurav...
Hi Lakshay, Thanks for this article. a part from numpy, pandas and KNN I can't install other packages, it gives below error: Could not find a version that satisfies the requirement ABOD (from versions: ) No matching distribution found for ABOD Can you please advice, I am using Python 3
Hello Lakshay, Thank you for such a detailed article on outliers. I am working on a similar task using abod. I would want to remove the datapoints from my original data set which are identified as outliers. How can I do it? Can I use inverse_transform method on the scaled data to point back to my original data? Also, how do I map the outliers to the original values?
Hi Sameera, The predict function will either return 0(for inliers) and 1(for outliers). One approach that you can follow is creating a copy of the original data do transform and predict the outliers. Now, add another column to the original data frame with the predicted list (that has values 0 or 1) and filter the data (with values = 0).
Hello, I want to know how can we compare the above mentioned techniques of ML for Outlier detection?
What is the best method for detection and removing outliers in the seasonal data? Is there any library in python to detect seasonal data outliers?
Hi Lakshay. Can you elaborate on how to evaluate each model using performance metrics (like F1 score)
I am using ABOD for outlier detection Program: X1 = np.array([1,2,3,2,1,88,9,7,1,2,3,2]).reshape(-1, 1) scaler = MinMaxScaler(feature_range=(0, 1)) X1 = scaler.fit_transform(X1) clf = ABOD(contamination=0.05) clf.fit(X1) scores_pred = clf.decision_function(X1)*-1 y_pred = clf.predict(X1) print(scores_pred) OUTPUT: array([0.00000000e+00, nan, 0.00000000e+00, nan, 0.00000000e+00, 1.65385505e-03, 4.31275015e+04, 4.22959564e+05, 0.00000000e+00, nan, 0.00000000e+00, nan]) Question: If you see the output file carefully, there are some nan values as scores. Because of this my clf.threshold_ is also giving nan as value. and hence y_pred is not giving any ones in the array however large the outlier is. How should I prevent this and get the outliers for the data?
Hi Surya, First of all, if you are trying to predict the value 88 ( only 1 value) as outlier then set the contamination to be (1/12 = 0.083) and since ABOD uses KNN and considers only 5 neighbors to approximate the outlying score and most of the data points are similar in small dataset (if you take all different points your model will able to predict 88 as outlier)so I believe that could be one of the reasons why we are getting nan values here. You can use method = 'default' instead which is slow but it considers all points in your dataset and you will get the desired output. # update this line clf = ABOD(contamination=0.083,method='default')
Hi LAKSHAY, Thanks for the great tutorial. I have a question. What is the difference sklearn (Isolation Forest or LOF) and PyOd(Isolation Forest or LOC) ? . Could you give more information about that? Thanks.
Excellent one man
Great, these algorithms give you the number of outliers and inliers(OUTLIERS : 176 INLIERS : 8347 Average KNN), but how to filter the data to get rid of data points that are outliers?
Hi Emmanuel, The predict function will either return 0 for inliers or 1 for outliers for each of the data points. So you can easily remove the points where the predicted value is 1.
Thanks Lakshay. The article is quite informative. Just one question. How about when data contains mixed attributes i.e. numerical as well as categorical attributes? Assuming we one hot encode the categorical attributes and then use the above methods, Would it make sense?
Hi Lakshay, I have one dimensional data (i.e only one feature) and I dont know about which data points are outliers. Which algorithm would you recommend to detect the outliers from this data? My main aim is to find the indices of the outliers. How should I go about it?
Hi Lakshay The Article was Good! with Clear Explanation keep it up! it would be very nice if you can explain end to end project Thanks
how to make a dataset from my system logs i am tying to make a log analytics based system which can identify bug or issue by finding anomalies in logs. please advise
Hi Lakshya, Thanks for the article. Any libraries in Python to predict outliers/anomalies in univariate data, probably unsupervised learning? Thanks in advance
Thanks for this great insights. Is it good to remove the outliers after detecting them, or what's the best method to treat them?
Hi Friend . I am development one algorithm for outliers detection, how i put just one column in model (just IX1 and OX1) ?