Overview
- Pandas is the most popular Python library in data science
- From building Pandas dataframes to manipulating data using Pandas, this library is the ultimate Swiss Army Knife
- Pandas 1.0 was recently released and we cover all the major updates in the article
Introduction
There are only a handful of libraries that elicit an instant look of appreciation in a wide variety of developers and programmers. These libraries are role-agnostic – professionals and aspirants across the world have either used them in their jobs or at least know what it does.
Pandas is one such library. In fact, Pandas is the 4th most used library/framework in the world (according to StackOverflow’s popular survey). That’s a remarkable feat!
Any data science enthusiast will agree – Pandas is the first library we import when we fire up our Jupyter notebooks. It is a super flexible tool that enables us to perform data manipulation and data analysis on Pandas dataframes in double-quick time. It’s personally one of my favorite things about Python!

Pandas has seen a number of updates in the recent past with minor changes across the board in each release. But the latest release – Pandas 1.0 – brings major changes and new features every data scientist would love to work with.
I loved experimenting with these new features and have picked out my top 4 in this article. I’ve also included the code blocks to help you understand and replicate each feature on your own machine.
Are you new to the world of Python? Here’s the perfect (free) course to get you started:
Table of Contents
- Welcome to the World of Pandas (Python’s Data Analysis Library)
- Top Features of Pandas 1.0
-
- Dedicated DataTypes for strings
- New Scalar for Missing Values
- Improved Data Information Table
- Markdown format for Dataframes
-
Welcome to the World of Pandas (Python’s Data Analysis Library)
Data analysis is a crucial part of the machine learning lifecycle. It involves inspecting the data, understanding each component, and generating useful insights from the data at hand. Having an in-depth understanding of the data will help you in every aspect of your project, whether that’s a machine learning hackathon or crucial business decisions.
There are a plethora of tools out there that can help us analyze and understand our data. I’m sure you’ve worked on (or at least heard of) the likes of MS Excel, SAS, Python, R and more. I personally prefer Python and I have been using it for data analysis and visualization since I started working in the data science space.
And that’s where the power of the Pandas library comes into play. It is designed for quick and easy data manipulation, reading, aggregation, and basic visualization. If you’re a regular Pandas user (who isn’t?), you’ll Pandas 1.0.
There’s an important point you should note if you’re using an older Python version:
This latest Pandas version drops support for Python 2.x. Pandas 1.0 requires Python version 3.6 or higher!
You can check your current version of Python using the below command:
python --version

Python 3.6.8 :: Anaconda custom (64-bit)
The current version of Python installed in my system is 3.6.8. If you have any older version with 2.x in the name, you must upgrade it before you install the new version of Pandas.
To install the latest version of Pandas (still a release candidate), you will have to use the below command:
$ pip install --upgrade pandas==1.0.0rc0
To check if the installation is successful, use the command pip show pandas in terminal:
$ pip show pandas

Name: pandas
Version: 1.0.0rc0
Summary: Powerful data structures for data analysis, time series, and statistics
All done! Let’s go ahead and explore a few key features in Pandas 1.0.
Top Features of Pandas 1.0
There are some really exciting additions in this new version of pandas and a number of bug fixes. You can check out the complete list of enhancements and bug fixes on the official Pandas site. In this article, I have listed down some major features and how they can be useful during the data analysis process.
1. Dedicated Datatype for Strings
This feature really caught my attention!
There are different techniques to analyze different types of variables or features in our data. Hence, it is important to correctly identify the type of the variable we are dealing with before we dive deeper into the data analysis process.
In the previous versions of Pandas, we had a different datatype for integer and float values (int and float respectively), while everything else would fall under the datatype ‘object’. This meant that the strings or texts would also be classified as objects.
Let’s look at an example:

We can see that the labels are categories while the tweets column contains strings. When we load this data in Python, the datatype assigned to both the columns is ‘object’:
tweets_data.dtypes
Output:
id        int64
label    object
tweet    object
dtype: object
This is because Pandas had only one datatype for both – categories and strings. Not anymore!
Pandas 1.0 introduces a dedicated datatype for strings. We can easily change the datatype using the astype() function:
tweets_data['tweet'] = tweets_data['tweet'].astype("string")
tweets_data.dtypes
Output:
id        int64
label    object
tweet    string
dtype: object
This will be really useful when we have a mix of categorical and text-based columns in our data. For instance, if we want to separately analyze just the string columns, we can use the select_dtypes() function in the following manner:
tweets_data.select_dtypes("string")

This will give us only the columns with datatype set to strings. Now we can easily separate and analyze categorical and text-based features!
2. New Scalar for Missing Values
We often extract data from different sources and can have missing or ambiguous values denoted as “not available” or “missing”. Usually, these values are replaced with np.nan or None or pd.NaT, based on the datatype.
For instance, np.nan can indicate a missing value in a continuous variable, None indicates categorical, while pd.NaT is used for a DateTime variable.
All of these convey the same information. Then why should we have different methods for different variable types? To avoid any such inconsistencies, Pandas 1.0 introduces a new “Singleton” value to represent scalar missing value – pd.NA. This will now be used for all the datatypes – integer, float, and even object. Here’s how you can use it.
This is the original data, stored in a dataframe named ‘data’:
Check out the resulting Pandas dataframe:

Let us replace the category ‘other’ in the recruitment_channel column with a null value using pd.NA:
Here’s the updated dataframe:

This can be done for any variable, irrespective of the datatype. Although pd.NA, similar to np.nan and pd.NaT, is used to indicate missing values, it behaves differently for certain arithmetic operations (for example, when np.nan is compared with an integer, the output is false):
np.nan>1

False
But when we compare this with the new feature pd.NA, it will return a null value:
pd.NA>1
<NA>
Similarly, adding a float to np.nan would return a float datatype but adding a float to pd.NA returns a null value. There are a number of other minor changes between the two and you can read about them in more detail here on the Pandas site: Experimental NA scalar to denote Missing Values.
3. Improved Data Information Output
At some point during the data analysis process, we have all used the info() and describe() functions to generate a concise summary of our Pandas dataframes.
The info() function simply returns the datatype for each column and the count of values within each column. It is often a good starting point for the data analysis process since we get a fair idea about the type of variables we have to deal with and the missing values in the data. Using this function with Pandas in Python is really easy!
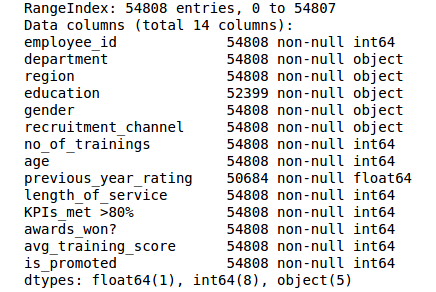
With the previous version, the function dataframe.info() would return a list of columns along with the details about the number of values and datatype for each column in the Pandas dataframe. Here is what the output looks like:
And when I do the same thing using Pandas 1.0, it returns the details in the form of a table along with index values and headers. The output is much more organized and readable. Have a look:
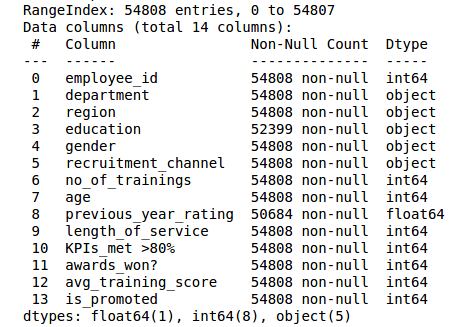
Amazing, right? Not only this, we can apply the same format on any dataframe. Let’s see how.
4. Markdown Format for Dataframes
The tabular format that we saw in the last example is similar to ‘markdown tables’. A markdown table has the rows separated by line breaks and columns separated by the pipe character. You’d have seen these formats in various documentations on GitHub.
Pandas 1.0 provides a markdown-friendly format for the dataframes. This comes in really handy when we are displaying tables via gists.
To convert any dataframe into the markdown table format using the older version of Pandas, we had to write the following code block:
In the latest version (Pandas 1.0), we can create markdowns using the newly introduced to_markdown() function:

Note: In order to use the to_markdown() function, you must have tabulate installed in your system. You can simply use pip for installation:
$ pip install tabulate
End Notes
Pandas is an essential tool for data analysis and its first major release includes some really interesting features and enhancements! It was a great experience trying out these new features and bringing them to our community.
Check out the complete list of features and bug fixes here – Pandas 1.0.0 Release Notes. Let us know which is your favorite feature in the comment section below.
Once you’re done with this article, you should jump to the next level:
And as I mentioned earlier, you can check out the free Python course we have curated if you’re new to this language:
An avid reader and blogger who loves exploring the endless world of data science and artificial intelligence. Fascinated by the limitless applications of ML and AI; eager to learn and discover the depths of data science.


I am a Fan of this Page and an intermediate python coder. Thank you for sharing these topics with us!
My pandas was working wonderfully until I installed the latest version. Now I get this error message: df = pd.read_csv('breast_cancer_data.csv') Traceback (most recent call last): File "", line 1, in df = pd.read_csv('/home/glauber/Documents/lung_project/Python_course/breast_cancer_data.csv') File "/home/glauber/anaconda3/lib/python3.7/site-packages/pandas/io/parsers.py", line 685, in parser_f _doc_read_csv_and_table.format( File "/home/glauber/anaconda3/lib/python3.7/site-packages/pandas/io/parsers.py", line 433, in _read kwds["compression"] = compression File "/home/glauber/anaconda3/lib/python3.7/site-packages/pandas/io/common.py", line 280, in _infer_compression NameError: name '_stringify_path' is not defined
Thanks for the update.