Understanding & Interpreting Confusion Matrix in Machine Learning (Updated 2024)
Introduction
Confusion Matrix – Not So Confusing!
Have you been in a situation where you expected your machine learning model to perform really well, but it sputtered out a poor accuracy? You’ve done all the hard work – so where did the classification model go wrong? How can you correct this?
There are plenty of ways to gauge the performance of your classification model, but none have stood the test of time like the confusion matrix. It helps us evaluate how our model performed and where it went wrong and offers us guidance to correct our path. Most people, especially beginners who have just started to understand machine learning or artificial intelligence, find the concept of a confusion matrix very “confusing”. However, this is not the case.

In this tutorial, we will explore what a confusion matrix in machine learning is and how it gives a holistic view of the performance of your model. And unlike its name, you will realize that a confusion matrix is a pretty simple yet powerful concept in machine learning or deep learning. So let’s unravel the mystery around the confusion matrix!
Learning Objectives
- Learn what a confusion matrix is and understand the various terms related to it.
- Learn to use a confusion matrix for multi-class classification.
- Learn to implement a confusion matrix using scikit-learn in Python.
Learning the ropes in the machine learning field? These courses will get you on your way:
Table of contents
- Introduction
- What Is a Confusion Matrix?
- Important Terms in a Confusion Matrix
- Why Do We Need a Confusion Matrix?
- How to Calculate Confusion Matrix for a 2-class classification problem?
- Precision vs. Recall
- Confusion Matrix Using Scikit-learn in Python
- Confusion Matrix for Multi-Class Classification
- Conclusion
- Frequently Asked Questions
What Is a Confusion Matrix?
A confusion matrix is a performance evaluation tool in machine learning, representing the accuracy of a classification model. It displays the number of true positives, true negatives, false positives, and false negatives. This matrix aids in analyzing model performance, identifying mis-classifications, and improving predictive accuracy.
A Confusion matrix is an N x N matrix used for evaluating the performance of a classification model, where N is the total number of target classes. The matrix compares the actual target values with those predicted by the machine learning model. This gives us a holistic view of how well our classification model is performing and what kinds of errors it is making.
For a binary classification problem, we would have a 2 x 2 matrix, as shown below, with 4 values:
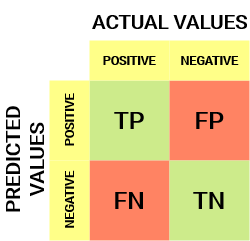
Let’s decipher the matrix:
- The target variable has two values: Positive or Negative
- The columns represent the actual values of the target variable
- The rows represent the predicted values of the target variable
But wait – what’s TP, FP, FN, and TN here? That’s the crucial part of a confusion matrix. Let’s understand each term below.
Important Terms in a Confusion Matrix
True Positive (TP)
- The predicted value matches the actual value, or the predicted class matches the actual class.
- The actual value was positive, and the model predicted a positive value.
True Negative (TN)
- The predicted value matches the actual value, or the predicted class matches the actual class.
- The actual value was negative, and the model predicted a negative value.
False Positive (FP) – Type I Error
- The predicted value was falsely predicted.
- The actual value was negative, but the model predicted a positive value.
- Also known as the type I error.
False Negative (FN) – Type II Error
- The predicted value was falsely predicted.
- The actual value was positive, but the model predicted a negative value.
- Also known as the type II error.
Let me give you an example to better understand this. Suppose we had a classification dataset with 1000 data points. We fit a classifier (say logistic regression or decision tree) on it and get the below confusion matrix:

The different values of the Confusion matrix would be as follows:
- True Positive (TP) = 560, meaning the model correctly classified 560 positive class data points.
- True Negative (TN) = 330, meaning the model correctly classified 330 negative class data points.
- False Positive (FP) = 60, meaning the model incorrectly classified 60 negative class data points as belonging to the positive class.
- False Negative (FN) = 50, meaning the model incorrectly classified 50 positive class data points as belonging to the negative class.
This turned out to be a pretty decent classifier for our dataset, considering the relatively larger number of true positive and true negative values.
Remember the Type I and Type II errors. Interviewers love to ask the difference between these two! You can prepare for all this better from our Machine learning Course Online.
Why Do We Need a Confusion Matrix?
Before we answer this question, let’s think about a hypothetical classification problem.
Let’s say you want to predict how many people are infected with a contagious virus in times before they show the symptoms and isolate them from the healthy population (ringing any bells, yet?). The two values for our target variable would be Sick and Not Sick.
Now, you must be wondering why we need a confusion matrix when we have our all-weather friend – Accuracy. Well, let’s see where classification accuracy falters.
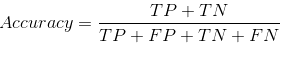
Our dataset is an example of an imbalanced dataset. There are 947 data points for the negative class and 3 data points for the positive class. This is how we’ll calculate the accuracy:
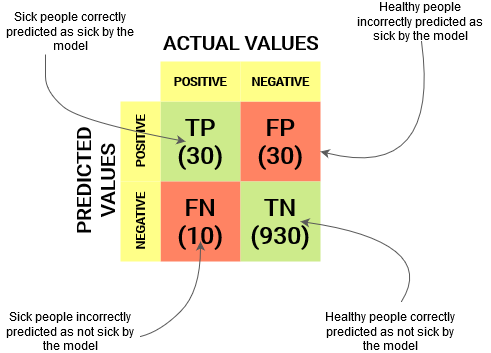
Let’s see how our model performed:

The total outcome values are:
TP = 30, TN = 930, FP = 30, FN = 10
So, the accuracy of our model turns out to be:
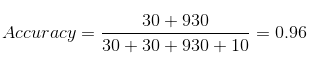
96%! Not bad!
But it gives the wrong idea about the result. Think about it.
Our model is saying, “I can predict sick people 96% of the time”. However, it is doing the opposite. It predicts the people who will not get sick with 96% accuracy while the sick are spreading the virus!
Do you think this is a correct metric for our model, given the seriousness of the issue? Shouldn’t we be measuring how many positive cases we can predict correctly to arrest the spread of the contagious virus? Or maybe, out of the correct predictions, how many are positive cases to check the reliability of our model?
This is where we come across the dual concept of Precision and Recall.
How to Calculate Confusion Matrix for a 2-class classification problem?
To calculate the confusion matrix for a 2-class classification problem, you will need to know the following:
- True positives (TP): The number of samples that were correctly predicted as positive.
- True negatives (TN): The number of samples that were correctly predicted as negative.
- False positives (FP): The number of samples that were incorrectly predicted as positive.
- False negatives (FN): The number of samples that were incorrectly predicted as negative.
Once you have these values, you can calculate the confusion matrix using the following table:
| Predicted | TRUE | FALSE |
| Positive | True positives (TP) | False positives (FP) |
| Negative | False negatives (FN) | True negatives (TN) |
Here is an example of how to calculate the confusion matrix for a 2-class classification problem:
# True positives (TP)
TP = 100

# True negatives (TN)
TN = 200

# False positives (FP)
FP = 50

# False negatives (FN)
FN = 150

# Confusion matrix
confusion_matrix = [[TP, FP], [FN, TN]]
The confusion matrix can be used to calculate a variety of metrics, such as accuracy, precision, recall, and F1 score.
Precision vs. Recall
Precision tells us how many of the correctly predicted cases actually turned out to be positive.
Here’s how to calculate Precision: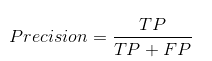
This would determine whether our model is reliable or not.
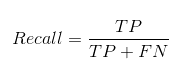
Recall tells us how many of the actual positive cases we were able to predict correctly with our model.
And here’s how we can calculate Recall:
We can easily calculate Precision and Recall for our model by plugging in the values into the above questions:
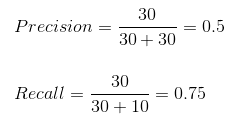
50% percent of the correctly predicted cases turned out to be positive cases. Whereas 75% of the positives were successfully predicted by our model. Awesome!
Precision is a useful metric in cases where False Positive is a higher concern than False Negatives.
Precision is important in music or video recommendation systems, e-commerce websites, etc. Wrong results could lead to customer churn and be harmful to the business.
Recall is a useful metric in cases where False Negative trumps False Positive.
Recall is important in medical cases where it doesn’t matter whether we raise a false alarm, but the actual positive cases should not go undetected!
In our example, when dealing with a contagious virus, the Confusion Matrix becomes crucial. Recall, assessing the ability to capture all actual positives, emerges as a better metric. We aim to avoid mistakenly releasing an infected person into the healthy population, potentially spreading the virus. This context highlights why accuracy proves inadequate as a metric for our model’s evaluation. The Confusion Matrix, particularly focusing on recall, provides a more insightful measure in such critical scenarios
But there will be cases where there is no clear distinction between whether Precision is more important or Recall. What should we do in those cases? We combine them!
What Is F1-Score?
In practice, when we try to increase the precision of our model, the recall goes down, and vice-versa. The F1-score captures both the trends in a single value:
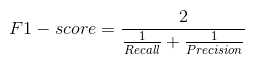
F1-score is a harmonic mean of Precision and Recall, and so it gives a combined idea about these two metrics. It is maximum when Precision is equal to Recall.
But there is a catch here. The interpretability of the F1-score is poor. This means that we don’t know what our classifier is maximizing – precision or recall. So, we use it in combination with other evaluation metrics, giving us a complete picture of the result.
Confusion Matrix Using Scikit-learn in Python
You know the theory – now let’s put it into practice. Let’s code a confusion matrix with the Scikit-learn (sklearn) library in Python.
Python Code:
Sklearn has two great functions: confusion_matrix() and classification_report().
- Sklearn confusion_matrix() returns the values of the Confusion matrix. The output is, however, slightly different from what we have studied so far. It takes the rows as Actual values and the columns as Predicted values. The rest of the concept remains the same.
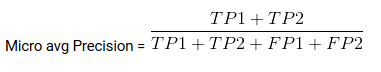
- Sklearn classification_report() outputs precision, recall, and f1-score for each target class. In addition to this, it also has some extra values: micro avg, macro avg, and weighted avg
Mirco average is the precision/recall/f1-score calculated for all the classes.
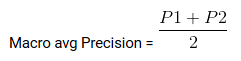
Macro average is the average of precision/recall/f1-score.
Weighted average is just the weighted average of precision/recall/f1-score.
Confusion Matrix for Multi-Class Classification
How would a confusion matrix work for a multi-class classification problem? Well, don’t scratch your head! We will have a look at that here.
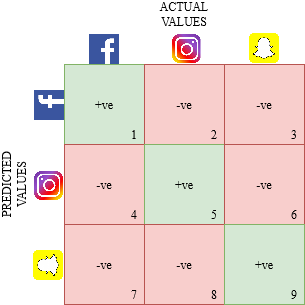
Let’s draw a confusion matrix for a multiclass problem where we have to predict whether a person loves Facebook, Instagram, or Snapchat. The confusion matrix would be a 3 x 3 matrix like this:
The true positive, true negative, false positive, and false negative for each class would be calculated by adding the cell values as follows:
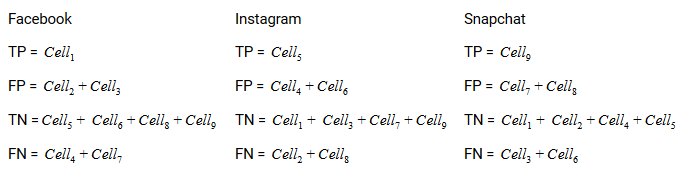
That’s it! You are ready to decipher any N x N confusion matrix!
Conclusion
The Confusion matrix is not so confusing anymore, is it? Hope this article gave you a solid base on how to interpret and use a confusion matrix for classification algorithms in machine learning. The matrix helps in understanding where the model has gone wrong and gives guidance to correct the path and it is a powerful and commonly used tool to evaluate the performance of a classification model in machine learning.
We will soon come out with an article on the AUC-ROC curve and continue our discussion there. Until next time, don’t lose hope in your classification model; you just might be using the wrong evaluation metric!
Key Takeaways
- True Positive and True Negative values mean the predicted value matches the actual value.
- A Type I Error happens when the model makes an incorrect prediction, as in, the model predicted positive for an actual negative value.
- A Type II Error happens when the model makes an incorrect prediction of an actual positive value as negative.
Frequently Asked Questions
A. A good confusion matrix is one that exhibits clear diagonal dominance, indicating that the majority of instances are correctly classified. Additionally, minimal off-diagonal values suggest that misclassifications are relatively rare. However, the interpretation of what constitutes a “good” confusion matrix may vary depending on the specific context and goals of the classification task.
A. The goal of a confusion matrix is to provide a clear summary of the performance of a classification model. It helps in understanding how well the model is classifying instances into different categories by comparing the predicted labels with the actual labels.
A. The F1 score is a measure of a model’s accuracy that takes both precision and recall into account. It is the harmonic mean of precision and recall.
A. Drawing a confusion matrix involves creating a table with rows and columns representing the actual and predicted classes, respectively. The cells of the table contain the counts or percentages of instances that fall into each combination of actual and predicted classes. Typically, the actual classes are represented along the rows, while the predicted classes are represented along the columns.
To use a confusion matrix in machine learning in 4 steps:
Train a machine learning model. This can be done using any machine learning algorithm, such as logistic regression, decision tree, or random forest.
Make predictions on a test dataset. This is a dataset of data that the model has not been trained on.
Construct a confusion matrix. This can be done using a Python library such as Scikit-learn.
Analyze the confusion matrix. Look at the diagonal elements of the matrix to see how many instances the model predicted correctly. Look at the off-diagonal elements of the matrix to see how many instances the model predicted incorrectly.


Hi Aniruddha, Thanks for writing this. Isn't the definition of FP and FN other way around? Like False Positive (FP) – The actual value was positive but we predicted a negative value Shouldn't it be reversed?
Hey Punit, Thanks for taking out the time to read the article and pointing out the mistake. Much appreciated! Thanks Aniruddha
Hi Puneet, In a FP, the value was predicted to be positive, but the value actually belonged to the negative class, so I think its correct, unless I'm missing something.
Thanks bro..You simply explained it..
Hi Aniruddha, Thanks for the article. It is indeed informative. However, I would like to highlight something in the section with heading "Understanding True Positive, True Negative, False Positive and False Negative in a Confusion Matrix". Do you think that we might have mixed up on the second point on False Positive and False Negative.
Hi Arjun, Glad you found it useful. And you are correct in pointing out the mix-up in the definitions. Thanks for your timely intervention🙏. Aniruddha
Nice and well written article Aniruddha. Introduced confusion matrix very well for beginners. (But I think there is one minor issue you may want to correct if you also notice it is really an issue: Under Type1 and Type2 error definitions, I think you have to swap 2nd bullet points. These do not match with matrix you mentioned earlier.)
Hey Sagar Really glad you liked the article! I have made the relevant changes. Thanks for the feedback! Aniruddha
I think that you mismatched the 2nd row in the definition of False positive with the 2nd row in the definition of false negative
Hey Luciano Thanks for pointing it out. I have already made the changes. Aniruddha
Awesome!!! Very simple and crisp explaination. Thanks So much
Glad to hear that you found it helpful!
Thanks for the tutorial, please How can we extract Tp, FP, FN, TN from the confusion matrix in the multiclass case with sklearn thank you in advance
Hi Abid If you want to calculate the values for a multiclass classification problem, you will need to calculate it manually as Sklearn returns the value of the Confusion matrix and not really the TP, FP, etc. (which was in the case of binary classification as we only had two classes). I have written the code for finding the TP, FP, etc. for one class of a multiclass classification problem here. The rest I am pretty sure you will be able to manage yourself. If not, feel free to ask your doubts. Thanks Aniruddha
Aniruddha: Too often confusion matrices deserve their unfortunate name, especially for students just starting to learn ML etc. Thanks for sharing a helpful tutorial & correcting the typo. 😃. It always helps (me, anyhow) to see some ‘friendly’ examples which I can follow along by myself so I’m sure others are going to find your contribution worthwhile too.
Hi Aniruddha, Thank you for posting this good article. I think in the table before Accuracy formula, you must replace 2nd column with 3rd column, because as I know if Actual Sick is 1 and Predicted Sick is 0, the Outcome must be FN (7th row), whereas it is FP !!! Best Regards.
great bro.
Hello Aniruddha! Thank you for this very useful article! You wrote that "Precision tells us how many of the correctly predicted cases actually turned out to be positive." But False Positive in the denominator is not a correctly predicted case, no?
Great article! I just wanted to highlight a mistake in (Our dataset is an example of an imbalanced dataset. There are 947 data points for the negative class and 3 data points for the positive class. This is how we’ll calculate the accuracy:) The total number of samples is 1000, the number of positive classes should be 40.
Good article. Thank you
You state the order of the output of the confusion matrix is tp, fn, fp, tn, but I have definitely found it's tn, fp, fn, tp. My positive class is 1. This comes from sklearn documentation: "Thus in binary classification, the count of true negatives is C0,0, false negatives is C1,0, true positives is C1,1 and false positives is C0,1."
Thanks Aniruddha. Suddenly the confusion matrix becomes simple :)
I read your article it is very informative for me. I hope I will find more articles in the future.
Yes. Interpretation need to be corrected here about FP.
Thanks, it helped me a lot <3
Thanks to God and also to Dr Abiola Efe , the great herbal man that cured me of STD 1/2. I contacted the virus from my partner three year ago, i almost spent all i had because i was restless , until i saw people testimony about Dr Abiola Efe recommendation online for how he has being curing HIV with his herbs, and i emailed him and he told me how to get the herb. You can contact him on google (( DR ABIOLA EFE )) thanks
It was great read! thanks for writing. it helps to clear doubt on confusion matrix