Overview
- Are you looking for a role in data science? You’ll have a far easier time coming from the Reporting, MIS or Business Intellgence fields
- Here are 11 comprehensive yet easy-to-achieve steps to transition into data science
Introduction
The rapid rise of data science as a professional field has lured in people from all backgrounds. Engineers, computer scientists, marketing and finance graduates, analysts, human resource personnel – everyone wants a piece of the data science pie.
Analytics Vidhya has already published a comprehensive learning path for beginners to get into data science. So why am I focusing on professionals working in business intelligence / MIS / reporting specifically? Let me explain.

I regularly encounter talented business intelligence (BI) professionals looking to land their first data science role. They are often frustrated by the perceived lack of opportunities for them. A lot of them feel that their role is repetitive, or they just need to perform whatever has been asked from them.
They actually miss the fact that they are closer to data science opportunities than any other professional out there.
Note: If you’re someone who is looking for a break in the data science domain, look no further than this comprehensive Ascend Pro program that combines data science knowledge with practical hands-on industry-relevant problems.
Why transition into data science in easier for a Business Intelligence (BI) professional:
Business Intelligence (BI) professionals hold a massive advantage over almost anyone trying to transition into data science because of the following reasons:
- BI professionals already have access to data scientists in various projects
- Existing know-how of how to manage and handle data (at times at scale)
- BI professionals have the business context and they work closely with businesses.
- They have experience with basic data exploration steps as very often business asks for these in addition to the reports they use.
In other words, these folks work in the “first half” of a data science project. That’s already more industry experience than most aspiring data scientists!
If you are one such transitioner looking to jump from a BI / MIS / reporting role to data science, this article is for you. You can consider these 11 steps as a learning path you can follow. In fact, I would strongly encourage you to implement these steps in your current BI role. Start where you are and practice till you break into data science!
P.S. For the rest of the article – Business Intelligence, MIS, reporting, dashboarding have been used interchangeably. There is very little difference and a lot of overlap in these roles and designations.
So are you ready to take this journey with me? Let’s take this ride step-by-step.
1) Start performing detective analytics and generate insights from reports
Let’s start off by looking at three examples of reporting that a BI (MIS / Reporting / Business Intelligence) professional does on a day-to-day basis.
Example 1:
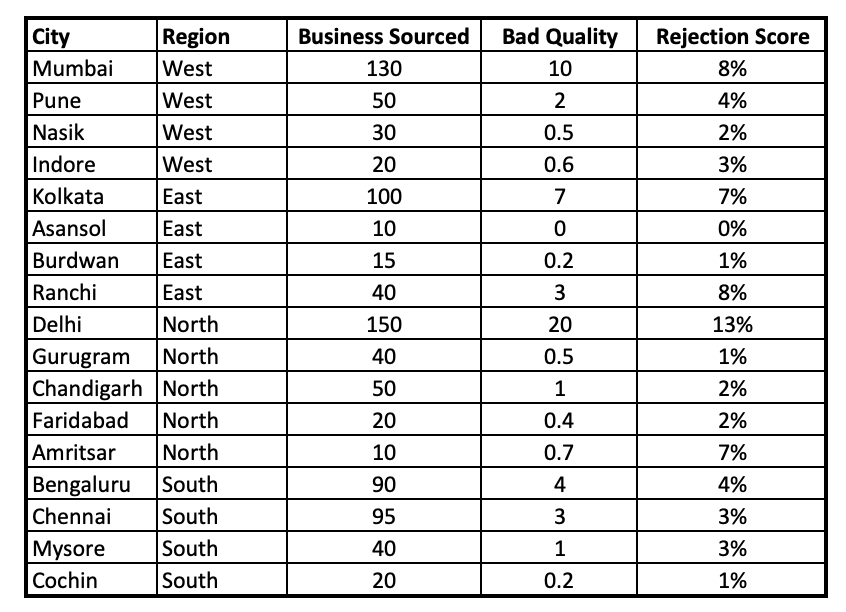
This BI professional has generated a report containing details about business sourcing at the City and Region levels along with the quality of the business.
Example 2:

Here, the BI professional has generated the same report with an addition of RAG (Red-Amber-Green) analysis for the “Rejection Score” column. A lower rejection score means a higher quality of business.
Example 3:

In this example, the BI professional has taken things to another level by adding insights about the report. You can see that (s)he has written the top 2 findings taken from the report. I’ve taken a simple example here to add interpretability to your report. You can add more visuals/charts depending on the type of information you are sharing.
Which of the above examples is more meaningful for business users?
Looking at the above three examples, I would side towards “Example 3” adding more value to the business because:
- It adds more interpretability to the report
- It also highlights the actionable areas to work on
- If you look at the findings, one of the findings is after aggregating the report at the region level
These actually help business users a lot. When you work with senior-level executives, you’ll find that most of them need actionable items to work on. They would not want to spend time focusing on interpreting the report and doing in-depth analysis.
To generate a similar report, a BI professional should have curiosity, attention to detail, command over anyone tool (Excel / SQL / QlikView / Tableau), along with knowledge about the business.
This skillset is not only limited to folks working in BI! It’s also very critical to becoming a good data science professional. In most cases, 60-70% of a data scientist’s job is about business understanding, data exploration, and generating insights about the problem at hand.
A BI professional has a huge advantage here compared to other professionals who are transitioning into data science. You can start practicing TODAY and this skill set will help you do well in your current role as well. It’s a win-win!
Challenges and Solutions:
- Not able to establish the relationship between insights and business: Generating insights is directly related to your business understanding. I would recommend you to get in touch with subject matter experts (SMEs) and try to interpret how it is impacting the business metrics.
- Not having enough time to generate insights: I agree – you are working with tight deadlines for publishing business reports and don’t have time to generate insights. I have two suggestions for you in that case:
- Don’t start with a report which has a very strict timeline (such as, at the start of the day). Pick reports which have lesser time constraints to publish. Monthly reports are a good place to start as they have important information and provide you with time to dig deeper in issues, if needed.
- Automate report generation. This will save you a ton of time which you can utilize on understanding the report and generating insights. You should learn macros in Excel / SAS or equivalent automation tools for whatever reporting tools you use.
2. Learn statistics to support your insights about reports
It’s now time to support your insights with some statistical metrics. Don’t just limit yourself to generating insights based on visual interpretations. Take a look at the image below – what’s your first reaction?

I can say that the average business sourced, post the contest, is higher as compared to before. Now, the question is whether “contest is the factor behind the boost in average business sourced, or is it just a random increase?”. Here, we need to rely on certain statistics concepts to support our insights, like doing a z-test/t-test or other statistical tests. Having a good knowledge of statistics will help you in these situations.
You should have a solid understanding of the below statistics topics if you want to land a data science role:
- Descriptive Statistics
- Mean, Median, Mode
- Variance and Standard Deviation
- Probability
- Bernoulli Trials & Probability Mass Function
- Central Limit Theorem
- Normal Distribution
- Inferential Statistics
- Confidence Interval
- Hypothesis Testing
- C0-variance/ Correlation
And here is a list of useful resources to help you get started with these topics:
- Blog on inferential stats: Comprehensive & Practical Inferential Statistics Guide for data science
- A detailed guide for hypothesis testing: Your Guide to Master Hypothesis Testing in Statistics
- Comprehensive and easy-to-understand tutorial on ANOVA: A Simple Introduction to ANOVA
Challenges and Solutions:
- Descriptive Statistics is easy to understand but inferential statistics is not my cup of tea: Practice is the key. I would recommend practicing as much as possible and getting an intuitive understanding of the concept. Do this before looking at the mathematical equation. This approach will help you focus on application aspects first rather than getting bogged down by theory.
- These look too statistical and I’m not able to share these with my stakeholders/customers: There are broadly two types of customers who look at these reports. The first type is more interested in intuitive insights while the other group (Risk/ Data Science Team) is more focused on statistical insights. Connect with people working in the latter group and start having discussions around your findings. Also, the best strategy here is to talk to businesses in their language and not in statistics. For example, initially, I will not use the term “statistical significance” if the audience is not comfortable. I will just say that we need to understand whether this event is big enough for business compared to what we have seen in the past.
3. Present your findings to the right group
Performing detective and statistical analysis will not help you land a data science role if you don’t share your findings with the right group.
Presenting stories is one of the key skills a data science professional must possess.
Here, I strongly recommend practicing this storytelling skill in your current role as well. You can start with the following:
- Always share detailed insights along with the report or your analysis
- Share your insights and start presenting your story through presentation slides
Here’s an essential recommendation that has personally helped me in my career – add visualization(s) to your slide(s). The words you write in the presentation (or speak during a meeting) should add context to your visualizations. Confused? Let me explain using an example.
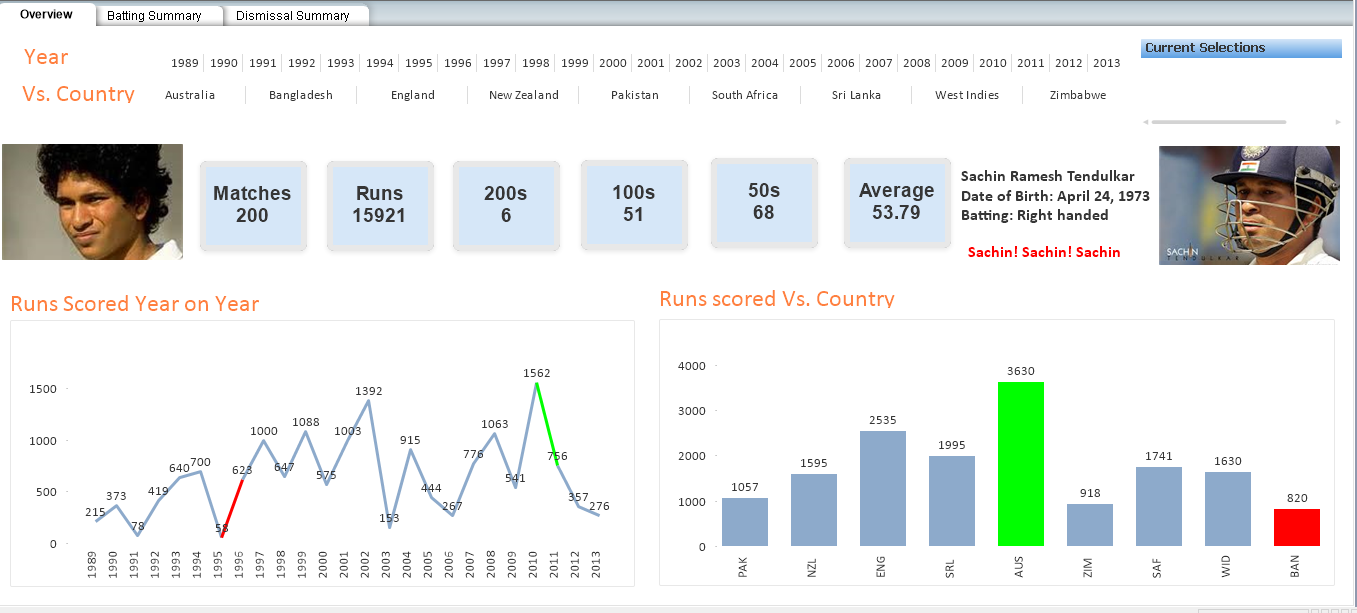
Look at the visualization below. It showcases details about Sachin Tendulkar’s test match career. You can talk about various metrics here using the graphs and numbers. This also shows why business understanding is so important – you can’t talk about metrics you have no experience with!
You should check out this excellent article – “The Art of Story Telling in Data Science and how to create data stories“.
Challenges and Solutions:
- Not able to communicate statistical insights to the group: It is not necessary to communicate in a single language (Statistics). We should change our method of communication depending on our audience. For example, if you are communicating with a team of statisticians, then it is okay to have more statistical inferences. If you’re working with a non-technical team, a mix of statistical and intuitive approaches will work better
- Have not shared any insights before, how do I start now?: You might have thoughts like:
- Are these insights meaningful to the business?
- I may interpret the numbers incorrectly. This will lead to bad communication and have a negative impact
Your concerns are understandable but you have to start somewhere to gather experience! My suggestion would be to start by sharing insights with your manager, experienced teammates, or your customers (if that’s possible). This will give your confidence a much-needed boost so start practicing!
4. Explore an open-source tool to generate reports OR to perform detective analysis
So far, I’ve not talked about any tool for generating reports and insights. I have deliberately avoided going into questions like – which tool should you pick? Or which one is right or better? That is because my objective was to get you comfortable with detective analysis, statistical concepts and honing your communication skills so you can present your findings using your current working tool.
Now, it’s time to learn a tool that has:
- Data handling capabilities (Large Volume)
- Graphical capabilities
- The ability to build predictive models (Machine Learning Models)
- Deep learning support
- Customer service support and a thriving community
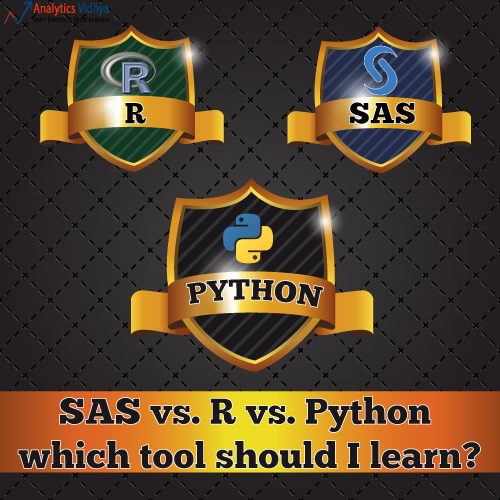
You can pick up any tool among SAS / R / Python as all these tools have the above-listed capabilities. Here, your initial task is very specific while learning a new tool – get yourself comfortable with performing data exploration, visualization, detective analysis, and statistical tests. You don’t need to have complete expertise over any of these tools (not initially, anyway).
If you’re not sure which tool to pick, I would suggest going through this awesome article written by Kunal Jain that compares the various pros and cons of these three tools.
You can look at the below tutorials for learning data exploration using SAS/R or Python:
- Data Exploration using Numpy, Pandas, Matplotlib
- A comprehensive guide for data Exploration using R
- Data Exploration using Data Step and Proc SQL
- 9 Popular ways to perform visualization using Python
- Data Visualization using SAS
Challenges and Solutions:
- Not having prior programming experience: Remember, the idea is not to become a tool expert. The focus should be on performing the same exercise (like exploration, visualization, or statistical tests) using a new tool. You will master these techniques and eventually the tool, with practice
- The current data science team works on SAS, should I move to Python/R?: I would suggest starting with SAS only. Always choose the tool which the data science team in your current organization is using. This will help you in your data science transition
5. Understand the model building / predictive modeling steps
It’s finally time to move to the most attractive part of data science – model-building! Before you dive into specific models, I recommend first understanding the type of problems that exist. Here is an article explaining the basics of predictive modeling/machine learning – Machine Learning basics for a newbie.
Broadly, we can divide the model building process into 5 steps:
- Problem Definition
- Hypothesis Generation
- Data Exploration
- Model Evaluation and Validation
- Model Building
I’m parking the first two steps (Problem Definition and Hypothesis Generation) to cover later in the article. We’ll talk about data exploration in this section.
The data exploration step is similar to detective analysis where our primary objective is to understand the behavior of variable(s) individually and with each other as well. Here, a good knowledge of statistics will help you a lot. This step focuses on both insight generation as well as data cleaning. You could be required to impute missing values, detect and deal with outliers, and perform multiple types of transformation.
I’ve written a comprehensive guide on the steps involved in data exploration. You can practice all these methods on a dataset from your industry or using any open dataset.
Challenges and Solutions:
- How it is different from detective analysis: It is similar to detective analytics with the addition of data cleaning and transformation steps. Here, your focus should be on doing data exploration to achieve a certain objective, such as figuring out whether the given variables will make an impact on the target variable or not
- How will I establish a relationship with the target variable without having a problem statement first?: You can take up any open dataset where the problem statement has been defined and start practicing your data exploration skills
6. Methods to evaluate your model’s performance
During our model building process, we train our model on a dataset where the target is known beforehand and then apply it on the test dataset to predict the target variable. We obviously want to be accurate while estimating the target variable.
How can we check whether we are accurate or not? We need a metric that will help us to evaluate our model result against the actual observations. Let’s understand this using an example.

We have a customer base – C1, C2 and C2. We’ve estimated that only C3 will buy product “A” from this customer base. As it turns out, both C2 and C3 bought the product. This means we’re 66.6% accurate (2 out of 3 predictions are correct). This accuracy is known as our “Evaluation Metric“.
The evaluation metric will change depending on the type of problem you are solving. Here is a list of common evaluation metrics you should be know.
You’ve decided on the evaluation metric but do you have the actual results to evaluate your model? You can’t jump into the future to prepare a test dataset! In this scenario, we reserve a particular sample of the dataset on which we do not train the model. Later, we evaluate the model on this sample before finalizing it. This method is known as model validation. You can refer to this article on various validation techniques which includes practical examples in R and Python.
Challenges and Solutions:
- Is it compulsory to know all the evaluation metrics?: Not necessarily. For now, focus on only two evaluation metrics – “RMSE” and the “Confusion Matrix”. These two are good enough to start. You can use RMSE for regression problems and the confusion matrix for classification ones
7. Introduction to predictive modeling with Linear and Logistic regression
You have understood the dataset and looked at the metrics to evaluate your model’s performance. What’s next?
Applying modeling techniques! Do not start learning multiple techniques simultaneously. Focus on only two for now – Linear and Logistic Regression. These two techniques will help you predict continuous and categorical variables.

For example:
- Linear regression will help you estimate the expected business of a sales agent in an insurance company for the next 3 months
- Logistic regression will help you know the probability of cross-selling a product to a particular customer
Below are two good articles to learn linear and logistic regression and practice using a tool of your choice:
Challenges and Solutions:
- Algorithms are too mathematical and difficult to understand: Start by building an intuitive understanding of these techniques first and then move on to the mathematical details. Here, I’m suggesting a top-down approach focused more on the practical aspect. You must be able to interpret the model result (such as understanding if the model is performing well or not)
8. Identify the business problem (related to your role), convert it to a data problem, and make predictions
So, where can you find a dataset for your domain? Finding a business problem can be difficult.
You should talk to the leadership or team managers and take one of their business challenges as your project. Here, the first step is to convert the business problem to a data problem. Then, start moving down the steps we had discussed in point #5 earlier – hypothesis generation, data collection, data exploration, data cleaning, and finally model building and validation.
One of the major advantages you have as a BI professional is that you are already familiar with the variables in the dataset. Your detective analytics skills will help you understand the variable(s) relationships as well. You can jump to tasks like data cleaning, transformation, identifying the right evaluation metric, setting validation set, and finally model building.
You should take some time and watch the below webinar by Tavish Srivastava to understand the importance of defining the problem statement and hypothesis generation:
I also recommend going through the below articles on building models easily and effectively in R and Python:
- A comprehensive guide to building machine learning models from scratch
- Build a Machine Learning Model in 10 minutes using R
- Build a Machine Learning Model in 10 minutes using Python
Challenges and Solutions:
- Not able to find the business problem: You will encounter scenarios where you are not able to get a business problem or are not able to convince the business/team managers about your skillset. If that’s where you stand, then start exploring these methods:
- Start building the model at your own capacity for a more defined problem statement: Let’s say you are responsible for generating a report which has an agent (insurance agent) level month-on-month business sourced. Now, while publishing this report, you can also estimate the agent performance for the upcoming months. This will be based on demographics or past performance as you already have access to the required datasets. After a month or so, you can validate your results and check how good your estimate was
- Participate in open data science competitions and improve your profile: Participating in data science competitions is a wonderful way to learn data science, improve your knowledge and profile, and gauge where you stand viz a viz the top data scientists in the world
9. Share your model’s results with the business owners and earn their trust

After building your model, you should share the results with your supervisor or the people who make decisions (like the team or project manager). As a data science professional, it is very critical to share your findings (like which feature(s) is making an impact on the target variable). You should also communicate regular updates around the comparison between your model result and the actual numbers.
This process will also help you to tune and improve your model. If the model is performing well, then there is a high chance you will get another assignment or get involved with the core data science team. That’s what we are aiming for, right?
Challenges and Solutions:
- My model is not performing well, what should I do now?: It is okay if your model is not performing well. You can explore the dataset further and look for issues. We will focus on learning different algorithms that might be a better fit for the problem you’re solving
10. Keep learning new algorithms, engage in the data science community, and focus on profile building
Learning never stops in data science. It is an ever-evolving field and we need to keep evolving with it. You’ve learned linear and logistic regression so far – extend your knowledge beyond that now. Learn algorithms like decision trees, random forest, and even neural networks.
And like I mentioned before, you should learn by applying. Theoretical knowledge is good to have but it’s useless if you don’t put it into practice. Pick up the datasets we spoke about earlier and apply these newly learned algorithms. You are likely to see a significant improvement in your model!
Now, let’s take a step outside the tools and techniques. I want to emphasize the importance of building your network and profile in the data science community.

Start attending data science focused events like meetups and conferences. You will meet like-minded people as well as experienced professionals who can guide you. I have seen plenty of aspiring data science professionals acquiring job offers through these events so I an vouch for their usefulness!
You should also focus on the digital aspect of your profile. You have clearly been working with data science projects so showcase your work to the community! Upload your code to GitHub and start publishing blogs/articles on your findings. This helps prospective employers see that you possess good knowledge about the subject.
Challenges and Solutions:
- I can’t decide which algorithms I should work on: This is a classic all-time question. It has baffled and puzzled many data science aspirants. My advice – work on the algorithms that are being used in your organization. This lasers down your focus to what’s required by your data science team. That intra-organization transition we spoke about earlier? This is a great approach to showcase your value to the existing data science team
- I don’t know where to find groups or which ones to join: There are plenty of meetups happening thanks to the data science boom. Analytics Vidhya hosts meetups regularly. If you can’t find a meetup in your city, host one! I have seen plenty of people take the initiative, post the meetup details on LinkedIn and Meetup.com, and ask their network to come and join. You’ll be surprised by the number of people who show up
11. Focus on transitioning to a data science role within your organization

While there are no easy ways to transition into data science, there are certain well-trodden paths. One of them is switching to the data science team in your current organization. Let me explain why you should focus on this rather than other paths (at least for starters).
- You already know how things work in your domain. Faced with certain variables in a dataset, you are quite adept at dealing with them since you have the required business knowledge
- Your leadership and management team is already familiar with your performance and work ethic. They know what you bring to the table – trust is a big factor in any team, especially a data science one. That works to your advantage
- No need to spend time scouting potential work opportunities outside your organization. Everyone dreads that time scrolling through job portals and what not in the slim hope of finding a decent opportunity
- This might not necessarily apply to everyone, but you might not see a sharp salary jump (if any) when you switch organizations. Remember, you are transitioning to a few function where you had limited experience
I could go on, but you get the idea. Always make it a first preference to look for opportunities in your current work place. Talk to folks in a senior role or from the data science team. Build up your network and trust me, it does pay off eventually.
Challenges and Solutions:
- Unable to find an opportunity in my current organization: Fair enough, you gave it a good shot. It wasn’t meant to be. If this happens, then you should definitely cast a wide net. As we discussed in the preceding step, your LinkedIn network and the data science community will come in handy. Don’t stick to passive job searching through online job portals – reach out to hiring managers through LinkedIn and other professional networks. Showcase your projects/portfolio online. And don’t give up! It will test your patience but the first breakthrough is worth the effort
End Notes
That was quite an exhilarating journey! I have made this transition myself quite a number of years ago. I have seen this field evolve over time and my aim in this article was to help you make that switch. You already have a number of steps covered that most aspiring data science professionals don’t, so make it count!
If you have any questions on this learning path, or any feedback on this article, let me know in the comments section below. Meanwhile, here are a few additional resources to learn data science and give yourself the best chance of breaking into this field:
- Introduction to Data Science Course
- Ace Data Science Interviews Course
- Certified Program: Data Science for Beginners (with Interviews)
Sunil Ray is Chief Content Officer at Analytics Vidhya, India's largest Analytics community. I am deeply passionate about understanding and explaining concepts from first principles. In my current role, I am responsible for creating top notch content for Analytics Vidhya including its courses, conferences, blogs and Competitions.
I thrive in fast paced environment and love building and scaling products which unleash huge value for customers using data and technology. Over the last 6 years, I have built the content team and created multiple data products at Analytics Vidhya.
Prior to Analytics Vidhya, I have 7+ years of experience working with several insurance companies like Max Life, Max Bupa, Birla Sun Life & Aviva Life Insurance in different data roles.
Industry exposure: Insurance, and EdTech
Major capabilities: Content Development, Product Management, Analytics, Growth Strategy.


Great Article !! Very practical approach ,..
Hi Sunil Sir, I have been following and reading your article since first day when i started my career on Data analytics.Undoubtedly, your every articles are asset for every data scientist.I learned Predictive analytics on R.But in my current company, i am working as Data analyst in business reporting section.,where my responsibilities are to build business report,dashboard so that my managers and directors can take easy business decision from my findings. I generally use, Microsoft Power BI and Excel Power tools for that.I believe that, my reporting career has helped me to extract any meaningful information from raw data and for that, i do manipulate the data, explore the data extremely and this is the key parts for making any predictive model as you said that,"data manipulation and data exploration is the key part of making any predictive model"..I had a fear that, how can i connect my reporting career with data science career? can i jump into data science domain? as i am working in business reporting section.But, your article is really life saving for me.Thanks for sharing this article.Another request, if you kindly share your Email- id for suggestion and advice, then it would be really great for me.
This was an interesting exposition. I like the way you generate the problem from BI thinking to Data Analysis thinking. I am interested in why BI Analysts want to change their role. You mentioned because they feel "undervalued" themselves, but they have a role too.