This article was published as a part of the Data Science Blogathon.
Introduction
“I’m a bit of a freak for evidence-based analysis. I strongly believe in data.”
– Gus O’Donnell, a former British senior civil servant, economist
The whole world is a big data problem. Nowadays, we can see there are lots of opportunities for data scientists, statisticians and big data analyzers. You must torture the data and it will open up and confess all that you want to know! But is having data enough to make predictions? No! To make predictions one must clean, analyze, visualize, test and train the data.
Also, to make predictions one must plot the required graphs, check how the data is distributed, what are the numbers telling about, are they enough to make predictions or not? Once, you play with the data using various methods, it will help you in reaching your goal. So, let’s see how to play with the data and come up with the predictive output!
In this article, we are going to see one of the supervised learning algorithms called Regression. In regression, there are sub categories like Linear regression, Multiple Regression and Logistic Regression. Today we are going to discuss Logistic Regression.
What is Regression?
In simple words, it is one concept in statistics : a measure of the relation between the mean value of one variable (e.g. output) and corresponding values of other variables.
What is Logistic regression?
Logistic Regression is a mathematical model used in statistics to estimate (guess) the probability of an event occurring using some previous data. Logistic Regression works with binary data, where either the event happens (1) or the event does not happen (0).
The dataset we’ll be using is about Heart Diseases. We are going to play with this data, you’ll get the dataset here : Dataset
First we need to import libraries which we’ll be using in our model creation. Also, we’ll import the dataset by adding the path of the .csv file. After adding the data, dataframe.head() command is used to print the first 5 rows of the dataset.
Python Code:
#import numpy as np
import pandas as pd
#import matplotlib.pyplot as plt

dataset = pd.read_csv('framingham_heart_disease.csv') #adding data

#print 1st 5 rows
print(dataset.head())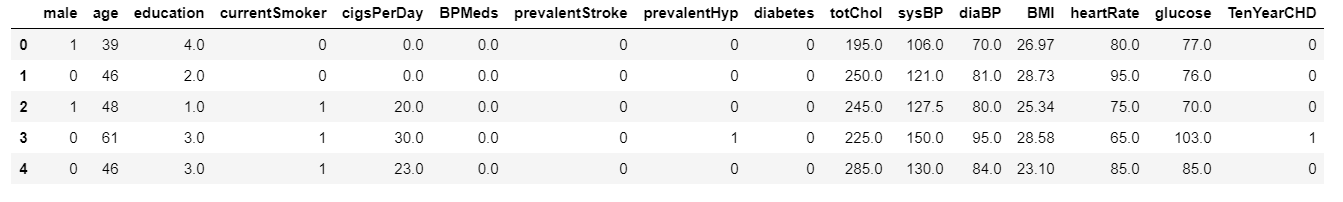
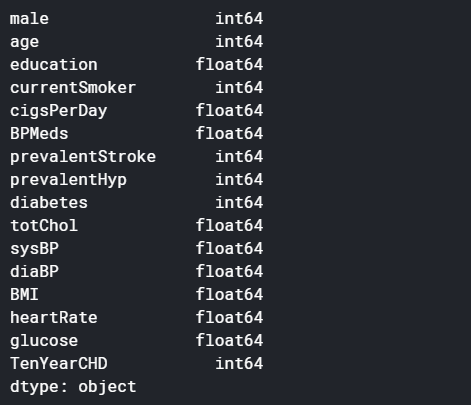
Before playing any game we must know the details and rules. Similarly before playing with data, we must know its details and rules for predicting the model. As we know all the columns now, let’s see what are the datatypes of these attributes, and how many null values are present in each column.
dataset.isnull().sum()
dataset.dtypes
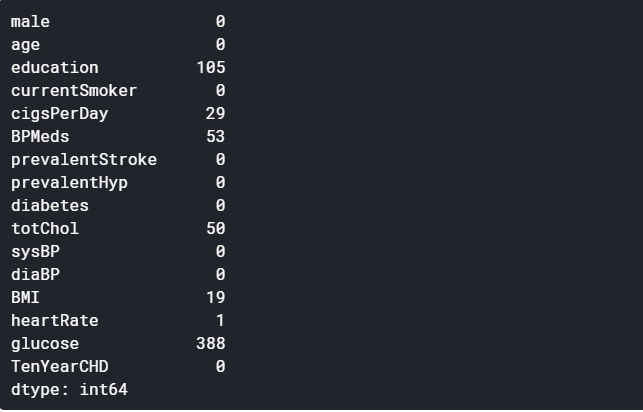
In this game, we are going to make predictions about Heart diseased patients using the data present in these attributes. What do you think? Is education important to know a person’s health? Of course no! Right? So we’ll drop that column. Also, there are many missing values present in some of the columns, so we’ll remove those columns as well as without those columns it is possible to make predictions.
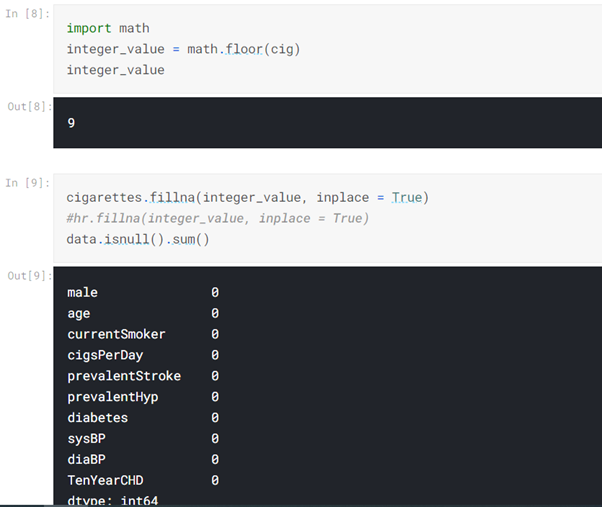
Do you think this data game is so easy? Well, no! Have you observed that the column Cigsperday? Don’t you think it will help us in predictions? YES! This column is very important. But how to handle those missing values? What do you do while playing cards if one or two cards are missing? We use joker cards in place of those cards, right? So, here we’ll replace these missing values with average values.
data = dataset.drop(['education','BPMeds','totChol','BMI','glucose','heartRate' ], axis = 'columns')
data.head()

cigarettes = data['cigsPerDay']
cigarettes.head()
cig = cigarettes.mean()
Have you observed the last column? There are values 1 or 0. This makes our data labeled data.
Then what are the dependent and independent values?
#this data is labeled data
#independent variable (X) will be Age, Estimated Salary
#dependent variable(y) will be Purcahsed (It will be lable)

#define X,y
X = dataset.iloc[:, [ 1, 3]].values
y = dataset.iloc[:, 15].values

#print X,y
print(X[:5, :])
print(y[:5])
Now, it’s time to test and train the data!
#import train_test_split from sklearn to train and test our data
from sklearn.model_selection import train_test_split

#define
X_train, X_test, y_train, y_test = train_test_split(X, y, test_size = 0.25, random_state = 0)
#print
print(X_train[:5],'\n', '\n', y_train[:5],'\n','\n', X_test[:5],'\n','\n', y_test[:5])

#create object of LogisticRegression class to refer as classifier
from sklearn.linear_model import LogisticRegression
classifier = LogisticRegression(random_state = 0)
classifier.fit(X_train, y_train)
y_pred = classifier.predict(X_test)
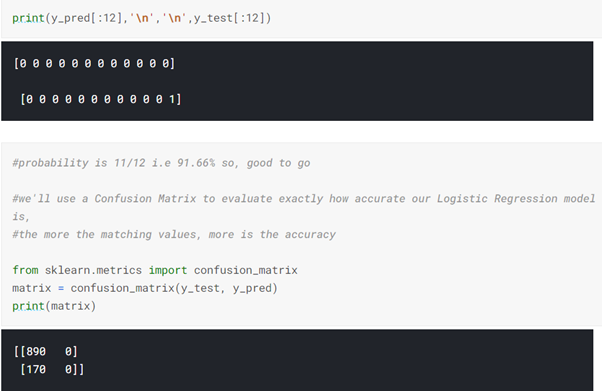
The confusion matrix is a bit confusing right? No worries! We are going to fit the data and print the score.
X = data[['male','age','currentSmoker','cigsPerDay','prevalentStroke','prevalentHyp','diabetes','sysBP','diaBP']]
y =  data['TenYearCHD']

from sklearn.model_selection import train_test_split
X_train, X_test, y_train, y_test = train_test_split(X,y, test_size = 0.20, random_state = 99)

from sklearn.linear_model import LogisticRegression
model = LogisticRegression()

model.fit(X_train, y_train)
model.score(X_test,y_test)
This score is .86! It tells us that our prediction is quite good. You can check the score by changing the random state. So, we won the game as our prediction score is good!
You can find the whole code here: Github Repository


Great job Arya!!! 💯💯
Excellent work done
Quite insightful! This article definitely helped me :)