This article was published as a part of the Data Science Blogathon.
Introduction
Hi! Young Data Science enthusiast, Let’s understand key packages for Data Science implementation. This is really very simple to understand and apply to your data set.
Especially Python libraries for Data Science, Machine Learning models are very interesting, easy to understand, and absolutely you can apply straight away and you can feel the insight of the data and realize/visualize the nature of the data set.
Even the complex algorithms can be implemented in two or three lines of code, all major mathematical concepts are embedded inside of the packages for the implementation point of view.
Of Course, this is something different and interesting than other programming libraries I have seen so far, that is the main reason Python playing a vital role in the AI space with this simplicity and robustness! I believe, Yes! I realized, understood thoroughly, and enjoyed it.
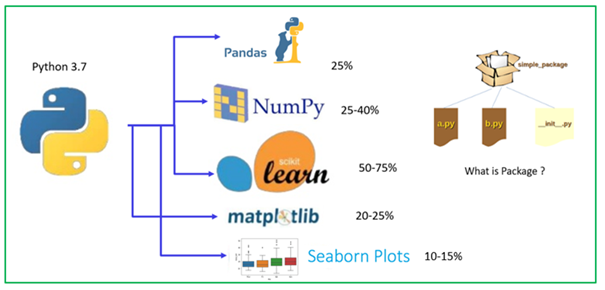
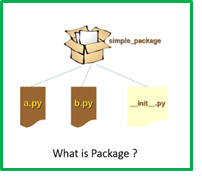
What is a package in Python? A package is a collection of Python modules and assembled in a single pack. Once you import in your notebook cells, you can start using class, methods, attributes, etc., But before that, you should necessity and usage of the package and import into your file/package.
Let’s discuss key packages in Python for Data Science and Machine Learning.
- Pandas
- NumPy
- Scikit Learn
- Matplotlib
- Seaborn
Pandas

Mainly used for structured data operations and manipulations. Pandas offer powerful data processing capabilities, I have never seen such wonderful features in my IT journey. It provides high-performance, easy-to-use, and applied on data structures and to analyze the data.
How could you install Pandas library? this is very simple, execute the below command in your Jupiter Notebook.
!pip install pandas
Pandas library will be installed successfully! What next? play around with this library.
The syntax for importing Scikit in your NoteBook
import pandas as pd
Then, your NoteBook is ready to extract all features inside the pandas. let’s do few things over here.
Pandas have the below capabilities.
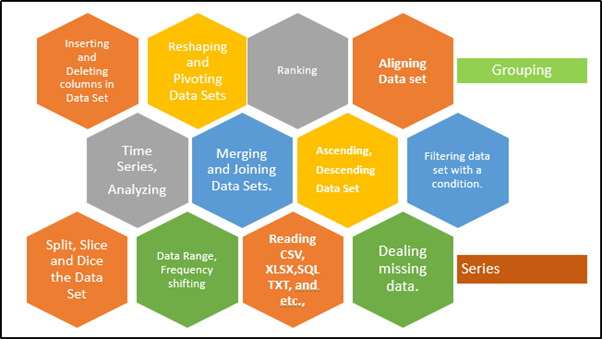
A) Series and DataFrame
The primary components of pandas are the Series and DataFrame. Let’s have a quick view of this. Series is nothing but a dictionary and collection of series, we could construct the dataframe by merging series, have a look at the below sample. you would understand better.
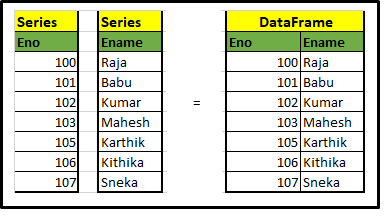
Code create series and dataframe
Python Code:
import pandas as pd
Eno=[100, 101,102, 103, 104,105]
Empname= ['Raja', 'Babu', 'Kumar','Karthik','Rajesh','xxxxx']
Eno_Series = pd.Series(Eno)
Empname_Series = pd.Series(Empname)
df = { 'Eno': Eno_Series, 'Empname': Empname_Series }
employee = pd.DataFrame(df)
print(employee)
B.Loading data into dataframe object
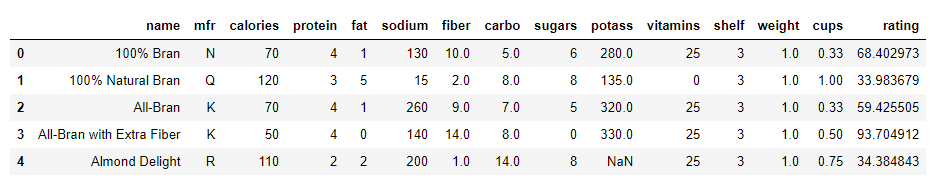
cereal_df = pd.read_csv("cereal.csv")
cereal_df.head(5)
C.Dropping column from dataframe object
cereal_df.drop(["type"], axis = 1, inplace = True)
cereal_df.head(5)
D.Selecting rows from dataframe object
cereal_df_filtered = cereal_df[cereal_df['rating'] >= 68]
cereal_df_filtered.head()
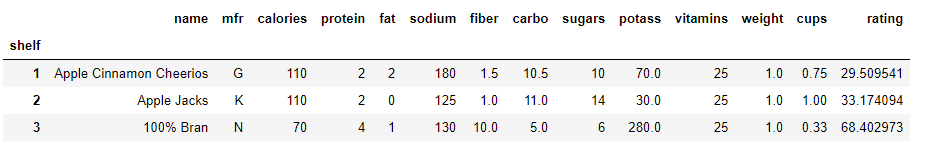
E.Groupby column in the dataframe
cereal_df_groupby = cereal_df.groupby('shelf')
#print the first entries
cereal_df_groupby.first()
F.Extracting row from the dataframe
# return the value
result = cereal_df.loc[0,'name']
result
So far, we have discussed multiple functionalities in the pandas library. there are many more.
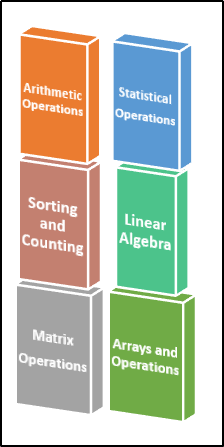
NumPy
NumPy is considered as one of the most popular Machine Learning libraries in Python, the best and the most important feature of NumPy is Array interface and manipulations.
Are you scared about mathematics while implementing your Data Science/ML model? No worries, NumPy makes complex mathematical implementations very simple functions. But remember to understand the requirements and use the pack accordingly.
The syntax for importing NumPy in your NoteBook
import numpy as np
Let’s discuss few things here, how NumPy doing magic with given data.
A.Simple array formation using NumPy (1-D,2-D, and 3D)
import numpy as np

#1-D arrays

arr1 = np.array([1, 2, 3, 4, 5])

print("1-D Array")

print(arr1)

print("===================")

#2-D arrays

print("2-D Array")

arr2 = np.array([[1, 2, 3], [4, 5, 6]])

print(arr2)

print("===================")

#3-D arrays

print("3-D Array")

arr3 = np.array([[[1, 2, 3], [4, 5, 6]], [[1, 2, 3], [4, 5, 6]]])

print(arr3)

print("===================")
Output
1-D Array
[1 2 3 4 5]
===================
2-D Array
[[1 2 3]
 [4 5 6]]
===================
3-D Array
[[[1 2 3]
  [4 5 6]]

 [[1 2 3]
  [4 5 6]]]
===================
B.Array Slicing using NumPy
#Slicing in python means taking elements from given index range [start:end-1] /[start:end:step].
arr = np.array([1, 2, 3, 4, 5, 6, 7])
print("Slicing at index 1 to 5")
print(arr[1:5])
Output
Slicing at index 1 to 5
[2 3 4 5]
arr = np.array([1, 2, 3, 4, 5, 6, 7])
print(arr[4:])
Output
[5 6 7]
We have Negative Slicing too :). That is so simple, just we have mention [-x:-y],
Why don’t you try your own?
C.Array Shape and Re-shaping using NumPy
arr = np.array([[1, 2, 3, 4], [5, 6, 7, 8]])
print("================================")
print("Shape of the array")
print(arr.shape)
print("================================")
Output
================================
Shape of the array
(2, 4)
================================
arr = np.array([1, 2, 3, 4, 5, 6, 7, 8, 9, 10, 11, 12])
print("Before Reshape the array")
print(arr)
print("================================")
newarr = arr.reshape(4, 3)
print("After Reshape the array")
print(newarr)
print("================================")
output
Before Reshape the array
[ 1  2  3  4  5  6  7  8  9 10 11 12]
================================
After Reshape the array
[[ 1  2  3]
 [ 4  5  6]
 [ 7  8  9]
 [10 11 12]]
================================
D.Array Splitting using NumPy
arr = np.array([1, 2, 3, 4, 5, 6])
print("Splitting NumPy Arrays into 3 Arrays")
print("================================")
newarr = np.array_split(arr, 3)
print(newarr[0])
print(newarr[1])
print(newarr[2])
print("================================")
output
Splitting NumPy Arrays into 3 Arrays
================================
[1 2]
[3 4]
[5 6]
E.Sorting Array using NumPy
arr = np.array(['banana', 'cherry', 'apple'])
print("Splitting NumPy Arrays into 3 Arrays")
print("================================")
print(np.sort(arr))
print("================================")
output
Splitting NumPy Arrays into 3 Arrays
================================
['apple' 'banana' 'cherry']
================================
If you have started play with data using NumPy….
Certainly, you need more and more time…to understand the concepts, all are
extremely organized in this package. believe me!
Scikit Learn

Scikit Learn library is one of the richest libraries in the Python family, it contains a huge number of Machine Learning algorithms and other key performance-related libraries. Python Scikit-learn allows users to perform various Machine Learning specific tasks. To perform, it needs to work along with SciPy and NumPy libraries, this is something internal matters, anyway keep it in your mind. Few algorithms here for your views.
- Regression
- Classification
- Clustering
- Model Selection
- Dimensionality Reduction
The syntax for importing Scikit in your NoteBook
from sklearn.linear_model import LinearRegression
from sklearn.model_selection import train_test_split
Visualization Packages from Python
Matplotlib & Seaborn Libraries
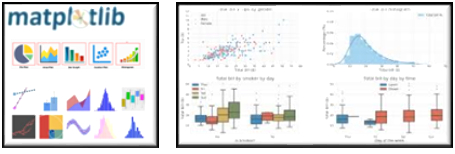
Python providing 2D graphics features with Matplotlib library. this is very simple and easy to understand. you can accomplish by 1 or 2 lines. Even 3D visualization also there.
The syntax for importing Scikit in your Note Book
import matplotlib.pyplot as plt

import seaborn as sns
Hope you have worked on multiple charts in excel worksheet and other BI tools. But in Python in-house visualization packages are providing extremely high-quality graphs and charts.
Matplotlib & Seaborn
Matplotlib is one of the major and basic visualization packages, which provides Histograms (Frequency Level), Bar charts (Univariate and Bivariate Plotting), Scatter Plots (Clustering), etc.,
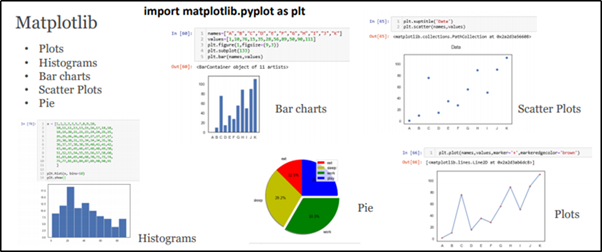
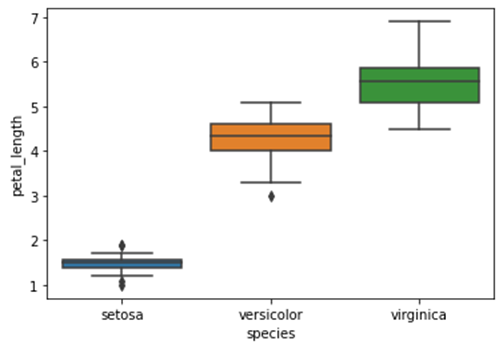
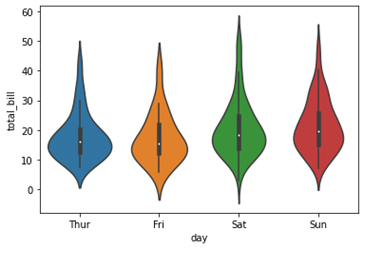
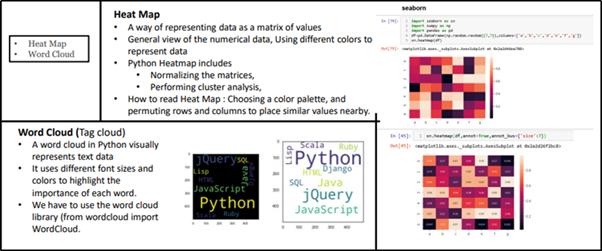
Rich and Luxury data visualization library from Seaborn. It provides a high-level interface for drawing attractive and informative statistical graphics. Box Plots (Data Distribution with different quartiles), Violin Plots (Data Distribution and Probability density), Bar Plots (Comparisons among categorical features), Heat map (Correlation of features in terms of Matrix representation), Word Cloud (Visual representation of Text Data)
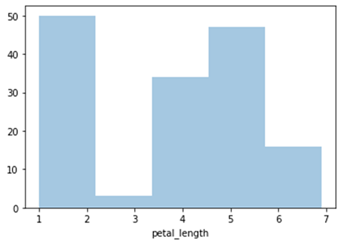
Seaborn – Histogram
import seaborn as sb
from matplotlib import pyplot as plt
df = sb.load_dataset('iris')
sb.distplot(df['petal_length'],kde = False)
plt.show()
Seaborn – Boxplot
df = sb.load_dataset('iris')
sb.boxplot(x = "species", y = "petal_length", data = df)
plt.show()
Seaborn – Violinplot
sdf = sb.load_dataset('tips')
sb.violinplot(x = "day", y = "total_bill", data=df)
plt.show()
So, all these libraries are helping us to build a nice model and playing with Data!
But remember always, before the usage of the induvial packages, you should understand the necessity and requirements of the package and then import it into your file/package and play around with that.
Hope now you got the feel and certain level of details on Python packages for data science. Will see more in-depth concepts in the upcoming days! Thanks for your time!
The media shown in this article are not owned by Analytics Vidhya and is used at the Author’s discretion.
Shanthababu Pandian has over 23 years of IT experience, specializing in data architecting, engineering, analytics, DQ&G, data science, ML, and Gen AI. He holds a BE in electronics and communication engineering and three Master’s degrees (M.Tech, MBA, M.S.) from a prestigious Indian university. He has completed postgraduate programs in AIML from the University of Texas and data science from IIT Guwahati. He is a director of data and AI in London, UK, leading data-driven transformation programs focusing on team building and nurturing AIML and Gen AI. He helps global clients achieve business value through scalable data engineering and AI technologies. He is also a national and international speaker, author, technical reviewer, and blogger.


Simply great ..
This is good.
Very good information for data engineers. Well done Shantha