This article was published as an entry for the Data Science Blogathon.
Introduction
If you are a regular blogger, content creator, or work in an internet-based company, have you ever wondered which metrics drive traffic to your sites? Given that Google’s Search Engine Ranking Algorithm keeps evolving regularly, it may seem like an uphill task to rank consistently in the top 10 in your universe of search results.
What if a machine-learning algorithm exactly pin-points the key metrics that you need to focus on & tells you regularly, what are the interventions needed on your site so that user acquisition improves.
In this article, we will explore how to quantify the impact of the key metrics on user acquisition through regression analysis.
We have chosen the Business News category for the analysis, but these techniques can be re-applied across other domains as well. The final results and key-takeaways may differ for other domains, but the methodology and interpretation techniques should be similar.
Defining the Digital Ecosystem
Before we start with the actual analysis, let us try and define the Digital Ecosystem and find a cause and effect relationship.
We have certain factors like content metrics, page-speed metrics & SEO metrics which can be influenced through content and product interventions.
Then there are factors that cannot be influenced like the release of Google Core Update, a sudden spike in searches, and many more. The relationship can be briefly explained through a flow chart as follows: –
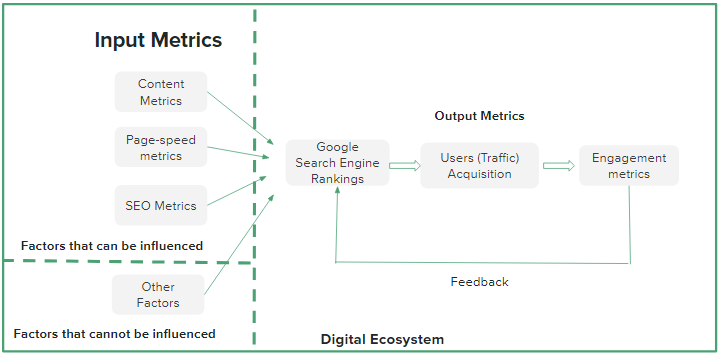
As we can see from the above chart input metrics influence Google Search Rankings which in turn drives user acquisition. The way, the users engage with our content is captured through metrics like Average Session Duration, Bounce Rate, Sessions/User, Pages/Session, Average Time on Page, etc. These metrics are used as part of a feedback mechanism to Google’s Search mechanism and the Search rankings are revised based on the user’s engagement.
Based on the above assumptions we can conclude that User acquisition is a function of Content, Page-speed, SEO, and engagement metrics.
Users Acquisition = function of(Content, Page-speed, SEO, Engagement)
For the analysis we would be considering the following key metrics under each bucket: –
Content Metrics: – # articles published per day, time of publishing, Length of the article, No of keywords used in the meta-tag
Engagement Metrics: – Average Session Duration, Pages/Session, Sessions/ User, Bounce Rate, Average Time on Page
Page Speed Metrics: – Page Speed Score, First Contentful Paint, Cumulative Layout Shift, First Input Delay, Largest Contentful Paint, Time to interactive
SEO Metrics: – Organic CTR, Average Search Position, Organic Search Clicks, Search Impressions
Testing the assumptions of Multiple Linear Regression
Before we proceed with the analysis, we need to validate if the data satisfies the assumptions of Linear Regression viz:-
- Residual terms should be normally distributed
- Residuals should be independent (No Auto-correlation)
- Residual terms should have constant variance (Homoscedasticity)
- There should be a linear relationship between a dependent variable and independent variables
- There should be no multicollinearity among the independent variables
We will test each assumption one by one and take corrective actions when necessary
1. Residual terms should be normally distributed: –
To check this we can either plot the residuals vs frequency on a histogram and check the shape of the distribution or observe the P-P plot.
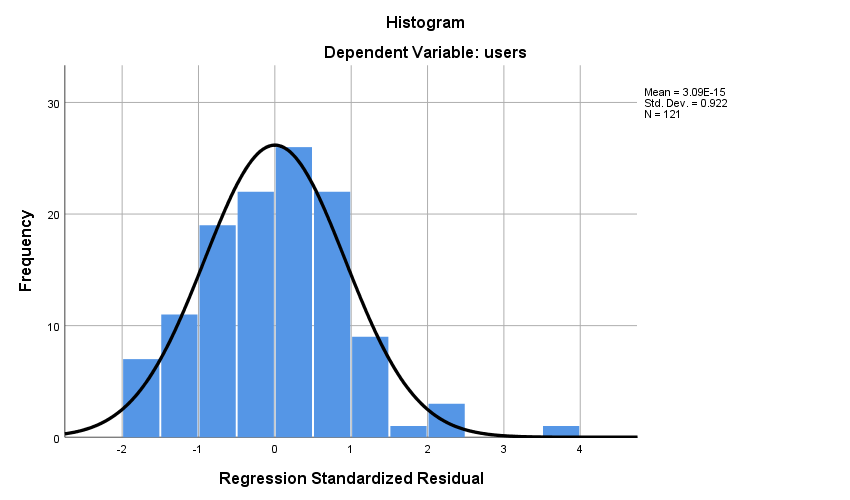
In the above plot, we see that the residuals are normally distributed, and hence no corrective action is required.
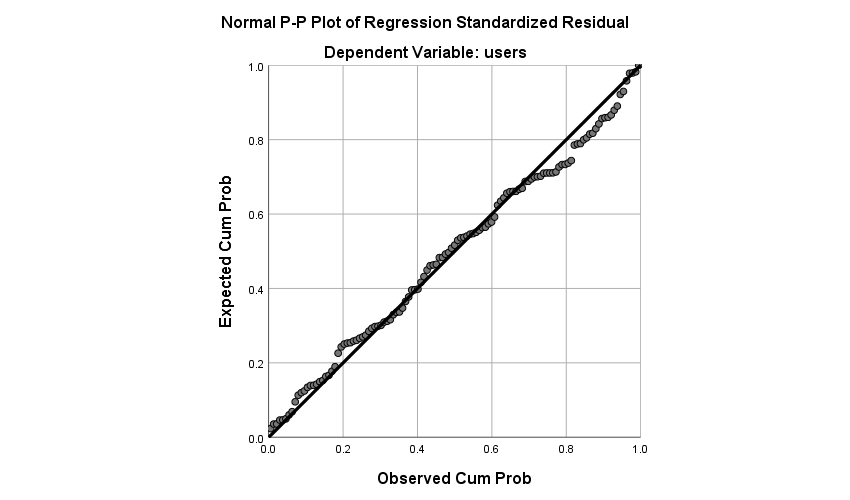
Alternatively, we can also look at the P-P plot as shown above. Since the distribution is aligned along the diagonal, we can say that residuals are normally distributed.
2. Residual terms should be independent: –
The best way to determine independence is by running a Durbin Watson Test.
DW Stat = 2.05
If DW Stat is between 1.5 to 2.5, then we are safe to assume that there is no significant autocorrelation.
3. Residual terms should have constant variance (Homoscedasticity): –
To check for homoscedasticity, the best way is to plot the Residuals vs Predicted Plot as shown below.
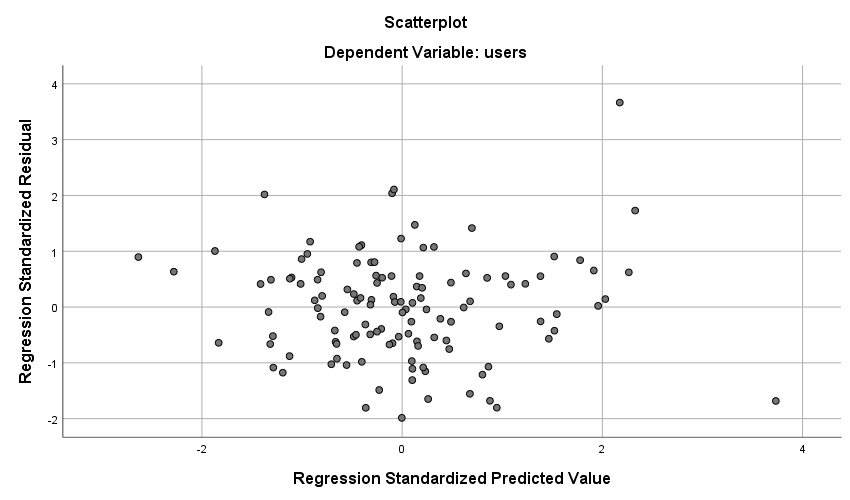
If the points are scattered evenly and appear as bullet marks coming out of a shotgun, then it can be deduced that the error terms have constant variance. If the error terms show a funnel-shaped distribution or the points are concentrated towards the right side or the left, then the assumption will be violated.
In this case, the distribution is fine, and hence no actions required.
4. There should be a linear relationship between the dependent variable and the linear combination of the independent variables: –
Since assumptions 1) & 3) are true, there is no need to check separately for this assumption. Else we could have checked the scatterplot to verify the same.
5. There should be no multicollinearity amongst the independent variables: –
The best way to check for multicollinearity is to check the Variance Inflation Factors (VIFs) of the independent variables. Following is the summary of the variables sorted based on the Variance Inflation Factor
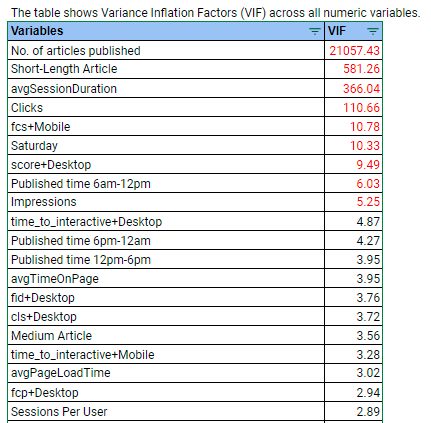
We would exclude the variables having values greater than 5. This will take care of the multicollinearity in the model.
Interpreting the results of Regression Analysis
Now that the assumptions of multiple linear regression are satisfied, we can proceed with training the Regression model with the data. Following is the summary of the Regression Table: –
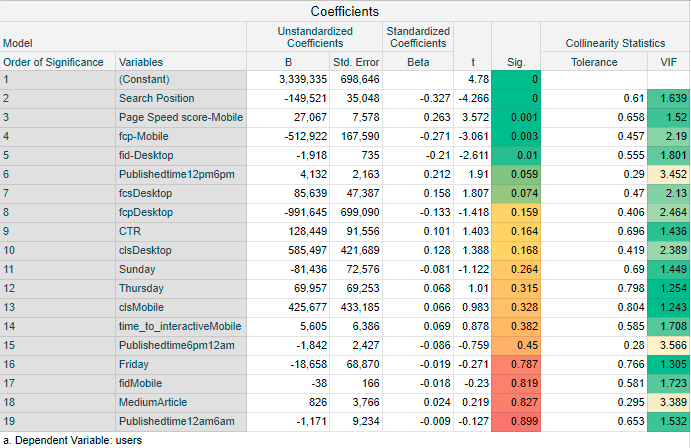
Key Take-aways from the model: –
1) Average Search Position is the most important metric in driving user acquisition. This is in line with the business understanding since 70% of the users acquired are through organic sources like Google Search.
- The Search position is inversely proportional to the CTR (Click-through rate)
- According to this model, if the Search Position increases by 1, (say for eg:- from 4th result to 5th result), then there is a loss of ~1.5 lakh users daily
2) Page-speed score on Mobile devices is the next most significant metric. This is also per the actual business scenario since ~90% of the internet traffic in India is driven through mobile devices.
- Page-speed score(0 – 100) measures the speed of the content rendering on the websites
- As per the model, if Page Speed Score increases by 1 unit, then ~27k users, are acquired daily
3) First Contentful Paint (FCP) on Mobile devices is the next important metric.
- FCP(0 -100) measures how long it takes the browser to render the first piece of DOM content after a user lands on the page
- If FCP increases by 1, then there is a loss of ~5.1 lakh users daily
4) First Input Delay (FID) on Desktop is the next important metric. FID is similar to the ping statistic used in Ookla Speed Test. It measures the load responsiveness of the web page
- This is an interesting finding as generally Google web crawlers use a Mobile-First Indexing Approach for ranking sites
- The results indicate that for Business News sites along with their mobile versions, even the Desktop versions need to have better responsiveness as Google’s Ranking Algorithm takes that into account, according to this model
Conclusions
As we can observe that the regression analysis, helps us quantify the drivers and drainers for web-traffic acquisition. It provides us with a list of metrics that are extremely important for user acquisition along with their priorities and impact.
If re-applied across other domains, it can help us uncover the secret behind the Black-Box of Google’s Search Engine Algorithm and enable content publishers to reach out to their maximum potential in terms of users.
The media shown in this article are not owned by Analytics Vidhya and is used at the Author’s discretion.


Thanks, Barun Ghosh. The content is informative and insightful. May I know does you offer any video tutorial for this blog content?
Hi Yong, I do not have any video tutorial for this blog content, but yes its a great idea, will definitely consider making some content