How to select Best Split in Decision Trees using Chi-Square
Himanshi Singh
30 Mar, 2021 • 6 min read
Introduction
Welcome back! In the previous article, we learned about Gini impurity which we use to decide the purity of nodes. There is one more algorithm that we can use to decide the best split in decision trees and that algorithm is Chi-square.
Note: If you are more interested in learning concepts in an Audio-Visual format, We have this entire article explained in the video below. If not, you may continue reading.
What is Chi-Square?
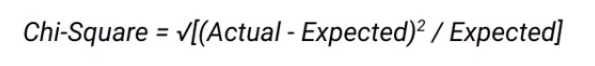
Chi-square measures the statistical significance of the differences between the child nodes and their parent nodes. It is measured as the sum of squared standardized differences between observed and expected frequencies of target variable for each node and is calculated using this formula-
Let’s see how we can calculate the expected values. If you recall this is how the split on “Performance in class” looks like-
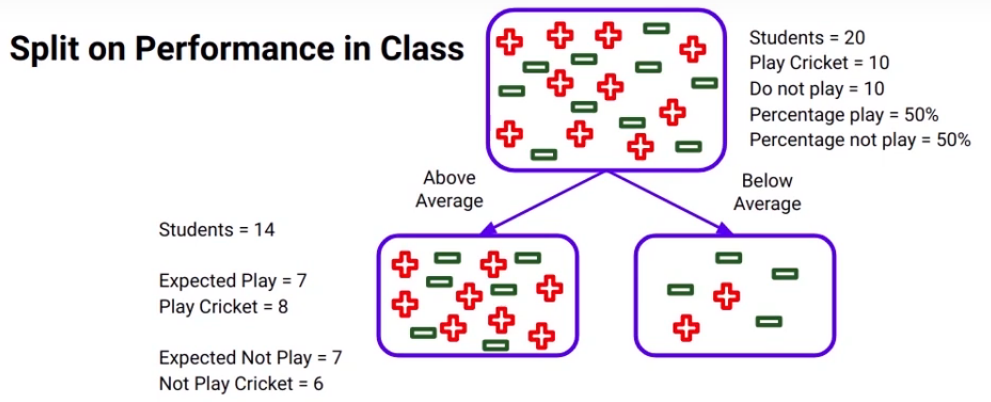
We’ve seen this before. There is a total of 20 students and out of those 10 play cricket and 10 do not. So, of course, the percent of students who do play cricket will be 50%. Now if we consider the “Above average” node here, there are 14 students in it, as the percentage of students who play cricket is 50% in the parent node as we discussed, the expected number of students who play cricket will of course be 7 and if you look at the actual value it is 8. So now we have both the values expected values and actual values.
The expected was 7 and the actual turns out to be 8, so we can infer that the expected value is calculated based on the distribution of the parent node of the same class. Similarly, the expected number of students who do not play cricket will be 7. I want you to intuitively think about this because remember the percentage of students who do not play cricket in the parent node is 50% as well and then here the actual value turns out to be 6.
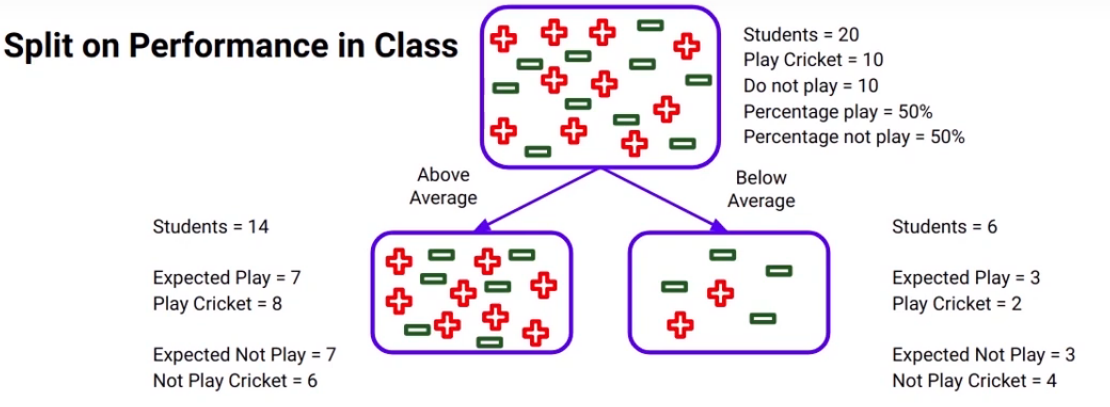
Similarly for the below-average node expected to play and not play will be 3. Whereas the actual values are- 2 students play cricket and 4 do not.
Now we can calculate the chi-square using the formula mentioned above for each child node. Can you guess what will be the chi-square value if the actual and expected values are the same? It’s actually pretty simple, it will be zero because both the actual and expected are the same and the difference will be zero.
Now if both values are the same we can generate an inference that the distribution of the child node is the same as there is the parent node and hence we are not improving the purity of the nodes. On the other hand, if the chi-square value is high it means that the distribution of child nodes is changing with respect to the parent node and we are going in a direction to
achieve more pure nodes hence we can say that:
Higher the chi-square value more will be the purity of the nodes after a split.
Properties of chi-square
Let’s look at some of the properties of chi-square before understanding how it actually works-
- Chi-square just like Gini impurity works only with categorical variables so we cannot use it for continuous targets.
- The higher the value of chi-square more the sub-nodes are different from the parent node and hence the homogeneity is more.
These are some of the properties of chi-square and you must consider these properties before choosing the right algorithm for deciding the split.
Steps to Calculate Chi-Square for a split-
Let’s now understand the steps to calculate chi-square for a split-
- First, we need to calculate the expected values for each class.
- Then we calculate the chi-square for individual nodes using this formula that we’ve seen before-
Here actual is what we actually have as the output and expected means what we’ve already calculated.
- Finally, we calculate the chi-square for split using the sum of the chi-square of each child node for that split.
Don’t worry I’m going to show you an example and this will be extremely clear by the time you’re done with it so let’s again compare these two splits, one, of course, was on “the performance” and the other one was on “the class” they belong to and we’ll compare the chi-square statistic. This is the split on “performance in class” and the actual and expected values as we’ve already calculated earlier-
Let’s now create a table to calculate the chi-square values for this split on “performance in class”:
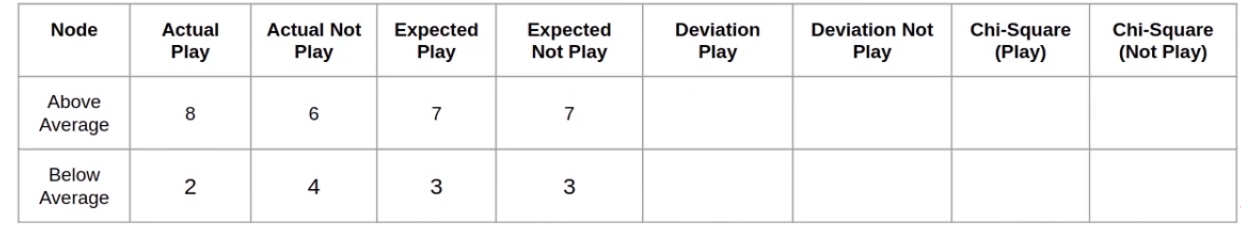
So the actual values for the above-average node are shown in the rable. 8 students are above average and play cricket whereas 6 do not. The expected values will be 7 for both, as again we’ve discussed before. Similarly, we’ll calculate the values for the second node which will be the below-average node. So 2 students below-average play cricket and 4 do not and as a total of students below average only 6, expected values would be 3 both.
Next, we will calculate the deviation of actual values from the expected values for both classes:
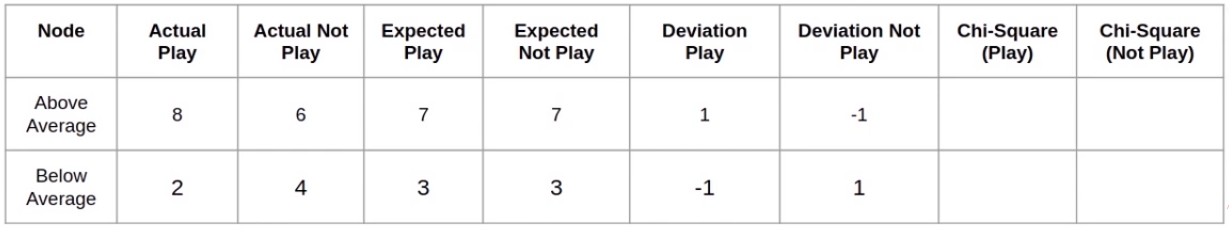
So 8 – 7 will give us 1 and 6 – 7 will give minus 1. we will do the same thing for the below-average node as well. Finally, we have to calculate the chi-square values using the formula:
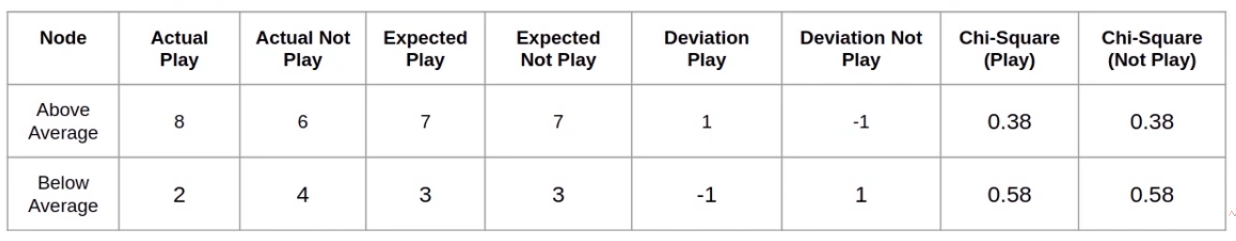
We have (the actual – expected values) stored as deviations in the table. Remember these deviations are the actual – expected
values, we will square those values divided by the expected values and take the square root of those values. Let’s do that!
Above average Chi-Square(Play) = √ [(1)² / 7] = √ 0.1428 ≈ 0.38
Below average Chi-Square(Play) = √ [(-1)² / 3] = √ 0.3333 ≈ 0.58
So when you plug in the values the chi-square comes out to be 0.38 for the above-average node and 0.58 for the below-average node.
Finally the chi-square for the split in “performance in class” will be the sum of all these chi-square values:
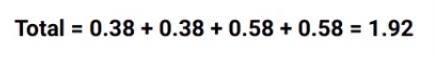
which as you can see here comes out to be 1.9 and this is the chi-square value for the split on “performance in class”.
Alright! similarly, we will calculate the chi-square value for the split on “the class” variable.
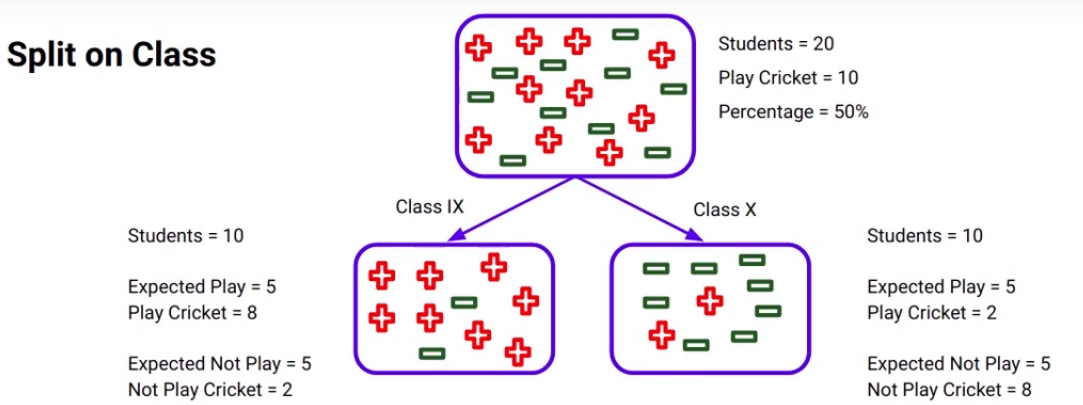
We will again calculate the table:
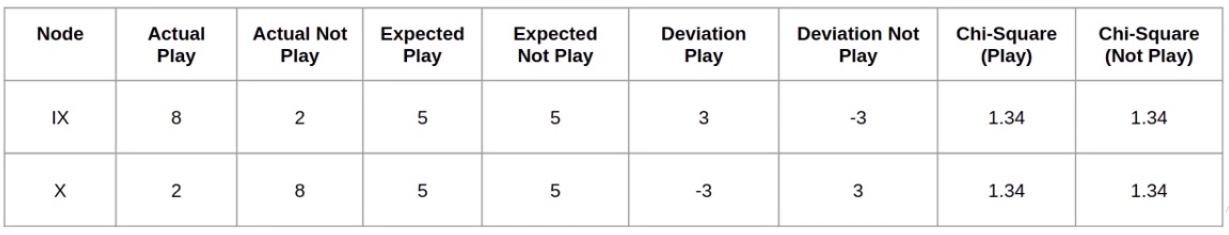
I suggest you calculate these values on your own and check your results with the values that you can see in this table. This will help you to understand how the chi-square process is working and finally, we’ll calculate the chi-square value for the split on class which will be the sum of all chi-square values:
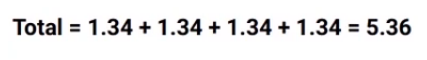
which comes out to be around 5.36. So what do you think we should do next? We will compare the two chi-square values and see which one is higher-
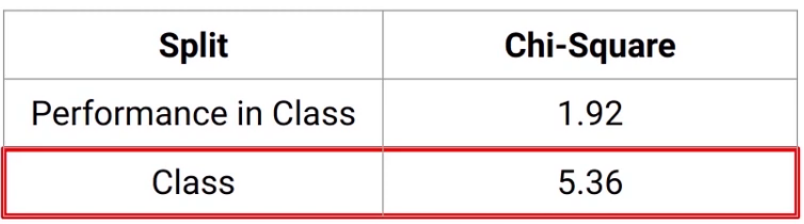
And the population will split on “the class” variable as we can see here. Remember we saw the same result using the Gini index as well? The variable “Class” came out to be the split while using Gini Index as well.
End Notes
We saw the Chi-Square algorithm used for splitting the Decision Trees. This is also used for categorical targets. So we’ve covered two different algorithms so far and we saw that the results of both the algorithms have been quite similar.
If you are looking to kick start your Data Science Journey and want every topic under one roof, your search stops here. Check out Analytics Vidhya’s Certified AI & ML BlackBelt Plus Program
If you have any queries let me know in the comment section!
Himanshi Singh
30 Mar 2021
I am a data lover and I love to extract and understand the hidden patterns in the data. I want to learn and grow in the field of Machine Learning and Data Science.


