This article was published as a part of the Data Science Blogathon.
Introduction
Dispersion of data used to understands the distribution of data. It helps to understand the variation of data and provides a piece of information about the distribution data. Range, IOR, Variance, and Standard Deviation are the methods used to understand the distribution data.
Dispersion of data helps to identify outliers in a given dataset.
Overview
In this article, I’ll cover the following questions related to the dispersion of data.
- Importance of a range.
- Why IQR preferred across the range?
- Why IQR accept data sorted in ascending order, not in descending order?
- Impact on outliers when data is sort in ascending order and descending order.
- Why does standard deviation accept over the mean absolute deviation?
- Why do we use n-1 in
the denominator of standard deviation? Or the concept of degree of freedom.
Range
The range is the easiest dispersion of data or measure of variability. The range can measure by subtracting the lowest value from the massive Number. The wide range indicates high variability, and the small range specifies low variability in the distribution. To calculate a range, prepare all the values in ascending order, then subtract the lowest value from the highest value.
.
Range = Highest_value – Lowest_value
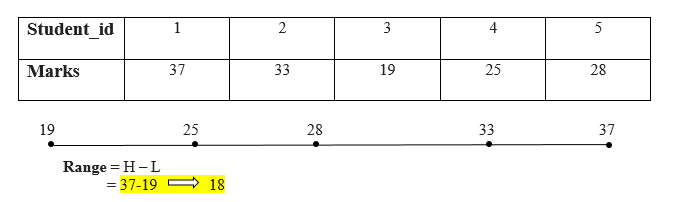
The range of marks is 18.
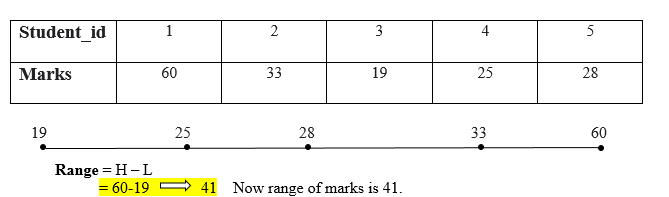
The range can influence by outliers. If there is one extreme value that can change the value of a range.
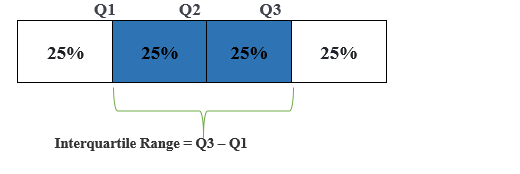
Interquartile Range (IQR)
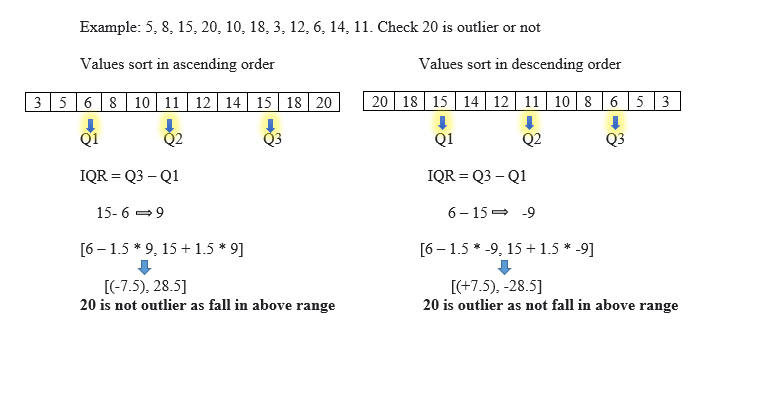
IQR is a range (the boundary between the first and second quartile) and Q3 (the boundary between the third and fourth quartile).IQR is preferred over a range as, like a range, IQR does not influence by outliers. IQR is used to measure variability by splitting a data set into four equal quartiles.
IQR uses a box plot to find the outliers. ”To estimating IQR, all the values form (sort) in the ascending order else it will provide a negative value, and that influences to find the outliers.”
Formula to find outliers
[Q1 – 1.5 * IQR, Q3 + 1.5 * IQR]
If the value does not fall in the above range it considers outliers.
Variance
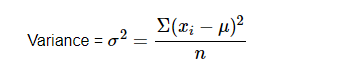
Variance is a simple measure of dispersion. Variance measures how far each number in the dataset from the mean. To compute variance first, calculate the mean and squared deviations from a mean.
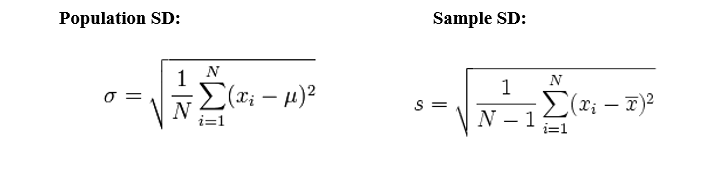
Population variance
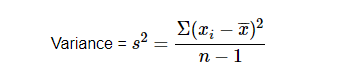
Sample variance
Observation near to mean value gets the lower result and far from means gets higher value.
Description of a variance formula with example.
Standard Deviation
Standard deviation is a squared root of the variance to get original values. Low standard deviation indicates data points close to mean.
The normal distribution is conventional bits of help to understand the standard deviation.
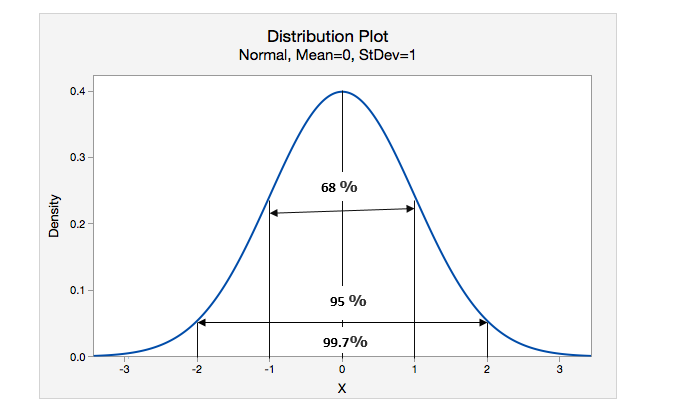
X indicates the mean value
68 % of values lie within 1 standard deviation.
95 % of values lies within 2 standard deviation.
99.7 % of values lie within 3 standard deviation.
Specification of Standard deviation and Mean Absolute deviation (Why SD is more reliable than MAD) by an example.
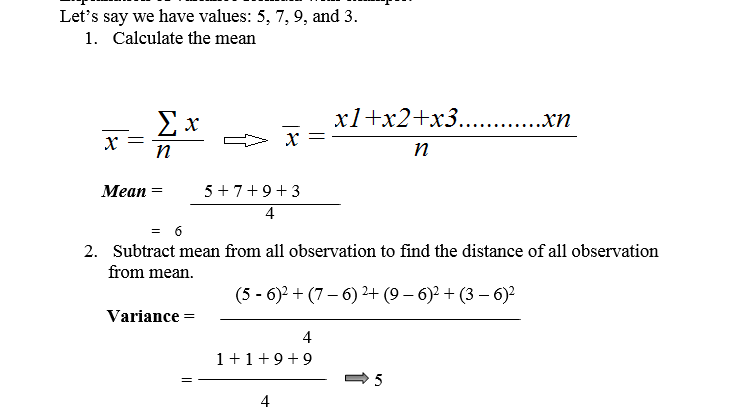
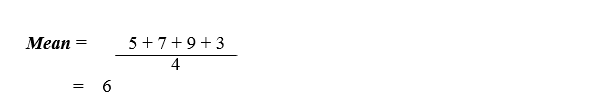
Suppose we have 4 values are 5, 7, 9, and 3.
1. Calculate the Mean :
2. To compute variance, first need to subtract the mean from all observations to find the distance of all values from the average (mean).
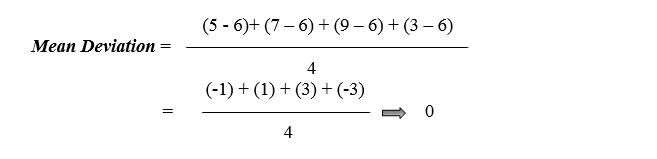
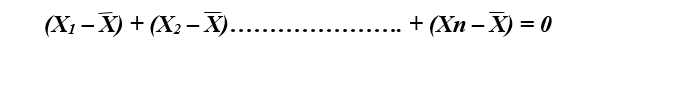
We noticed the result as zero because whenever we discussed the mean, the identity properties of a sample mean “deviation of a means is always sum to zero. “
Therefore we have to work on it. We don’t want negative values (as distance cannot be negative). We need something that secures negative values into positive numbers. We can practice either Mean absolute deviation or squared deviation (Standard deviation).
Mean absolute deviation (MAD):
MAD is the measure of spread (variability).
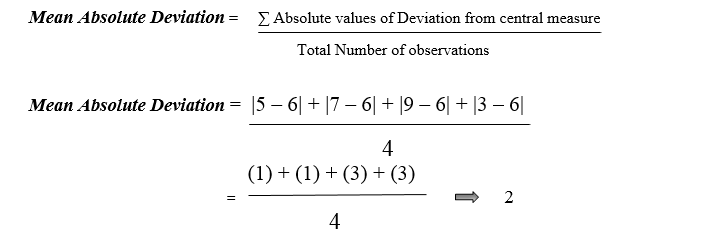
Here | gives the absolute value that means all negative deviation (distance) made positive.
The problem with MAD is that it is not well behaved as squared deviation dose in a normal distribution, and it is not differential. It is most salutary to use squared deviation than MAD as squared deviation has well mathematical properties for the normal distribution.
Squared Difference
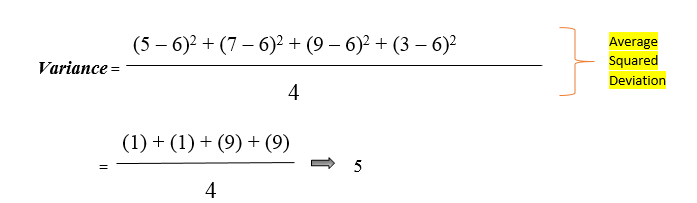
Squaring amplifies the effect of massive differences. Variance gives added weight to the values that impact outliers (the numbers that are far from
the mean and squaring of these numbers can skew the data like 10 square is 100, and 100 square is 10,000 ) to overcome the drawback of variance standard deviation came into the picture.
Standard deviation uses the square root of the variance to get original values.

Now, you may have one question why do we use n-1 in the denominator of sample variance.
A population gives a true mean, and a sample statistic is an approximation population parameter which means a population mean is already known. The sample mean estimates the population means, and sample variance s2 estimates population variance. “ 10 different samples gives 10, different variances”.
n-1 means the degree of from where 1, is we lost 1 degree of freedom.
Degree of Freedom (DOF): DOF means how many values are free to vary.
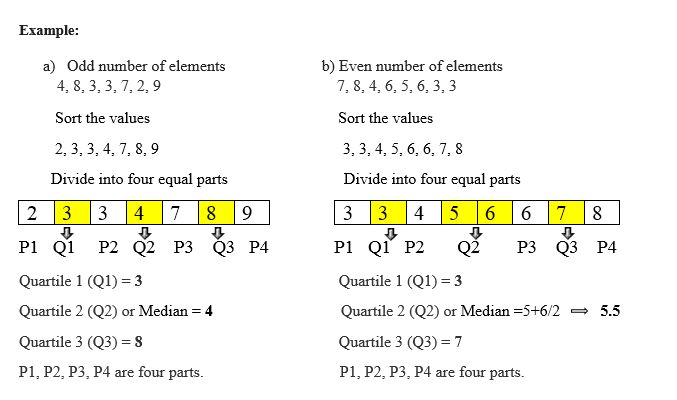
Example:
Suppose we draw four independent observations from a population where is the population mean is known μ = 80.
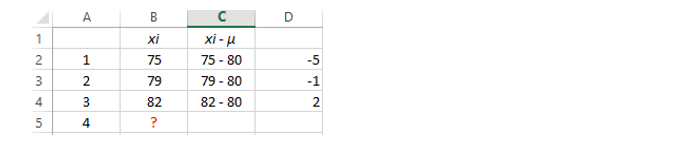
For the 4th value, we can place any number that will not impact the result as the population provides the true mean.
Therefore in the population, four numbers are free to vary.
When we talk about the sample mean, one property of sample mean is “Deviation from the sample means always summing to zero.”
Suppose we have the same situation but, μ is unknown (as in sample means, we estimate the population means), and find the sample mean = 80.
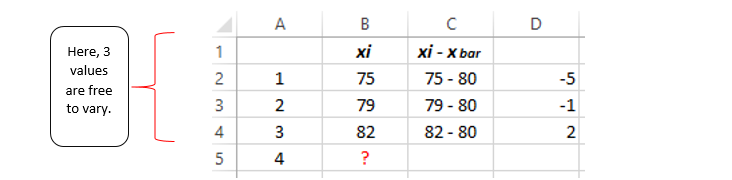
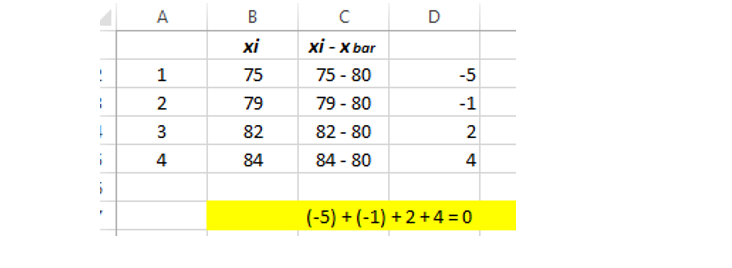
Here for observation 4th, we cannot place either value as we have to satisfy sample mean property so that we have to add the value for the observation 4th that will sum to zero. Therefore we can state that for observation 4th, we lost one degree of freedom.
To satisfy the sample mean deviation property, we can place 84 so that 84-80 will return 4, and following that, when we combine all the values that sum to zero.
Summary of the article, the range is a difference between a large number and a small number. The range can influence by an outlier. In IQR, all the numbers should arrange in an ascending order else it will impact outliers. Variance uses squaring that can create outliers, and to overcome this drawback, we use standard deviation. In the denominator, n-1 indicates the degree of freedom (how many values are free to vary).
It is good practice to use standard deviation over MAD as standard deviation has a well mathematical property in the normal distribution.
The media shown in this article on Dispersion of Data are not owned by Analytics Vidhya and is used at the Author’s discretion.


Useful material thank you