
Exploratory data analysis is a data exploration technique to understand the various aspects of the data. It is a kind of summary of data. It is one of the most important steps before performing any machine learning or deep learning tasks.
Data Scientists carry out exploratory data analysis procedures to explore, dissect, and sum up the fundamental qualities of datasets, regularly using information representation approaches. EDA procedures take into consideration compelling control of information sources, empowering Data Scientists to discover the appropriate responses they need by finding information designs, spotting inconsistencies, checking suppositions, or testing speculation.
Data Scientists utilize exploratory data analysis to observe what datasets can uncover further past conventional demonstrating of information or speculation testing assignments. This empowers them to acquire top to bottom information on the factors in datasets and their connections. Exploratory data analysis can help recognize clear mistakes, distinguish exceptions in datasets, get connections, uncover significant elements, discover designs inside information, and give new bits of knowledge.
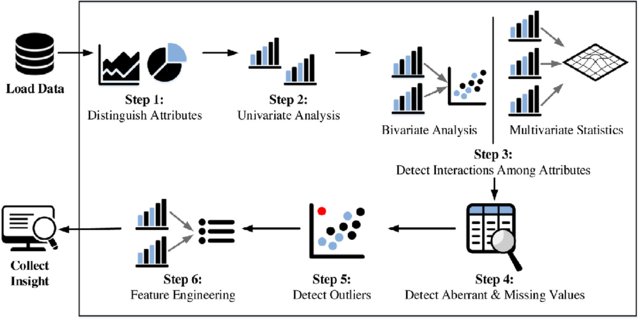
Steps In Exploratory Data Analysis
Expanded client movement on the web, refined instruments to screen web traffic, the multiplication of cell phones, web empowered gadgets, and IoT sensors are the essential elements speeding up the pace of the information age in this day and age. In this computerized age, associations of all sizes understand that information can assume a crucial part in improving their proficiency, profitability, and dynamic abilities, prompting expanded deals, income, and benefits.
Nowadays, most organizations approach immense datasets, yet only having huge measures of information doesn’t enhance the business except if ventures investigate the data accessible and drive authoritative development.

In the lifecycle of a data science project or any machine learning project, more than 60% of your time goes into stuff like data analysis, feature selection, feature engineering, etc. Because it is the most important part or backbone of a data science project is that particular part itself where you have to a lot of activities like cleaning the data, handling missing values, handle outliers, handle imbalanced datasets, how to handle categorical features, and many more. So if you want to save your time in exploratory data analysis then we can use python libraries like dtale, pandas profiling, sweetviz, and autoviz to automate our tasks.

In this blog, we are discussing four important python libraries. These are listed below:
It is a library that has been launched in February 2020 that allows us to visualize pandas data frame easily. It has many features which are very handy for exploratory data analysis. It is made using flask backend and reacts frontend. It supports interactive plots, 3d plots, heat maps, the correlation between features, builds custom columns, and many more. It is the most famous and everyone’s favorite.
dtale can be installed using the below code:
pip install dtale
Let’s deep dive into exploratory data analysis using this library. First, we have to write some code to launch the d-tale interactive application locally:
import dtale
import pandas as pd
df = pd.read_csv(‘data.csv’)
d = dtale.show(df)
d.open_browser()
Here we are importing pandas and dtale. We are reading the dataset using the read_csv() function and finally shows data in the browser locally using the show and open browser function.
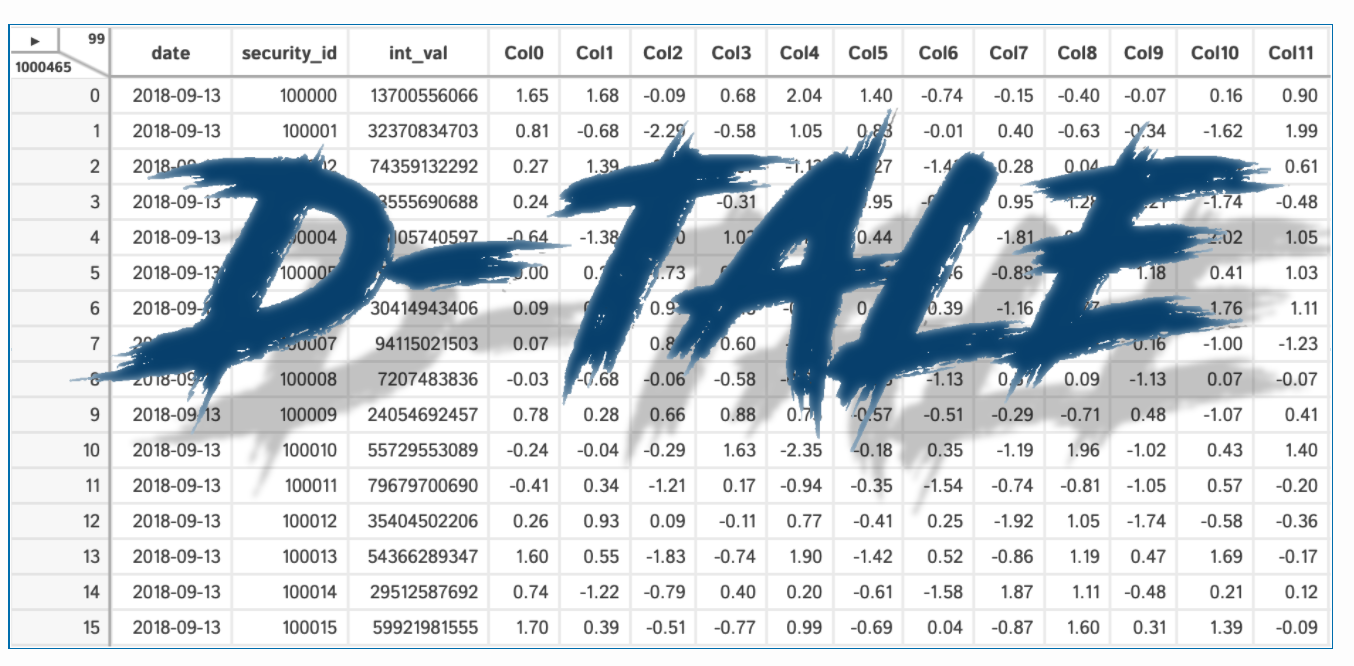
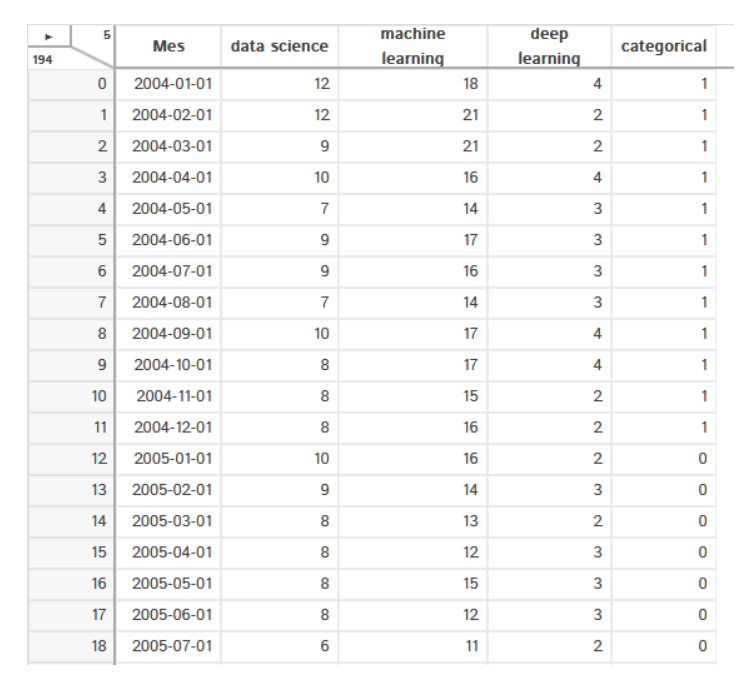
It shows the data in the same way as pandas do, but it has one additional feature, it has a menu in the top left corner that allows us to do many things and it shows a count of columns and rows in our dataset.
The output of the above code is shown below:
If you click any column heading, the drop-down menu will appear. It will give you a lot of options like sort the data, describe the dataset, column analysis, and many more. You can check out this feature on your own as well
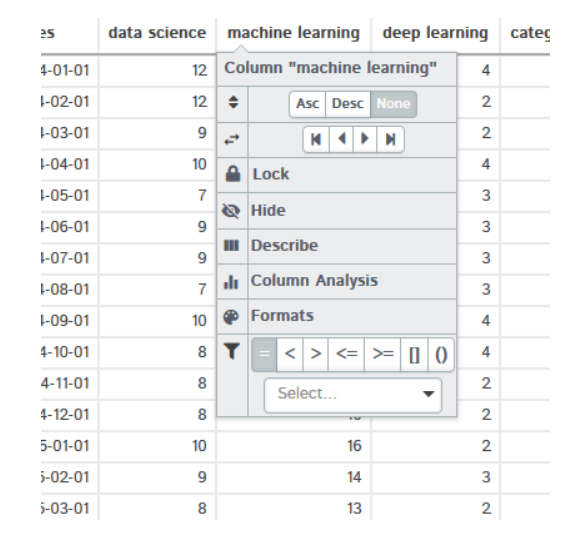
If you click on Describe, then it shows statistical analysis of the selected column like mean, median, max, min variance, standard deviation, quartiles, and many more.
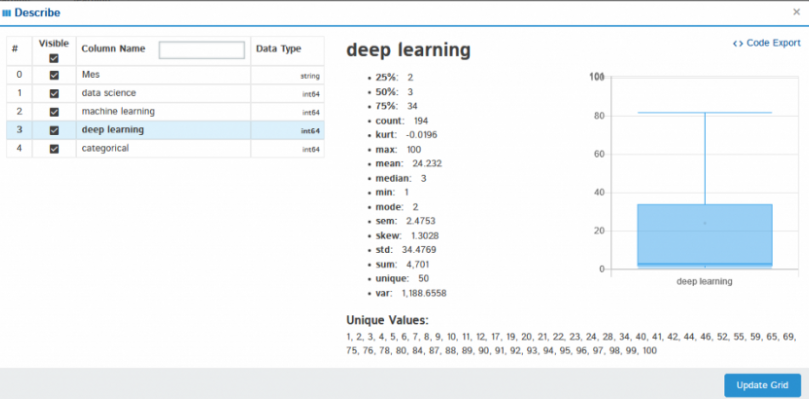
Similarly, you can try other features on your own like column analysis, formats, filters.
Magic of dtale – click on the menu button and you’ll find all available option
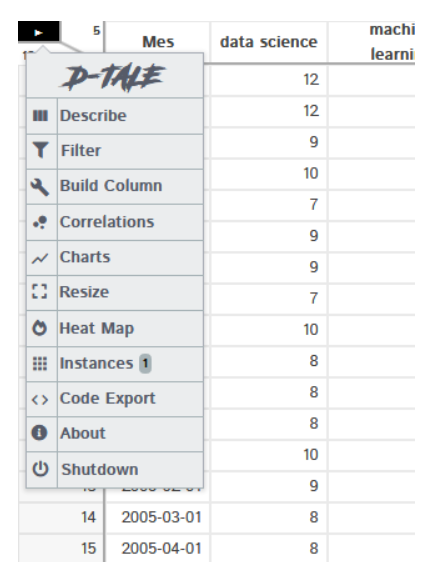
It is not possible to cover all the features but I am covering the most interesting one
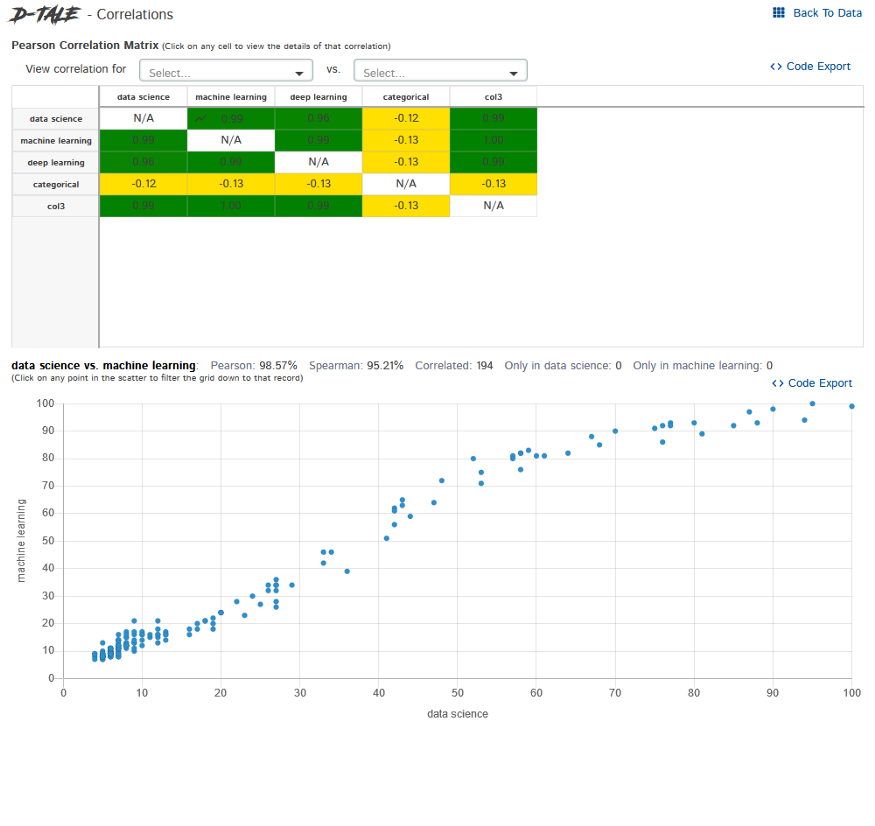
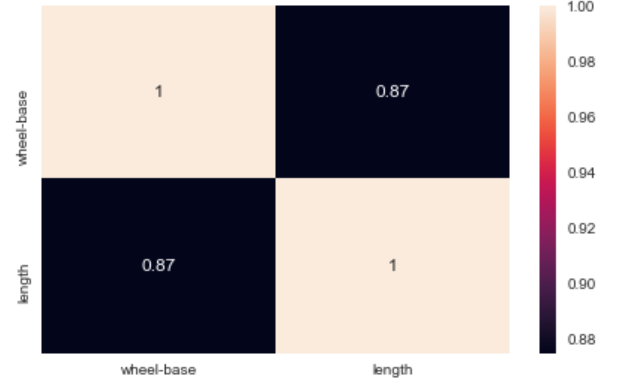
Correlations – It shows us how columns are correlated with each other
Charts– Build customs charts like line plot, bar graph, pie chart, stacked chart, scatter plots, geological maps, etc.
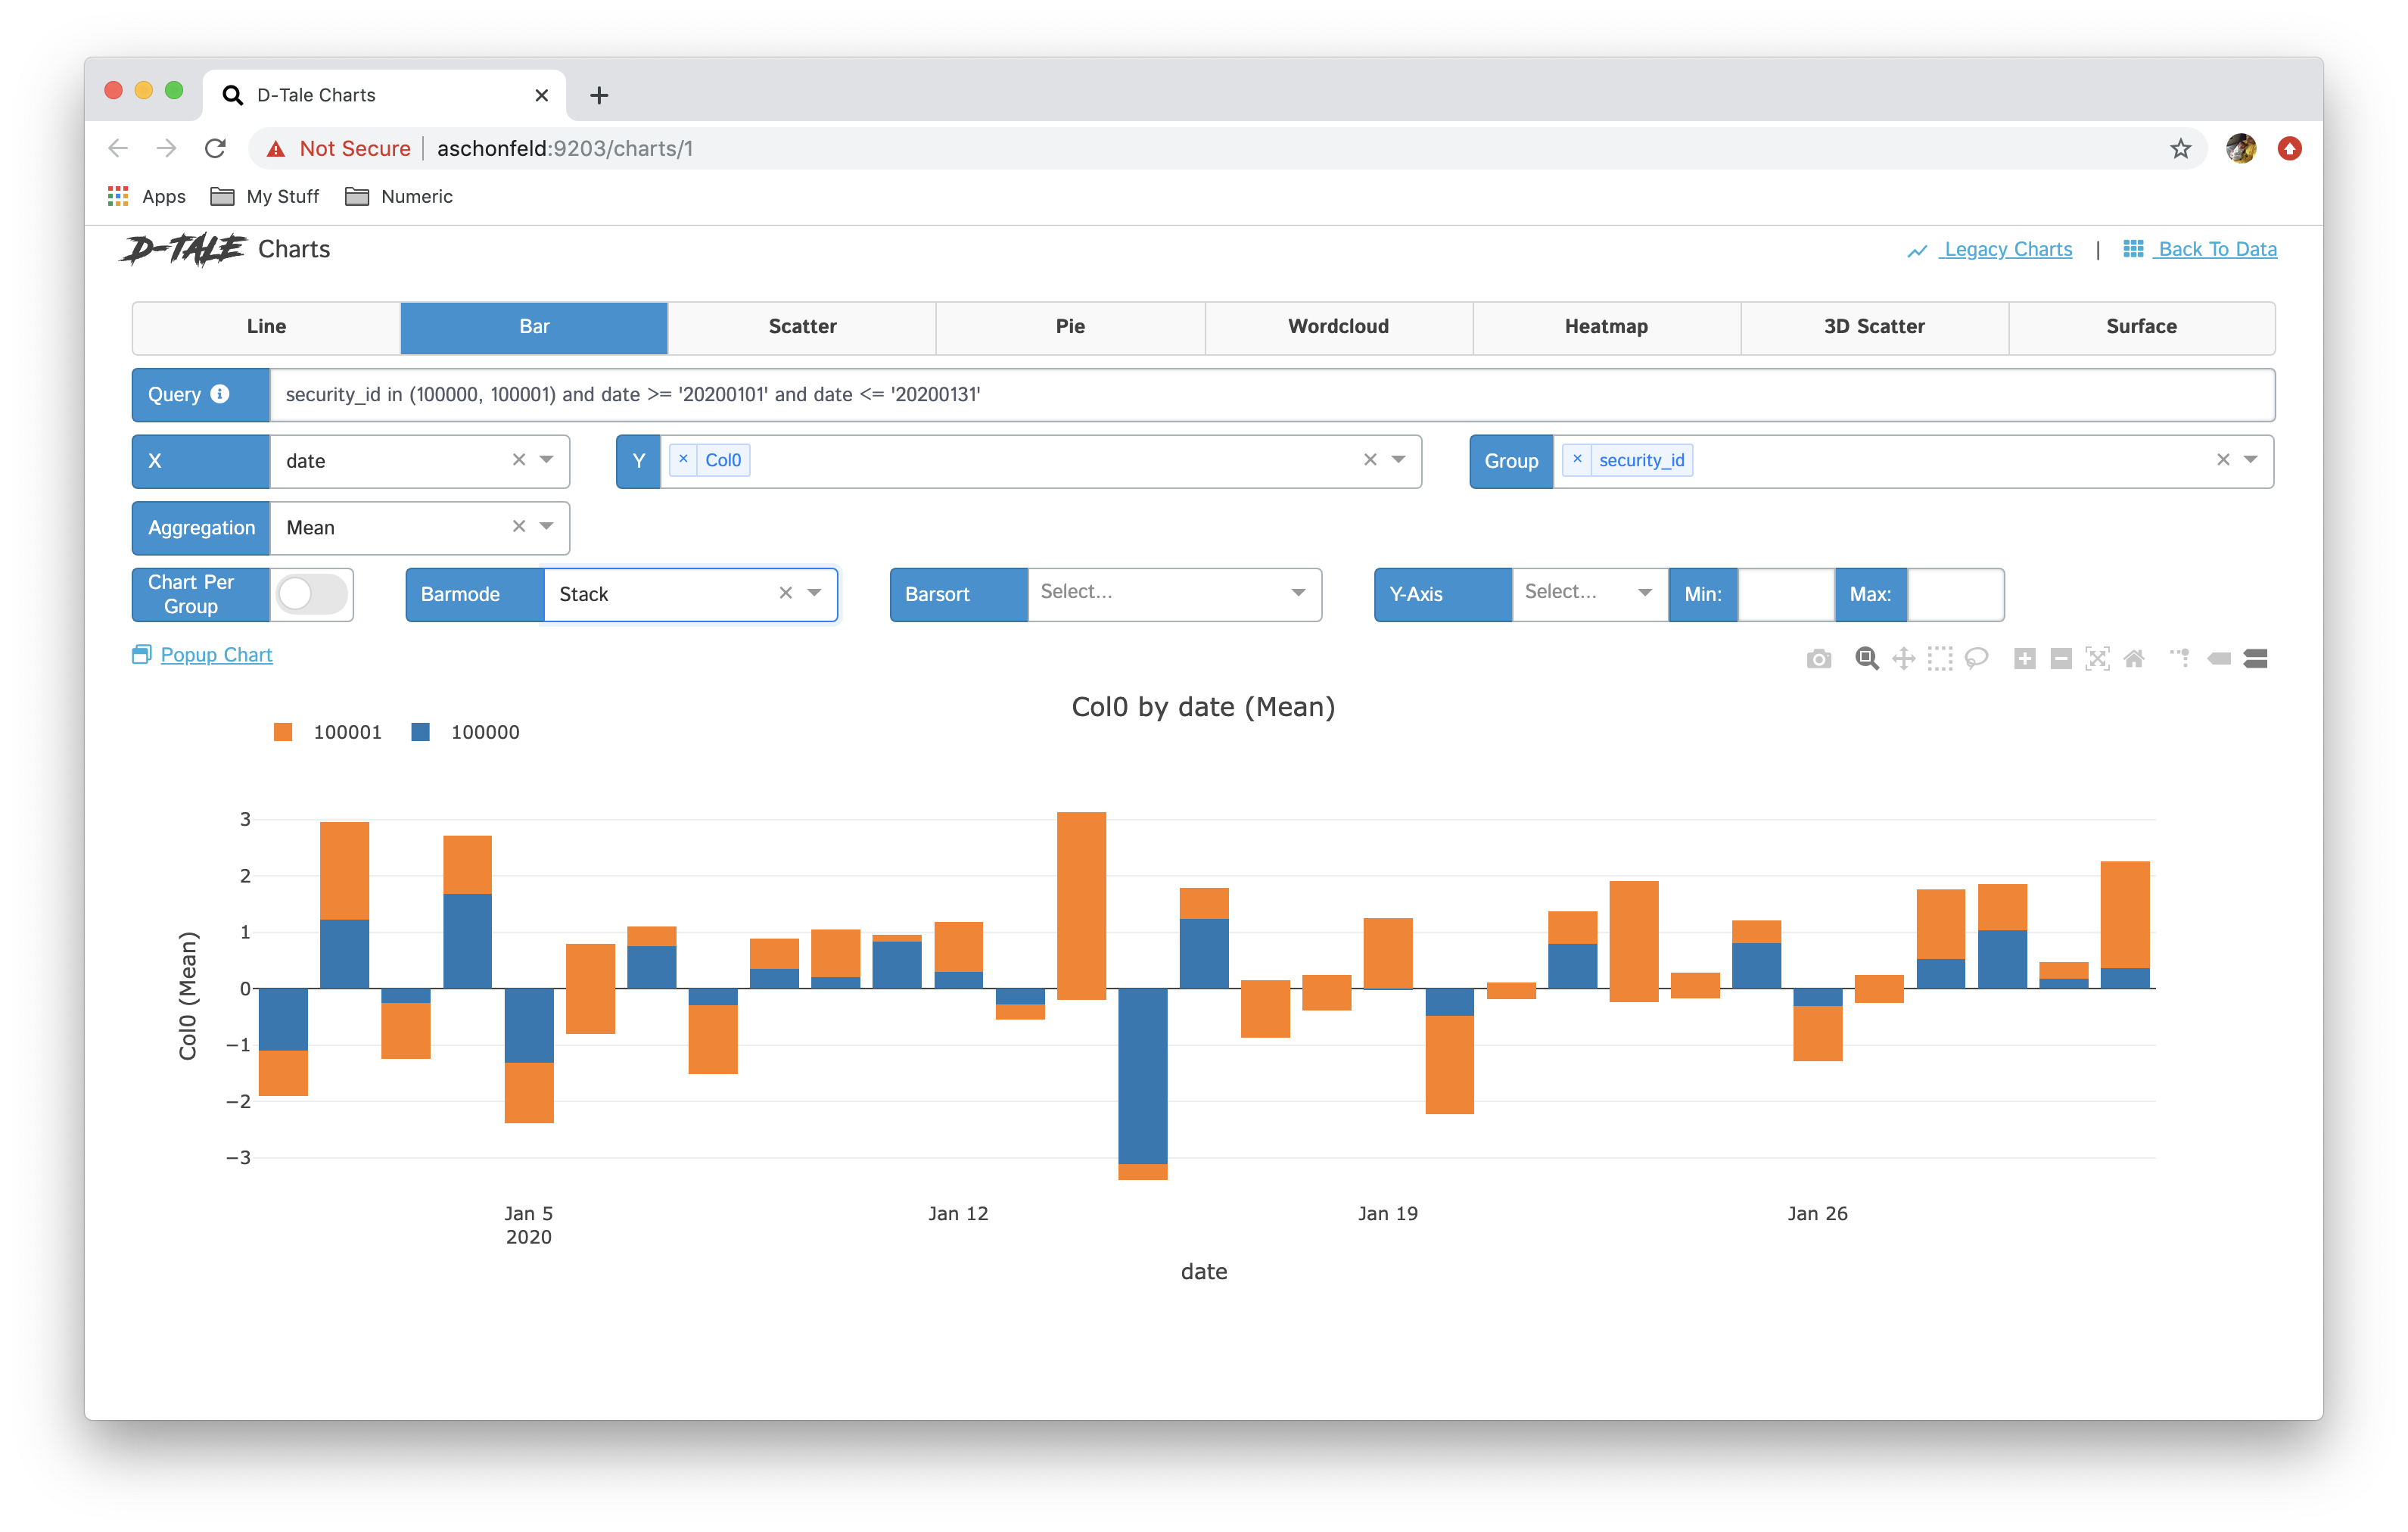
There a lot of optional available in this library for data analysis. This tool is very handy and it makes exploratory data analysis much faster as compared to using traditional machine learning libraries like pandas, matplotlib, etc.
For official documentation check this link:

It is an open-source library written in python and it generated interactive HTML reports and describes various aspects of the dataset. Key functionalities include handling missing values, statistics of dataset like mean, mode, median, skewness, standard deviation etc, charts like histograms and correlations as well.
pandas profiling can be installed using the below code:
pip install pandas-profiling
Exploratory Data Analysis Using Pandas Profiling
Let’s deep dive into exploratory data analysis using this library. I am using a sample dataset to start with pandas profiling, Check the below code:
#importing required packages
import pandas as pd
import pandas_profiling
import numpy as np

#importing the data
df = pd.read_csv('sample.csv')

#descriptive statistics
pandas_profiling.ProfileReport(df)
Below is the magic output of the above code
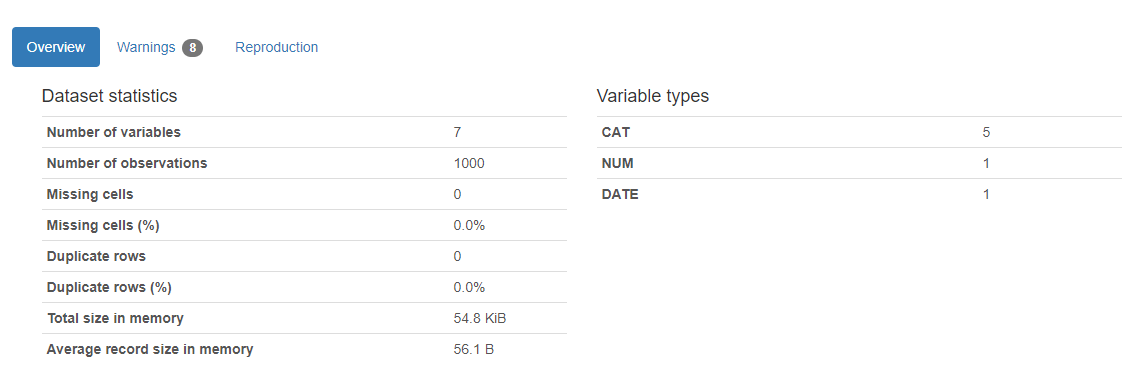
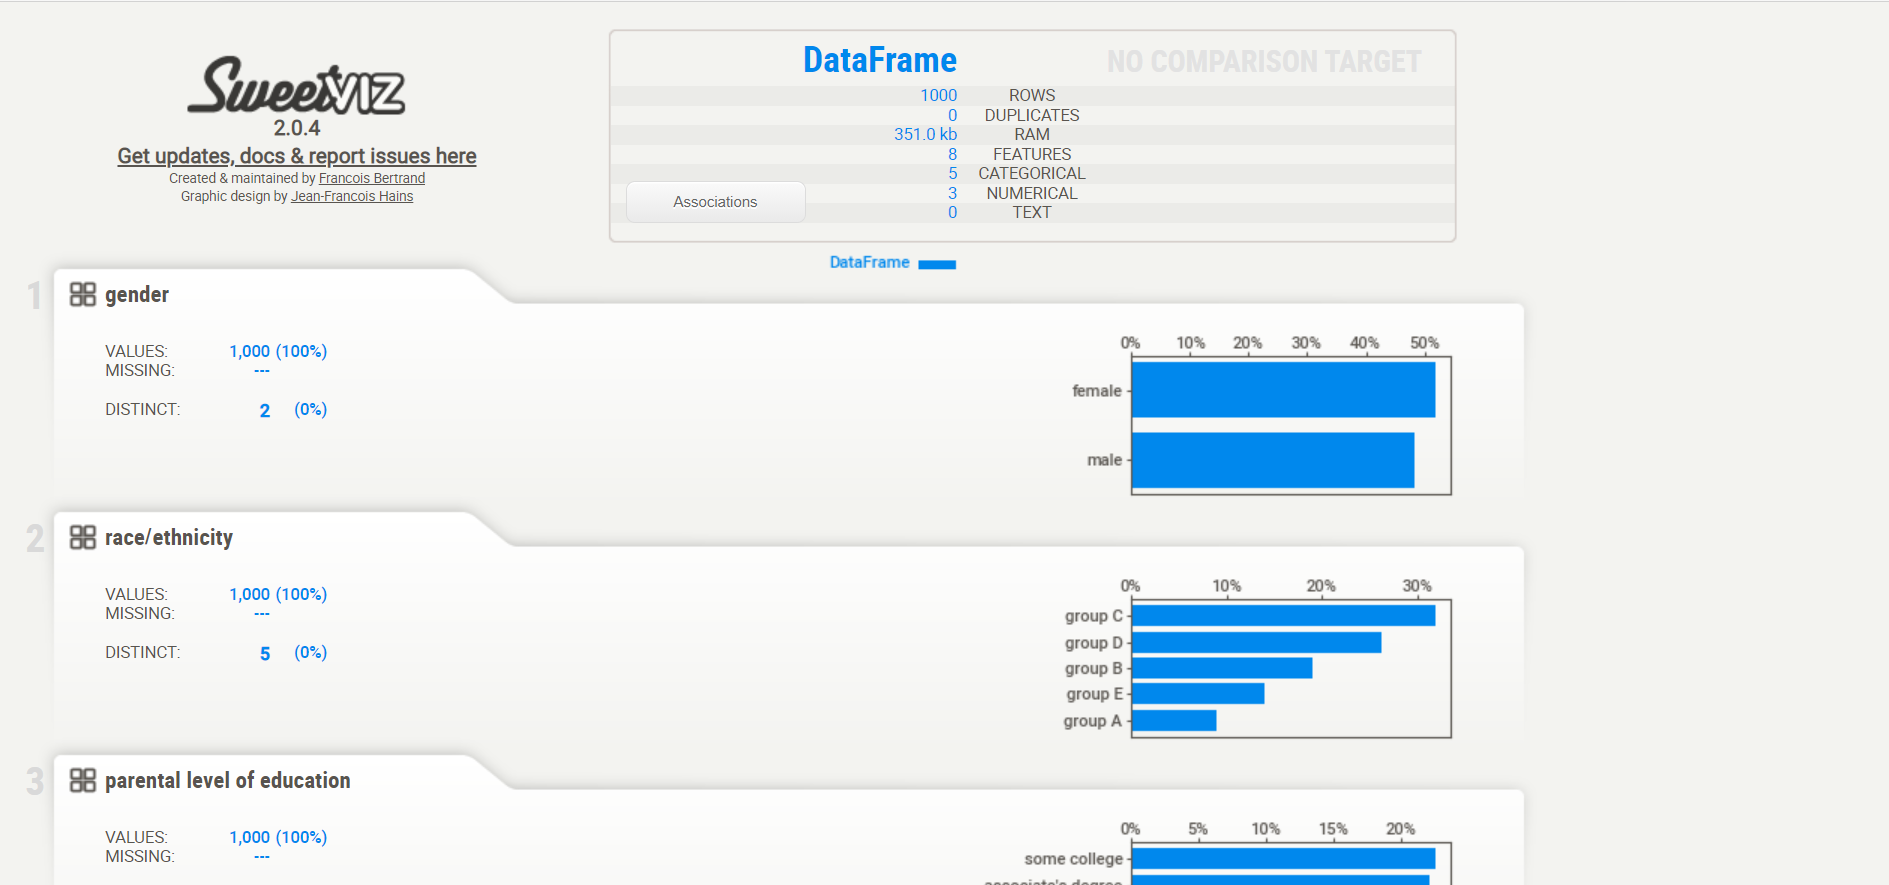
Here is the result. A report will appear and it returns how many variables in our dataset, the number of rows, missing cells in the dataset, percentage of missing cells, number and percentage of duplicate rows. Missing and duplicates cells data are very important for our analysis as it describes the broader picture of the dataset. The report also shows the total size of memory. It also shows variable types as well on the right-hand side of the output.
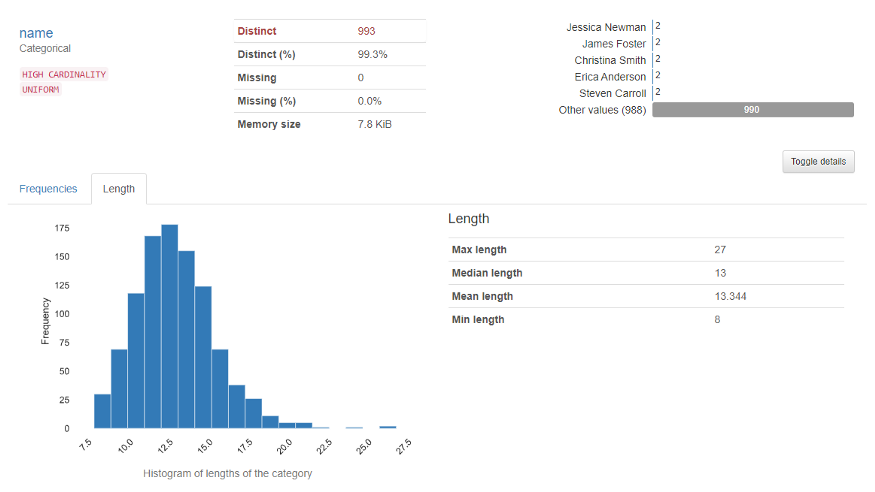
The variable section shows the analysis of a particular column. For example for the categorical variable, the below output will appear.
For the numerical variable, the below output will appear
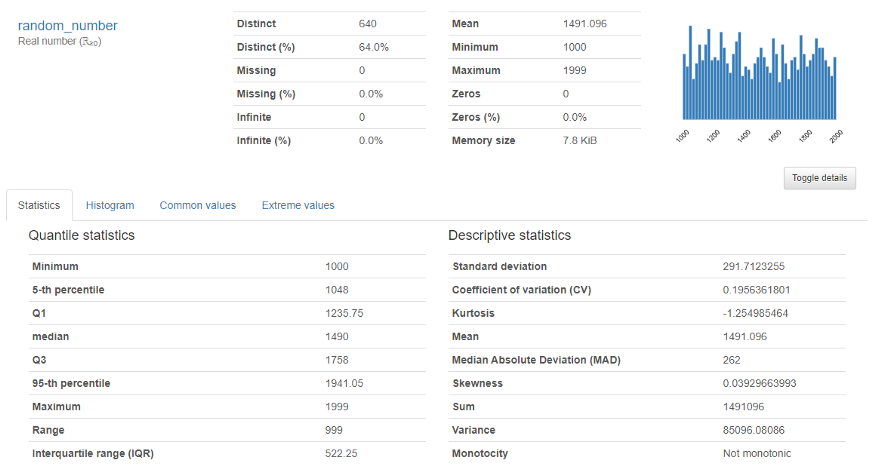
It provides an in-depth analysis of numerical variables like quantile, mean, median sum, variance, monotonicity, range, kurtosis, interquartile range, and many more.
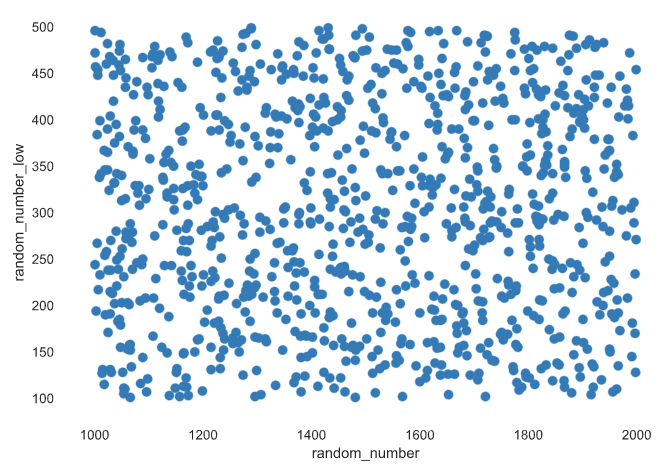
Correlations and Interaction: It describes how variables are correlated with each other using. This data is very much necessary for data scientists.
For more information, check the official documentation:
It is an open-source python library that used to get visualizations which is useful in exploratory data analysis with just a few lines of codes. The library can be used to visualize the variables and comparing the dataset.
This library can be installed using the below code:
pip install sweetviz
Exploratory Data Analysis Using SweetViz
Let’s deep dive into exploratory data analysis using this library. I am using a sample dataset to start, Check the below code
import sweetviz
import pandas as pd
df = pd.read_csv('sample.csv')
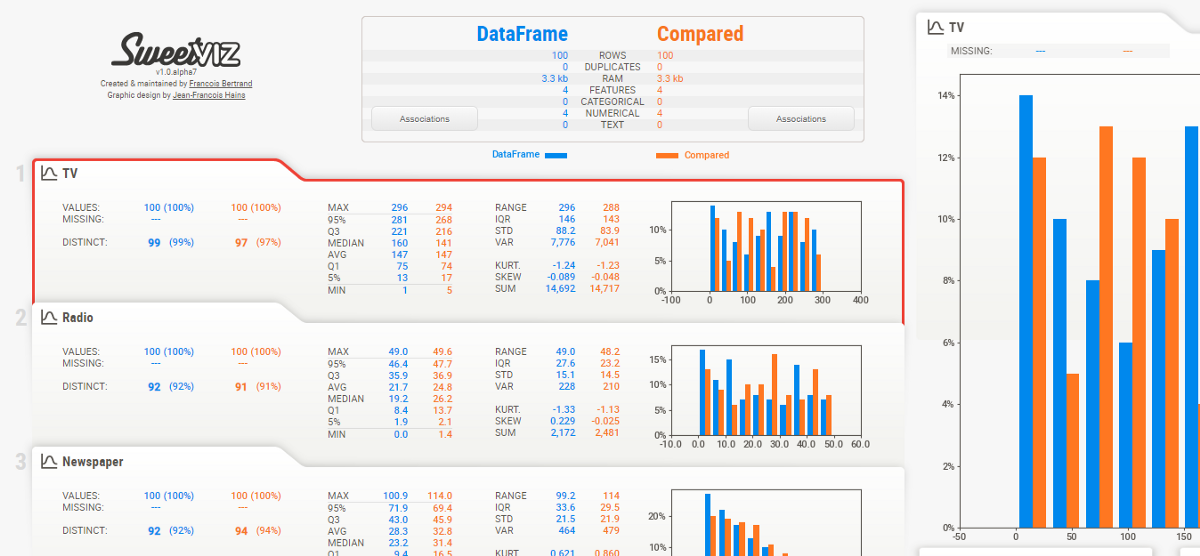
my_report = sweetviz.analyze([df,'Train'], target_feat='SalePrice')
my_report.show_html('FinalReport.html')
Final Report:
For more information, check official documentation:
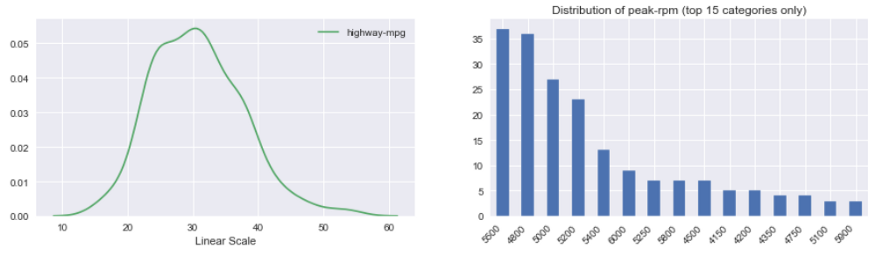
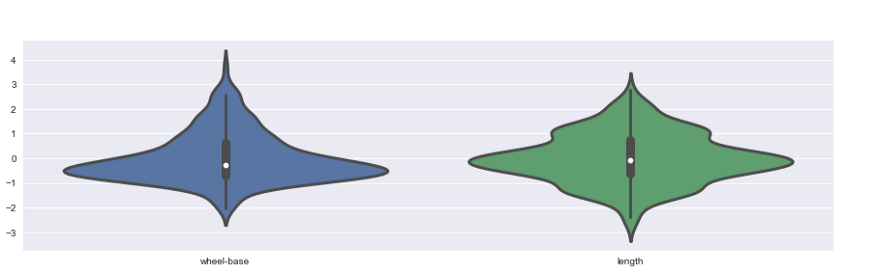
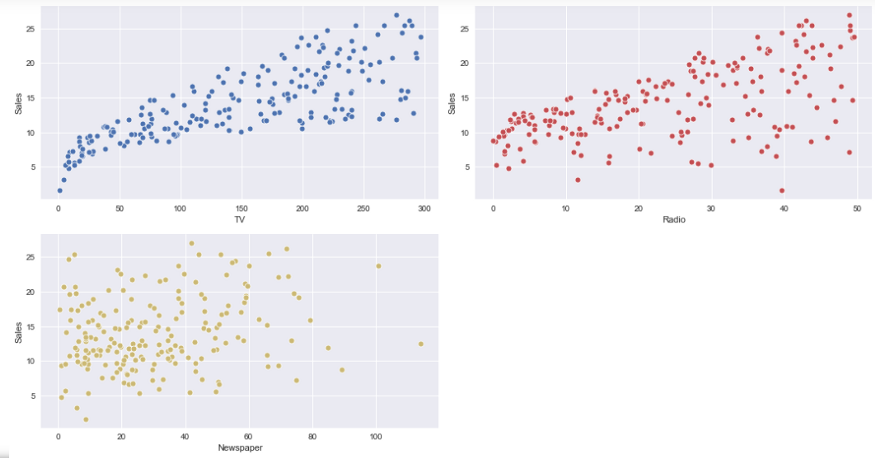
It stands for Automatically Visualize. Visualization is possible with any size of the dataset with a few lines of code.

pip install autoviz
Sample code:
from autoviz.AutoViz_Class import AutoViz_Class
AV = AutoViz_Class()
df = AV.AutoViz('sample.csv')
For more information, check official documentation:
Thanks for reading this. If you like this article then please share it with your friends. In case of any suggestion/doubt comment below.
Email id: [email protected]
Follow me on LinkedIn: LinkedIn
The media shown in this article are not owned by Analytics Vidhya and is used at the Author’s discretion.
Lorem ipsum dolor sit amet, consectetur adipiscing elit,


I am genuinly glad the data exploratory topic is addressed, let alone covered in a python related automation article. Thank you
Thanks for this informative post.