Covid-19 Vaccination: Data Analysis & Visualization
This article was published as a part of the Data Science Blogathon
One of the coolest things I find about Data Science is Data Visualization. I can’t stop myself loving it. I think data visualization is like transform a story into a live-action movie.
Data is like a story that you imagine in your mind but you can’t share it with others in an explainable way but you can share it with others with the power of visualization. It’s like a movie script and when you transform the script into a movie then it becomes Visualization.
Data visualization helps transform your numbers into an engaging story with details and patterns. Data visualization enables us to recognize emerging trends and respond rapidly on the grounds of what we see.
Such patterns make more sense when graphically represented; because visuals and diagrams make it easier for us to identify strongly correlated parameters. Humans can process visual images 60,000 times faster than text.
Therefore, seeing a graph, chart, or other visual representation of data is more comfortable for the brain to process.
Here we are gonna analyze and visualize the latest situation of “Covid19 Vaccination“ around the world. You’ll find the dataset here. We will use Plotly & Seaborn for data visualization & for data analysis, we will use pandas.
Importing Libraries:
import numpy as np # linear algebra
import pandas as pd # data processing, CSV file I/O (e.g. pd.read_csv)
import matplotlib.pyplot as plt
import seaborn as sns
import plotly.express as px
from plotly.offline import download_plotlyjs,init_notebook_mode,plot,iplot
import plotly.graph_objects as go
import plotly.figure_factory as ff
from plotly.colors import n_colors
from wordcloud import WordCloud,ImageColorGenerator
init_notebook_mode(connected=True)
from plotly.subplots import make_subplots
from pywaffle import Waffle
import warnings
warnings.filterwarnings("ignore")
Reading the Data:
What is the proportion of Top 10 Vaccine in the race of fighting Covid19?
top10 = new_df['vaccines'].value_counts().nlargest(10)
top10
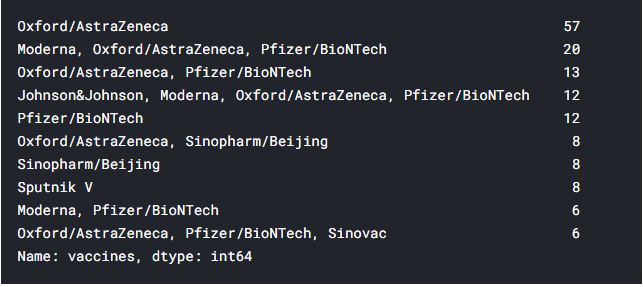
data = dict(new_df['vaccines'].value_counts(normalize = True).nlargest(10)*100)                                  #dict(new_df['vaccines'].value_counts(normalize = True) * 100)
vaccine = ['Oxford/AstraZeneca', 'Moderna, Oxford/AstraZeneca, Pfizer/BioNTech',
       'Oxford/AstraZeneca, Pfizer/BioNTech',
       'Johnson&Johnson, Moderna, Oxford/AstraZeneca, Pfizer/BioNTech',
       'Pfizer/BioNTech', 'Sputnik V', 'Oxford/AstraZeneca, Sinopharm/Beijing',
       'Sinopharm/Beijing', 'Moderna, Pfizer/BioNTech',
       'Oxford/AstraZeneca, Pfizer/BioNTech, Sinovac']
fig = plt.figure(
    rows=7,
    columns=12,
    FigureClass = Waffle,
    values = data,
    title={'label': 'Proportion of Vaccines', 'loc': 'center',
          'fontsize':15},
    colors=("#FF7F0E", "#00B5F7", "#AB63FA","#00CC96","#E9967A","#F08080","#40E0D0","#DFFF00","#DE3163","#6AFF00"),
    labels=[f"{k} ({v:.2f}%)" for k, v in data.items()],
    legend={'loc': 'lower left', 'bbox_to_anchor': (0, -0.4), 'ncol': 2, 'framealpha': 0},
    figsize=(12, 9)
)
fig.show()
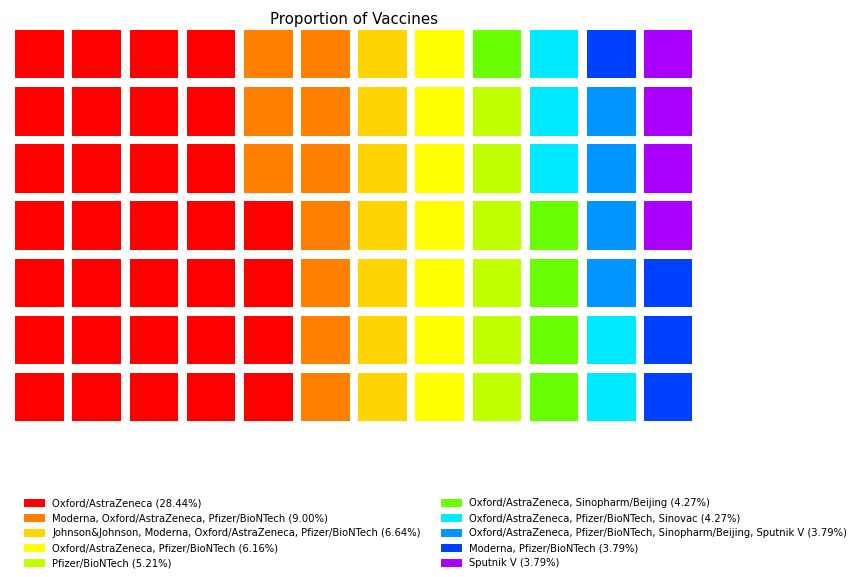
Observation:
- In a range of percentage of vaccines 28.44% used Oxford/AstraZeneca
- Oxford/AstraZeneca is the most used Vaccine
- Later Pfizer/BioNTech was the most used Vaccine and now it’s in 5th place also Oxford/AstraZeneca was not in the top 3 & now it’s in 1st place. Looks like Oxford/AstraZeneca works best among the vaccines
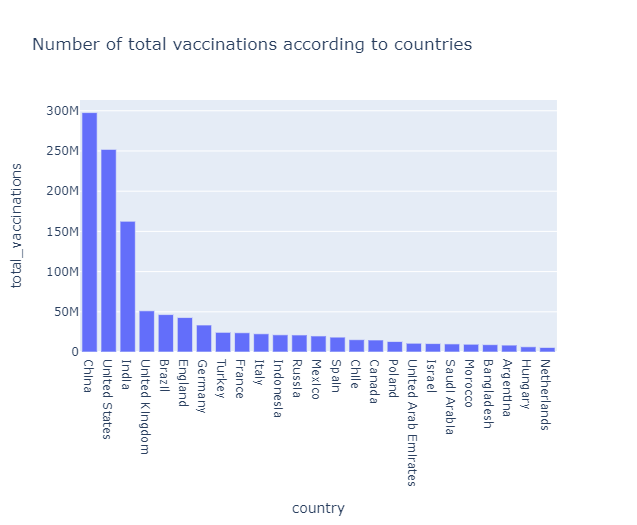
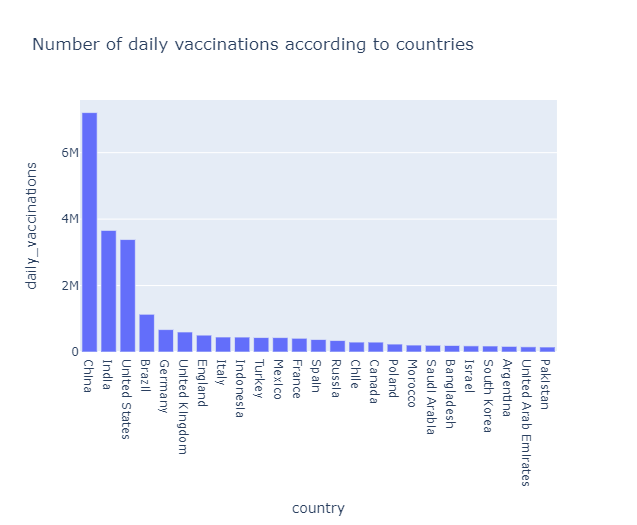
What is the number of total vaccinations & daily vaccinations according to countries?
data = new_df[['country','total_vaccinations']].nlargest(25,'total_vaccinations')
fig = px.bar(data, x = 'country',y = 'total_vaccinations',title="Number of total vaccinations according to countries",)
fig.show()
data = new_df[['country','daily_vaccinations']].nlargest(25,'daily_vaccinations')
fig = px.bar(data, x = 'country',y = 'daily_vaccinations',title="Number of daily vaccinations according to countries",)
fig.show()
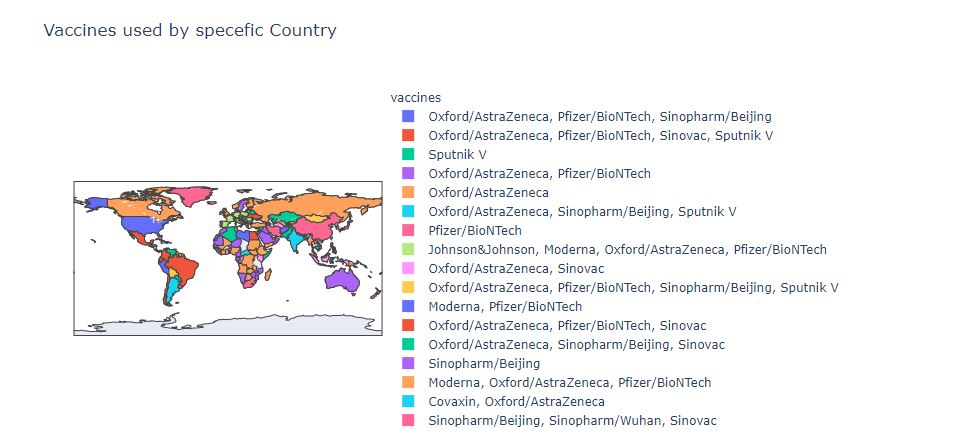
Which vaccine is used by which Country?
vacc = new_df["vaccines"].unique()
for i in vacc:
    c = list(new_df[new_df["vaccines"] == i]['country'])
    print(f"Vaccine: {i}nUsed countries: {c}")
print(‘-‘*70)
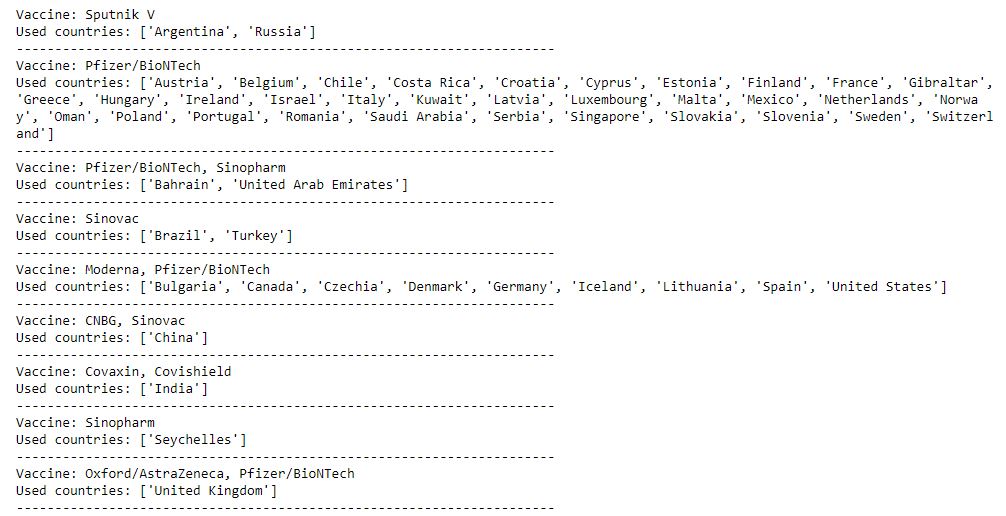
fig = px.choropleth(new_df,locations = 'country',locationmode = 'country names',color = 'vaccines',
                   title = 'Vaccines used by specefic Country',hover_data= ['total_vaccinations'])
fig.show()
Which Vaccine is Used the most?
vaccine = new_df["vaccines"].value_counts().reset_index()
vaccine.columns = ['Vaccines','Number of Country']
vaccine.nlargest(5,"Number of Country")
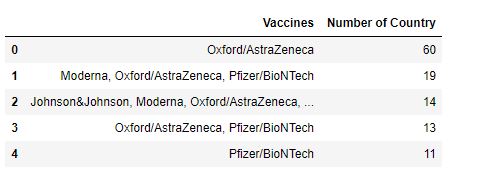
Oxford/AstraZeneca is being used by 60 Countries.
Total Vaccinations per country grouped by Vaccines:
fig = px.treemap(new_df,names = 'country',values = 'total_vaccinations',
                 path = ['vaccines','country'],
                 title="Total Vaccinations per country grouped by Vaccines",
                 color_discrete_sequence =px.colors.qualitative.Set1)
fig.show()
.png)
fig = go.Choropleth(locations = new_df["country"],locationmode = 'country names',
                    z = new_df['total_vaccinations'],
                    text= new_df['country'],colorbar = dict(title= "Total Vaccinations"))
data = [fig]
layout = go.Layout(title = 'Total Vaccinations per Country')
fig = dict(data = data,layout = layout)
iplot(fig)
.png)
Daily Vaccinations per Countries:
fig = go.Choropleth(locations = new_df["country"],locationmode = 'country names',
                    z = new_df['daily_vaccinations'],
                    text= new_df['country'],colorbar = dict(title= "Daily Vaccinations"))
data = [fig]
layout = go.Layout(title = 'Daily Vaccinations per Countries')
fig = dict(data = data,layout = layout)
iplot(fig)
.png)
Relation between Total Vaccinations and Total Vaccinations per Hundred:
fig = px.scatter(new_df,x = 'total_vaccinations',y='total_vaccinations_per_hundred',
                 size='total_vaccinations',
                 hover_name = 'country',size_max = 50,
                 title="Total vs Total vaccinations per hundred grouped by Vaccines",
                color_discrete_sequence = px.colors.qualitative.Bold)
fig.show()
.png)
If you hover your cursor to the scatters you will also see the country names,number of total vaccinations and number of total vaccinations per hundred. By this we observe that:
- Although USA & China produce the highest number of vaccinations to their citizens, according to their population this is not much.
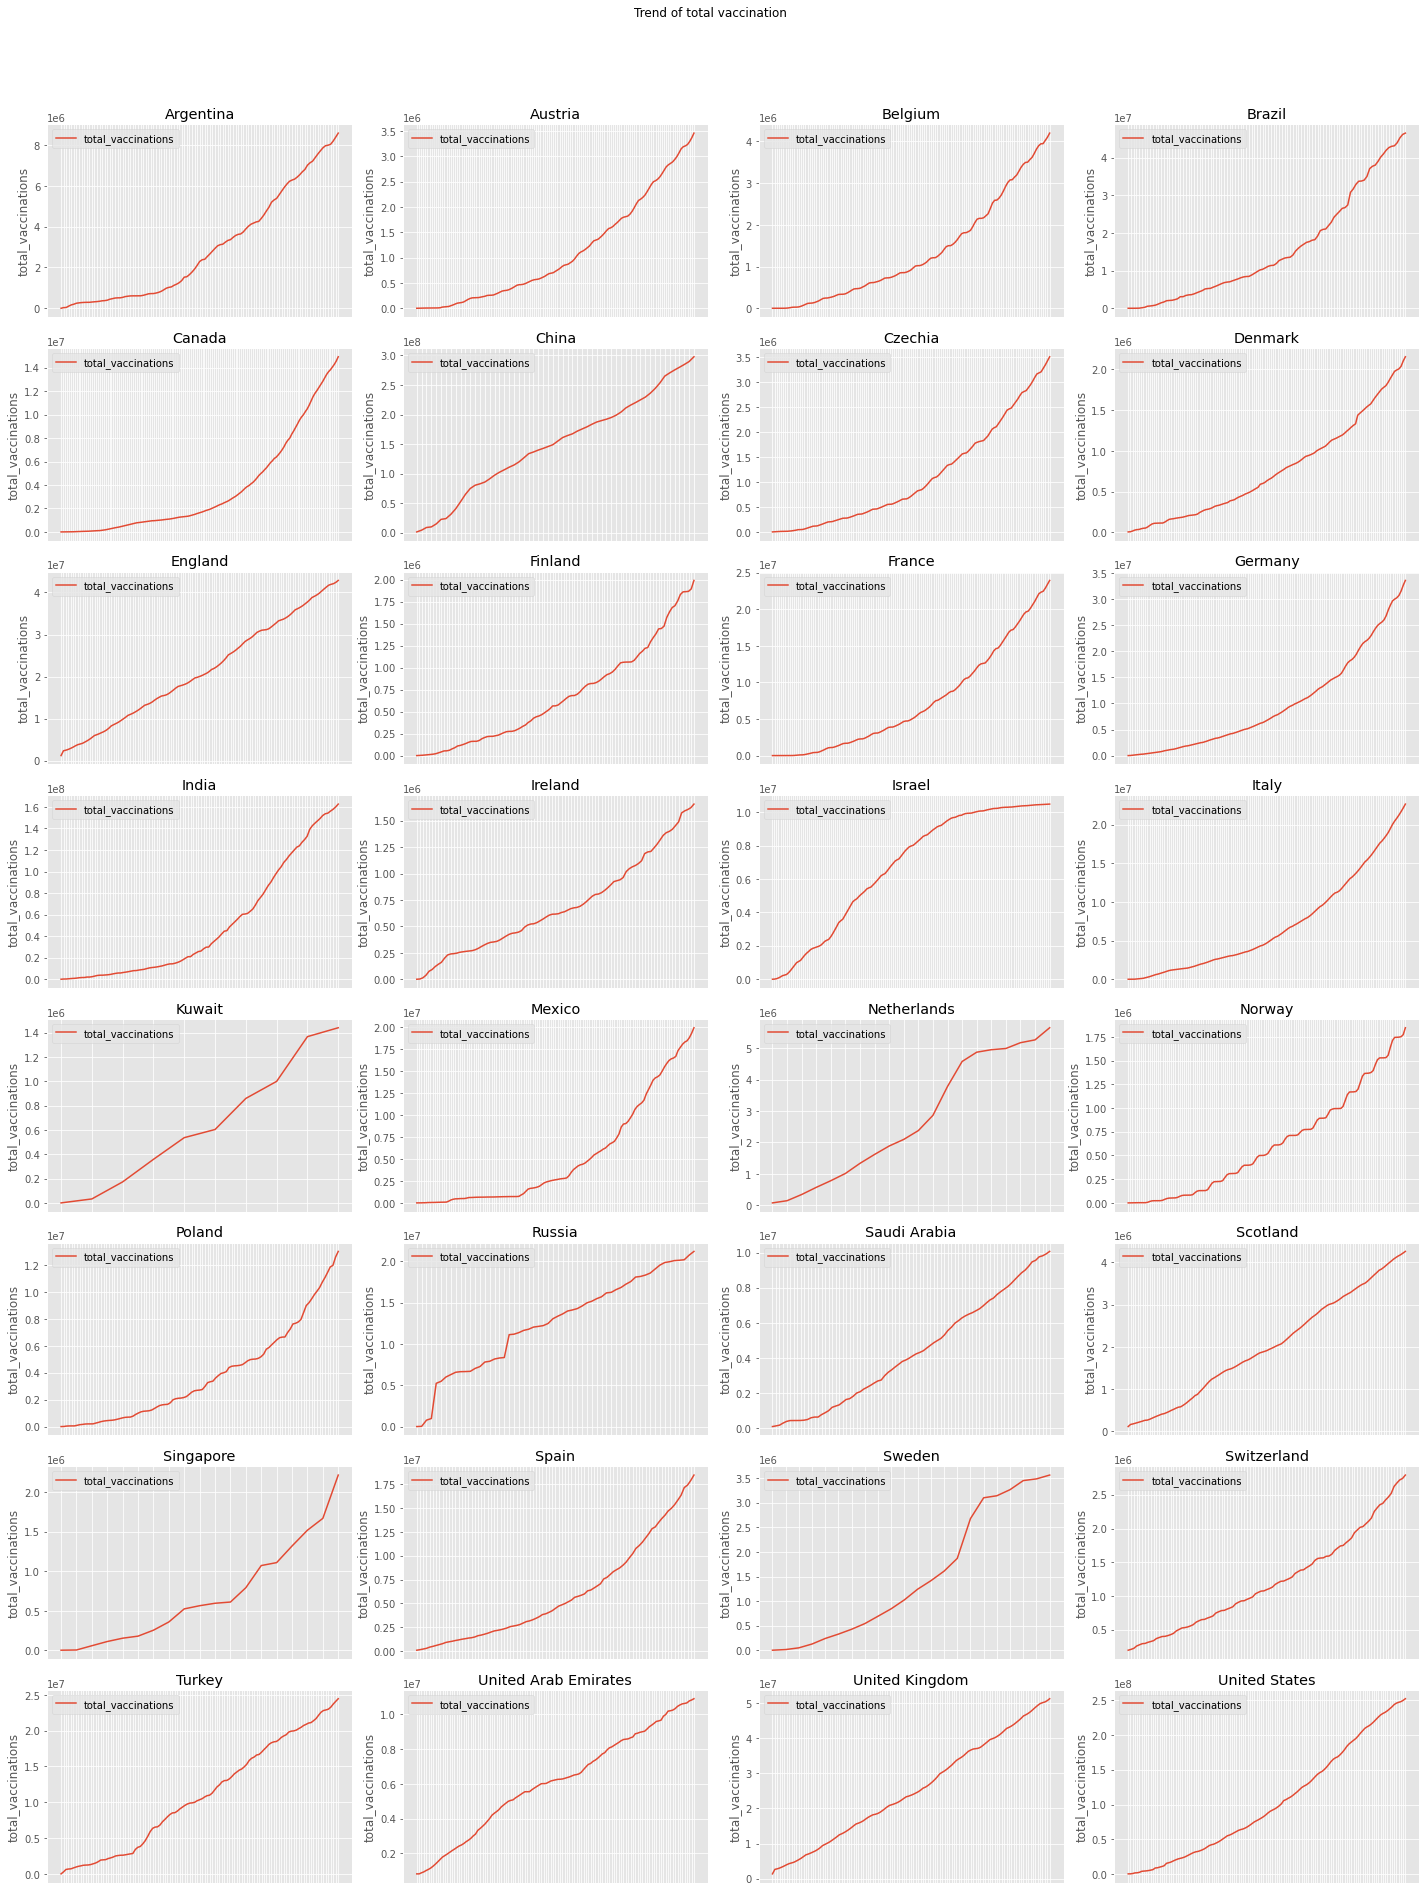
What is the trend of total vaccinations according to countries?
def plot_trend(dataframe,feature,title,country):
    plt.style.use('ggplot')
    plt.figure(figsize=(20,25))

    for i,country in enumerate(country):
        plt.subplot(8,4,<a onclick="parent.postMessage({'referent':'.kaggle.usercode.14440604.62732853.plot_trend..i'}, '*')">i+1)
        data = dataframe[dataframe['country'] == country]
        sns.lineplot(x=data['date'] ,y=data[feature],label = feature)
        plt.xlabel('')
        plt.tick_params(axis='x',which='both',top=False,bottom=False,labelbottom=False)
        plt.title(country)

    plt.suptitle(title,y=1.05)
    plt.tight_layout()
    plt.show()
country = ['Argentina', 'Austria', 'Belgium', 'Brazil','Canada','China','Czechia',
           'Denmark', 'England','Finland', 'France','Germany','India','Ireland',
           'Israel', 'Italy', 'Kuwait','Mexico', 'Netherlands','Norway', 'Poland',
           'Russia','Saudi Arabia', 'Scotland','Singapore','Spain', 'Sweden',
           'Switzerland', 'Turkey','United Arab Emirates', 'United Kingdom', 'United States']
plot_trend(df,'total_vaccinations','Trend of total vaccination',country)
End Notes:
You can collect the dataset from here and play with it. You may find a difference in the results because every day a lot of people getting infected by Covid19 and the data of covid19 is being changed every day.
At last, I wanna say that we all know that, we are in a very bad situation because of Covid19. All we have is each other so let’s help each other to the best we can & pray for our planet to get well soon.
The media shown in this article are not owned by Analytics Vidhya and is used at the Author’s discretion.


