This article was published as a part of the Data Science Blogathon.
In this blog post, we will learn how to pull data from Istanbul Metropolitan Municipality open data platform using its API, and also we will use Google’s distance matrix API to calculate distances between districts and create new data for our analysis.
Then, we will implement linear regression without using any package. The purpose is to get familiar with APIs, NumPy, and Pandas.
So if we are ready, let’s dive in!
In this project, we want to test if there is a relationship between the distance from the city center and the development of districts. In statistical words;
H0 hypothesis is “there is no relationship between distance from center and development of that district”
H1 hypothesis is “there is a relationship between distance from centre and development of that district”
Important notice before we dive into code; we made an assumption that the development of that districts can be identified by the family size. This is not one hundred percent true of course, however for this case we make this assumption.
Please don’t get stuck on the theoretical meanings, the purpose of this blog post is successfully extracting data and make data analysis on it. It is not about proving something truly.
All codes are presented in my GitHub, you can access them from there
The GitHub repository: https://github.com/tylerisback/Medium_data
1. Import necessary libraries for data analysis and API usage.
import urllib # need for api transportation

import json import pandas as pd import numpy as np from scipy.stats import t import scipy.stats as stats import matplotlib.pyplot as plt
2. Pull Data
Let’s pull data from Istanbul Municipality (ibb) open data platform with its API. You can find various open datasets from Istanbul Municipality.
Go to the link of the data below, and click the ‘Data API’ button.
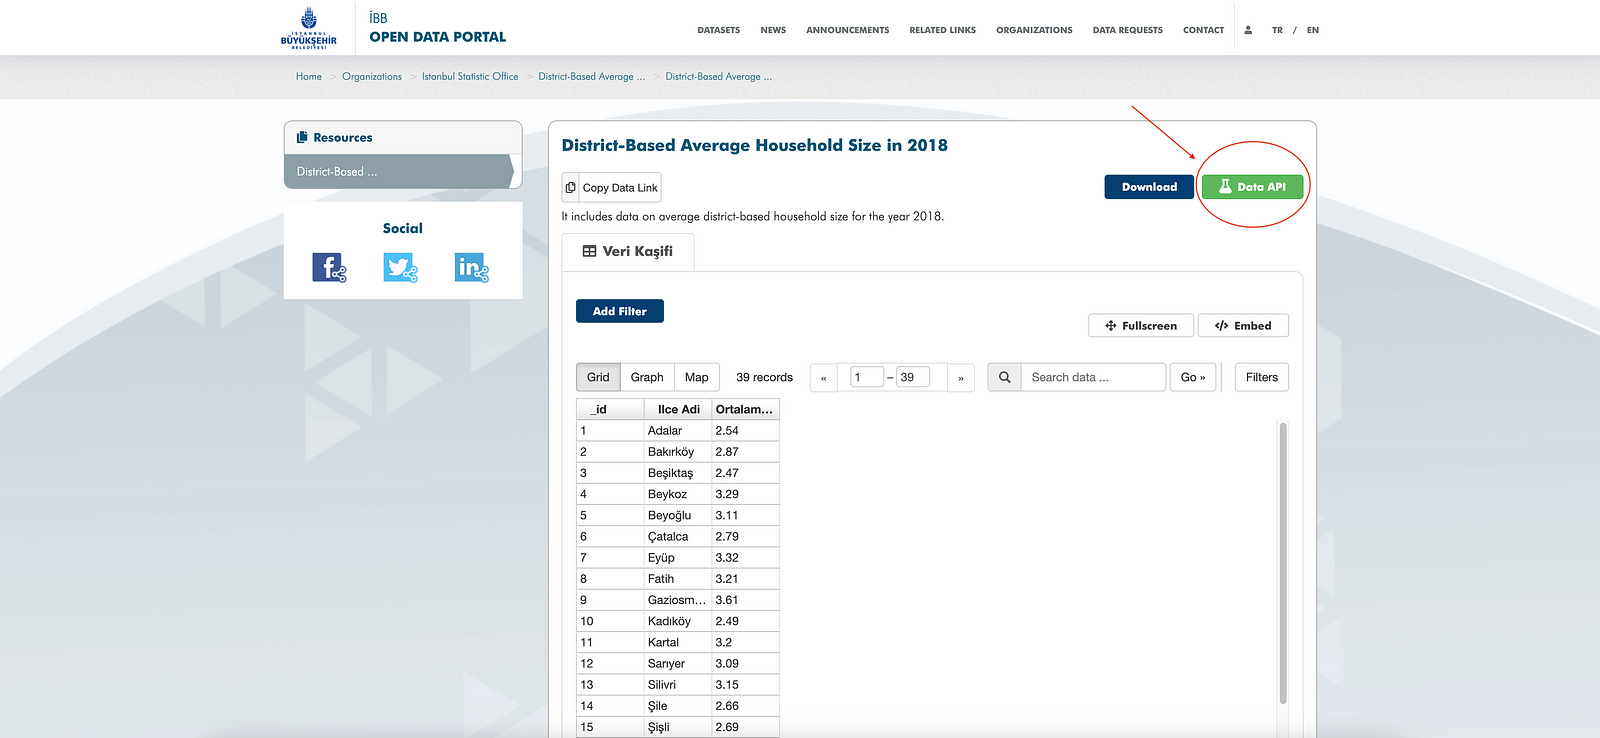
When we clicked the data API button, this window opens we will copy the link in the red rectangle below and paste it into our code.
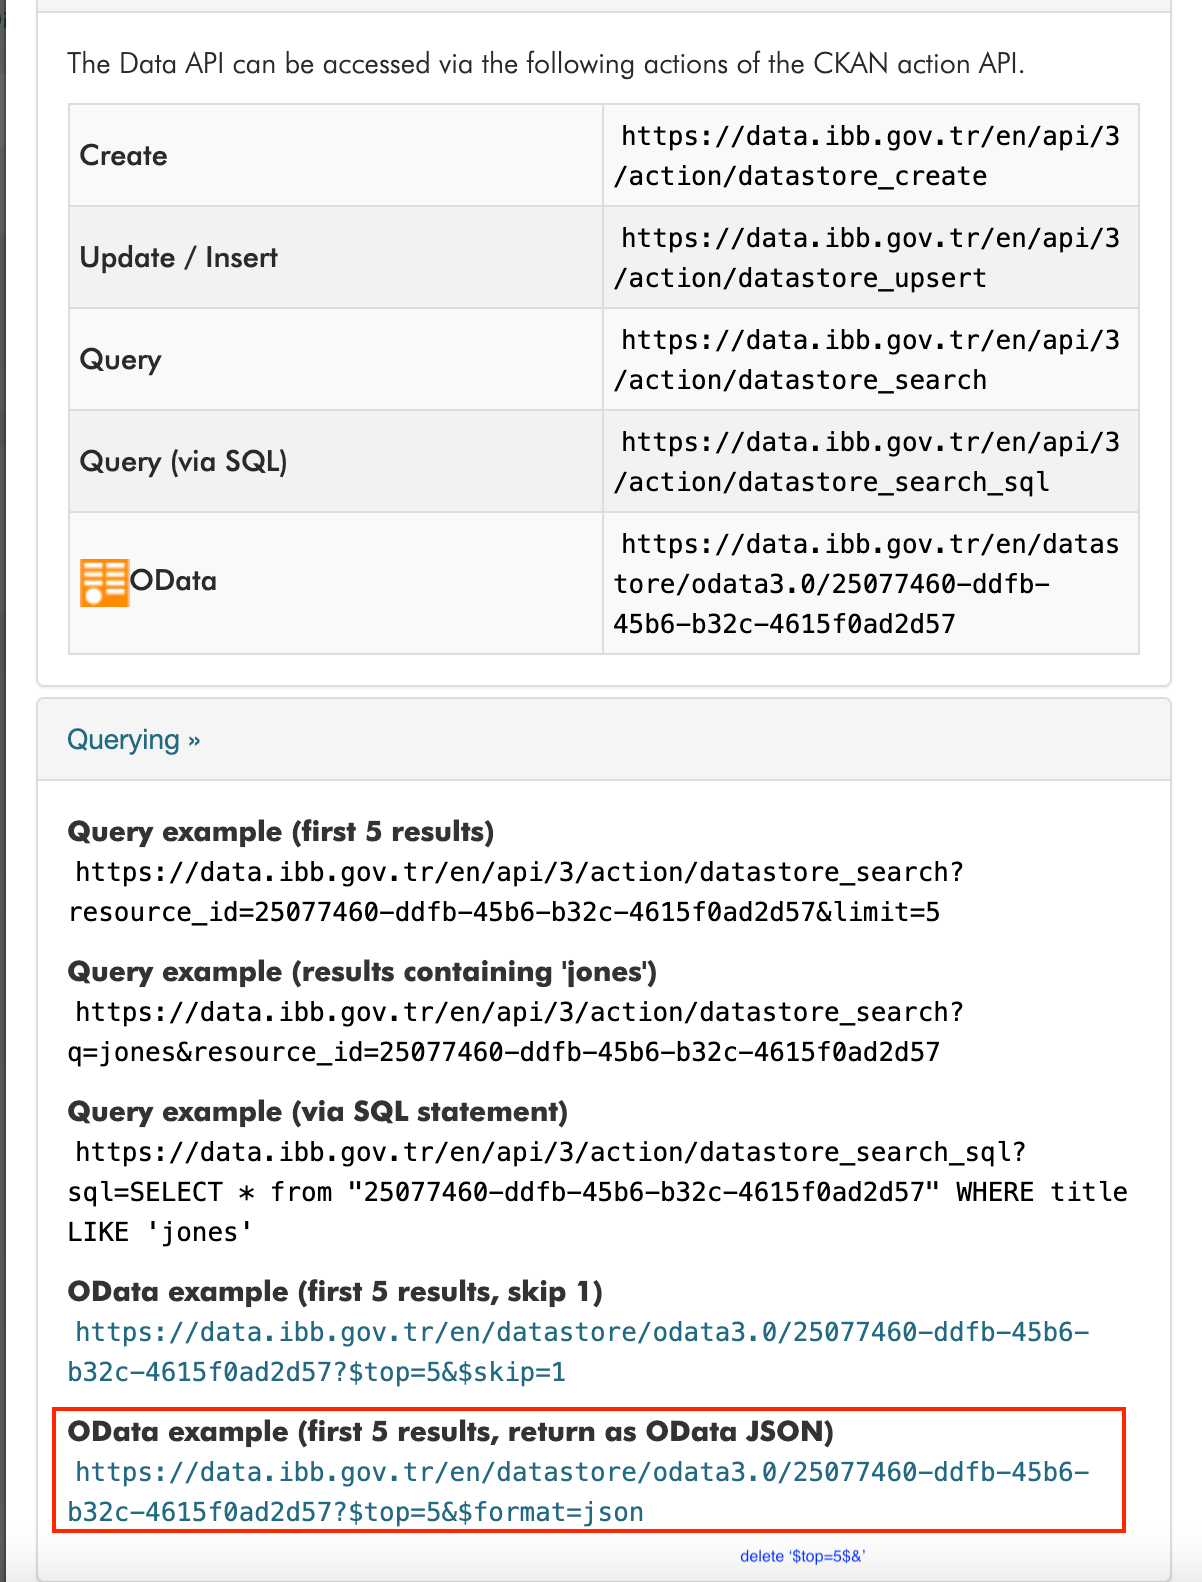
After that, we will delete ‘$top=5&’ to pull all the data, not just the top 5. You can see the code below to pull data from the website and change it to dataframe format using pandas.
url = ‘https://data.ibb.gov.tr/datastore/odata3.0/25077460-ddfb-45b6-b32c-4615f0ad2d57?$format=json' #URL of family size according to districts
def pulldataToDataframe(url):
 query = urllib.request.urlopen(url) # API connection
 data = json.loads(query.read().decode()) # Change to json type
 data = data.get(“value”) # Only getting data value
 return pd.DataFrame(data) # Change to dataframe
df = df.drop(columns=”_id”) # Removal of id column
df = pulldataToDataframe(url)
print(df.columns)
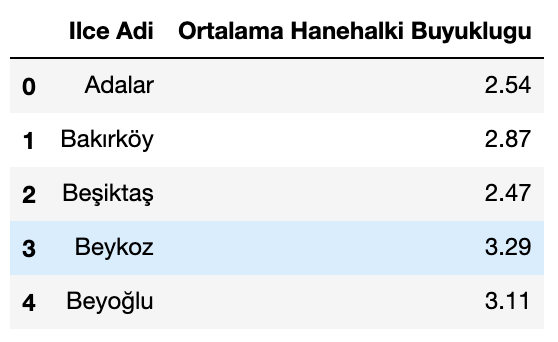
We pulled the data from and moved it to the dataframe. Let’s look at the top 5 data.
df.head() #Dataframe 1st column: Districts, 2nd column: family size according to districts
Istanbul has 2 parts; European and Asian. We will use Kadikoy for the center of the Asian part and Besiktas for the European part. We separated the districts for the Asian part (kadikoy_list) and the European part (besiktas_list)
kadikoy_list = [‘Kadıköy’, ‘Kartal’, ‘Şile’, ‘Üsküdar’, ‘Pendik’, ‘Ümraniye’, ‘Maltepe’, ‘Sultanbeyli’, ‘Tuzla’, ‘Ataşehir’, ‘Çekmeköy’, ‘Sancaktepe’, ‘Beykoz’]
besiktas_list = [‘Beşiktaş’, ‘Bakırköy’, ‘Beyoğlu’, ‘Çatalca’, ‘Eyüp’, ‘Fatih’, ‘Gaziosmanpaşa’, ‘Sarıyer’, ‘Silivri’, ‘Şişli’, ‘Zeytinburnu’, ‘Büyükçekmece’, ‘Kağıthane’, ‘Küçükçekmece’, ‘Bayrampaşa’, ‘Avcılar’, ‘Bağcılar’, ‘Arnuvutköy’, ‘Başakşehir’, ‘Beylikdüzü’, ‘Esenyurt’, ‘Sultangazi’, ‘Esenler’, ‘Güngören’, ‘Bahçelievler’]
kadikoy_dist = []
besiktas_dist = []
3. GOOGLE API
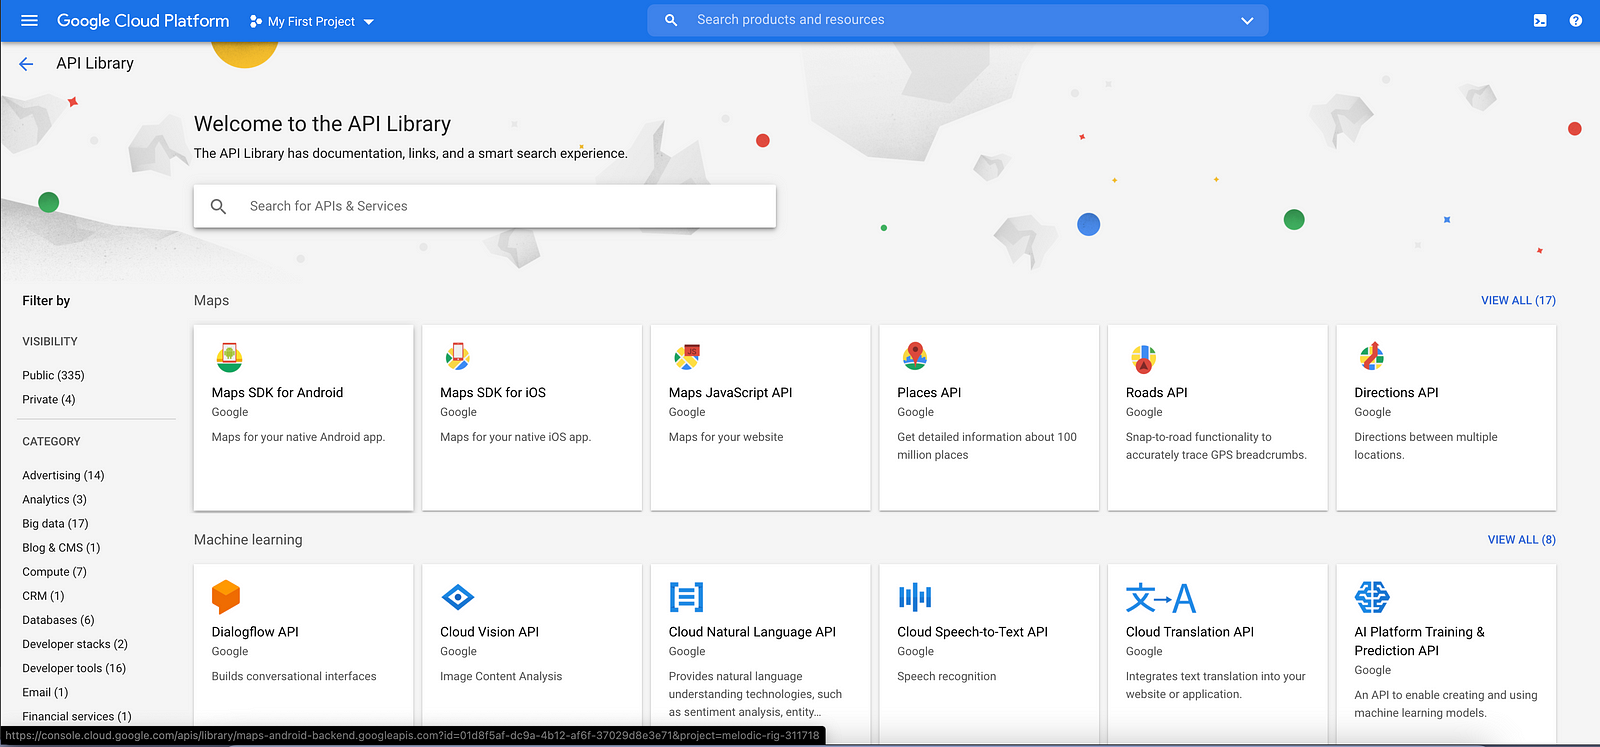
Okay, now let’s look at the Google API part. There are lots of APIs available for your use in the Google Cloud Platform. You can check them here: https://cloud.google.com/
You have to create your account and request an API key. It’s well explained here; https://developers.google.com/maps/documentation/javascript/get-api-key

I have downloaded the APIs below. However, as you can see I only use Distance Matrix API and Service Usage API. I recommend you to download Geocoding, Geolocation, Places, Directions, and Maps Javascript APIs as well. If you want to work with GoogleMaps data.
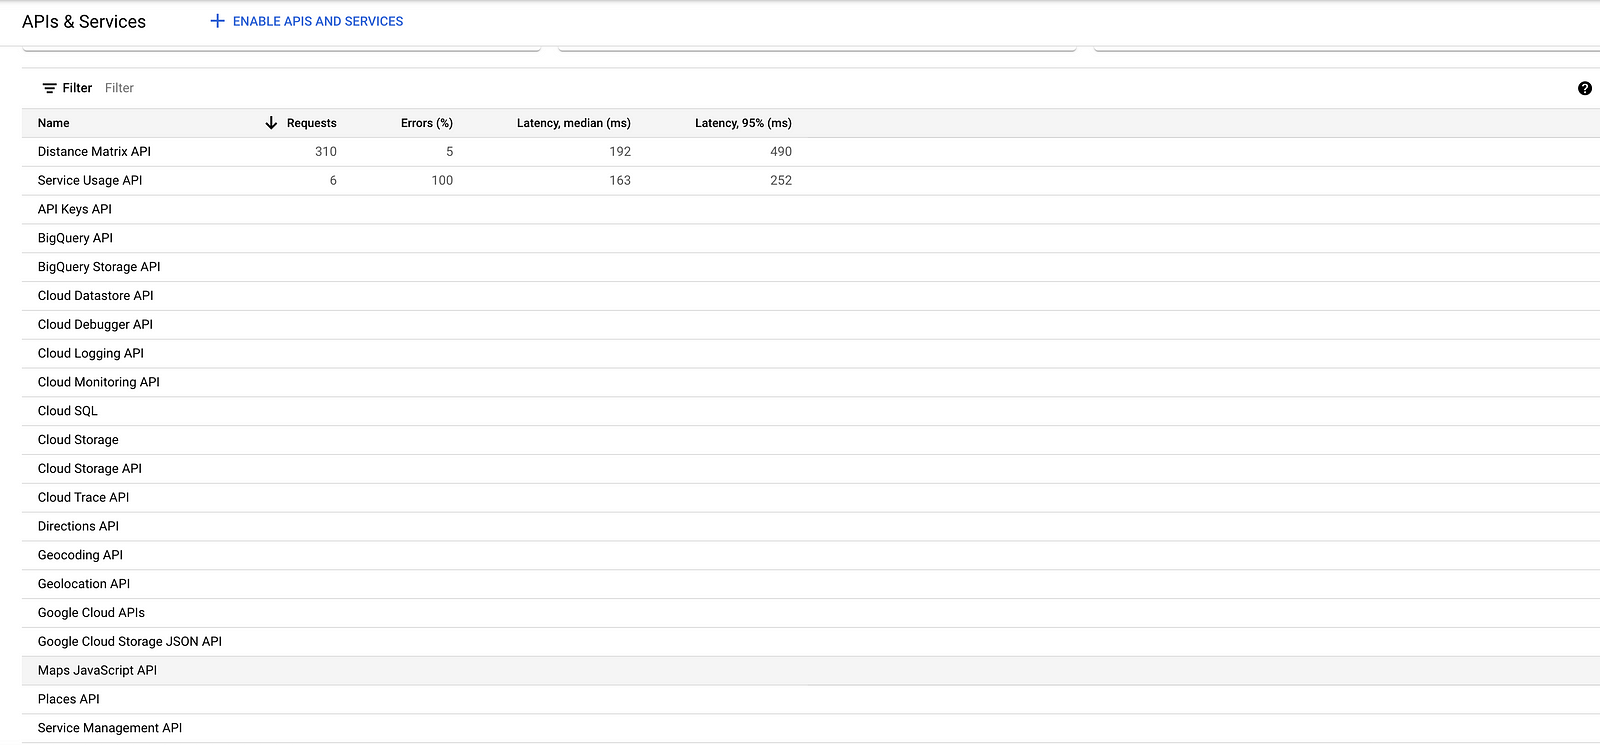
Now let’s look at the code how we use API. In the comments in the code below, I think it is well explained.
import requests, json
api_key =’QsatasdjıgwedSDFJW-A1lkjasdbUQ’ #You need to put your api key here

# url variable store url
url = ‘https://maps.googleapis.com/maps/api/distancematrix/json?'
#For every district in Asian part, we find its distance between
#(kadikoy) and append our list 'kadikoy_dist'.
for dest in kadikoy_list:
    source = ‘kadiköy’
    r = requests.get(url + ‘origins=’ + source +
    ‘&destinations=’ + dest +
    ‘&key=’ + api_key)
    kadikoy_dist.append(r.json()[‘rows’][0][‘elements’][0][‘distance’][‘value’])
#For every district in european part, we find its distance between
#(besiktas) and append our list 'besiktas_dist'.
for dest in besiktas_list:
    source = ‘besiktas’
    r = requests.get(url + ‘origins=’ + source +
    ‘&destinations=’ + dest +
    ‘&key=’ + api_key)
    besiktas_dist.append(r.json()[‘rows’][0][‘elements’][0][‘distance’][‘value’])
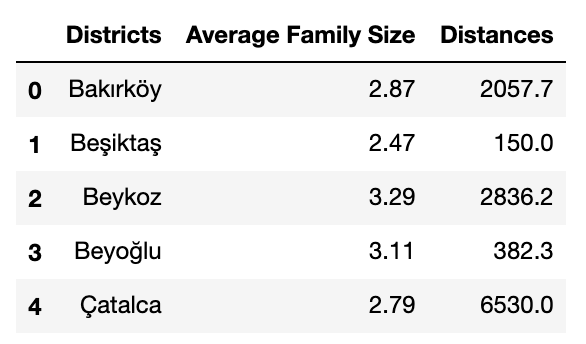
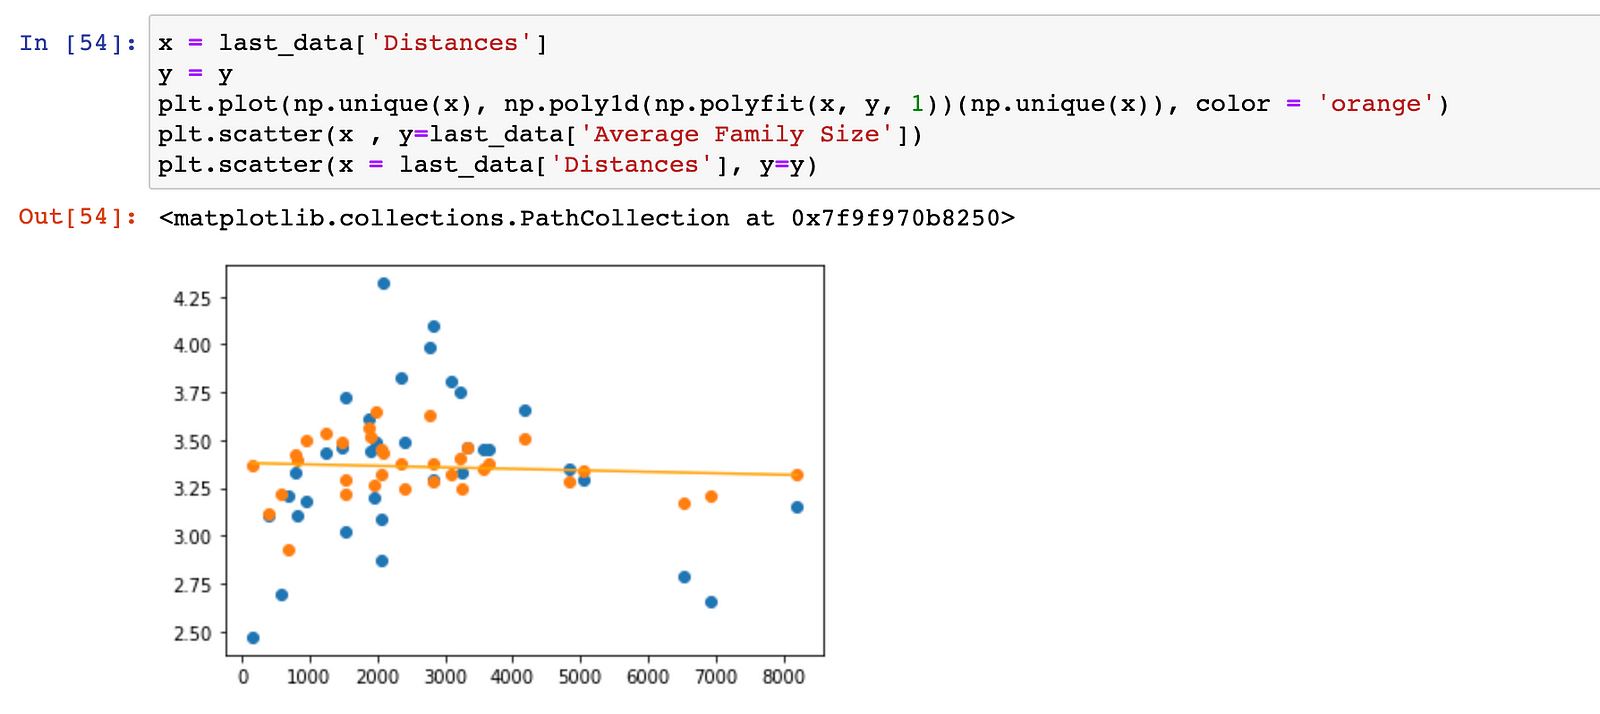
As you can see we have pulled data from Districts, Average Family Size with ibb data API, and we have generated a new feature with Google API distance matrix API and named as Distances column.
4. Linear Regression Analysis
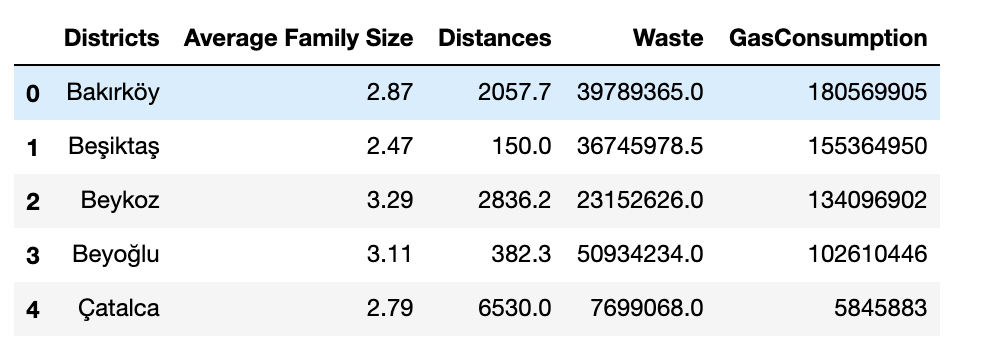
We have successfully created our data. I have also added 2 features as control variables to have more reliable tests. For this part, I will go rather more quickly on code, I will try to show results rather than code. But I encourage you to go over the code in my GitHub Repository.
The data after we have added two control variables: ‘Waste’ and ‘GasConsumption’.
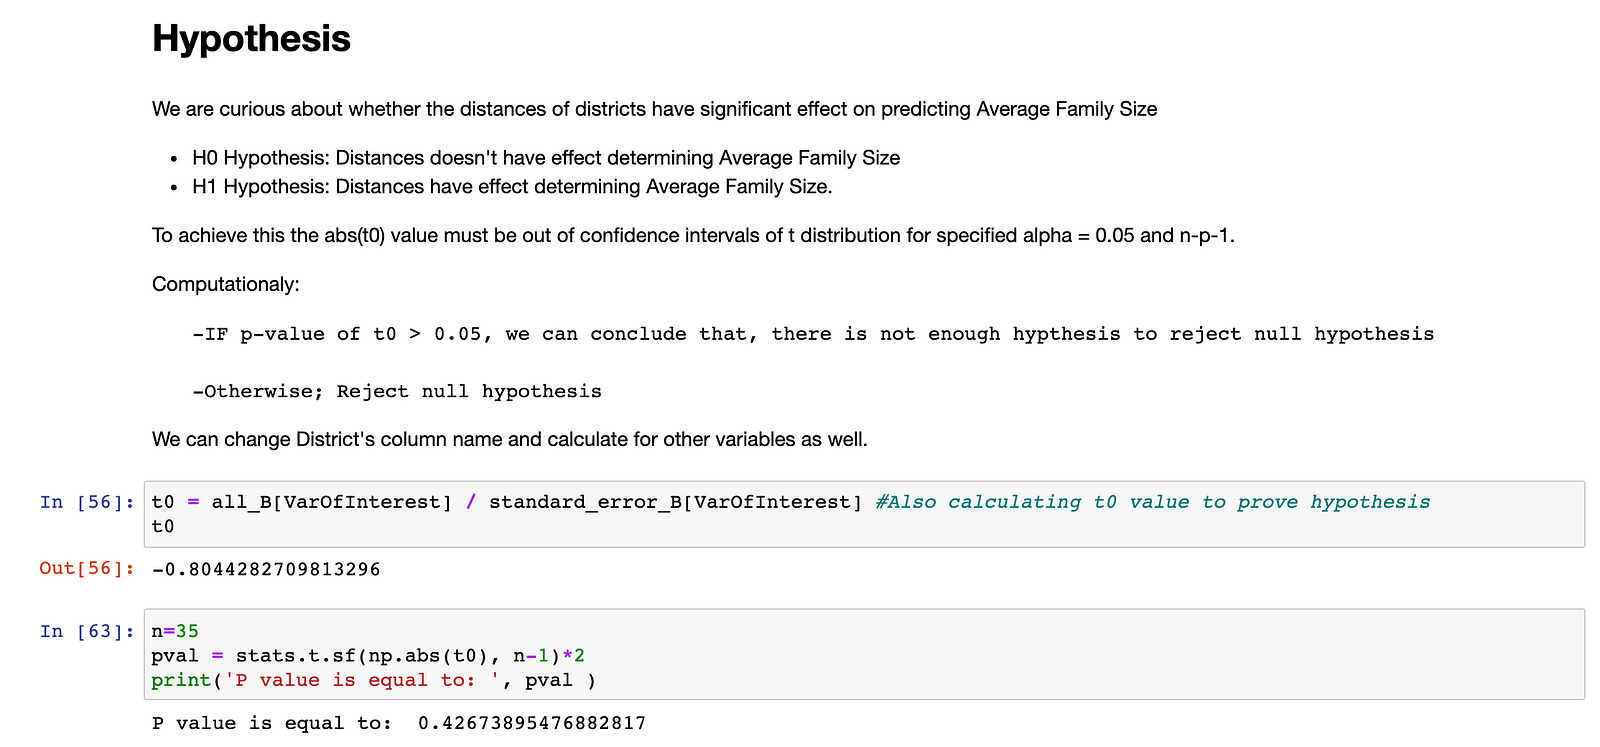
You can see our hypothesis below and our results. As we have a p-value higher than 0.05. We can conclude that there is not enough evidence to reject the null hypothesis.
Also, let’s look at the regression with our y and y_hat. Blue dots are representing the real y values. The orange ones are our y_hat values. As you can see regression line can not fit nicely, hence it shows that there is no linear relationship between distance and family size.
5. Conclusion
In this blog post, we showed how to pull data from Istanbul Municipality open data platform using API. Also, we generated a new feature by using Google Distance Matrix API.
In the second part, we conduct a very basic linear regression analysis to test if there is a relationship between family size and distances. We proved that there is not a relationship between them with p-value and linear regression line fit.
Hope you like it. If you have any questions please don’t hesitate to contact me via mail (present on my GitHub page)
The media shown in this article are not owned by Analytics Vidhya and is used at the Author’s discretion.


