Data Types in Statistics for Data Science
Introduction
In Data Science, we aim to do different experiments with raw data and finds some good insights from the data. To drive any business on the right path, data is very important or we can say that “Data is the fuel”. It can at least provide some actionable insights that can help to:
- Strategize current campaigns,
- Easily organize the launch of new products, or
- Try out different experiments.
This article was published as a part of the Data Science Blogathon
In all the above-mentioned things, the one common driving component is Numerical Data. We are entering into the digital era where we produce a lot of Data every day.
For Example, On a daily basis, a company like Flipkart produces more than 2-TB of data.
Due to so much importance of data in our life, it becomes very crucial to properly store and process this data without any error. While dealing with datasets, the data type or category of the data plays an important role to find the answer to the questions below:
- Which preprocessing strategy would work for a particular set to get the right results, or
- Which type of statistical analysis should be applied for the best results.
So, In this article, we will discuss the different data types in statistics you need to know to do proper Exploratory Data Analysis (EDA), which is one of the most important components in the pipeline of a Machine Learning Project.
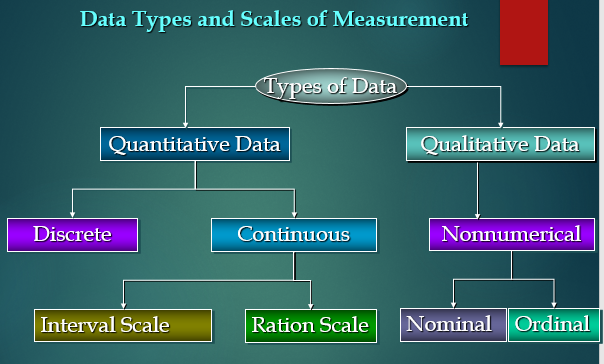
Table of contents
Data Types in Statistics
In Statistics, Data Types play a very crucial and important role, which needs to be understood, to apply statistical measurements correctly to your data so that we can correctly conclude certain assumptions about the data.
Similarly, we need to know which data analysis and its type you are working on to select the correct perception technique since different data types are considered as an approach to arrange various types of variables.
While doing Exploratory Data Analysis (EDA) in a general data science project, it becomes crucial to have a good understanding of the different data types since we can use certain statistical measurements only for specific data types.
It is also known as the Measurement Scale.
While dealing with any of the data types, we also need to know which visualization method fits the particular data type.
We can think of data types as a way to categorize different types of variables.
Quantitative vs Qualitative Data
Quantitative Data
1. These types of data seem to be the easiest to explain. It tries to find the answers to questions such as
- “how many,
- “how much” and
- “how often”
2. It can be expressed as a number, so it can be quantified. In simple words, it can be measured by numerical variables.
3. These are easily open for statistical manipulation and can be represented by a wide variety of statistical types of graphs and charts like line charts, bar graphs, scatter plots, etc.
Examples of quantitative data:
- Scores of tests and exams e.g. 74, 67, 98, etc.
- The weight of a person.
- The temperature in a room.
There are 2 general types of quantitative data:
- Discrete data
- Continuous data
Qualitative Data
1. Qualitative data can’t be expressed as a number, so it can’t be measured. It mainly consists of words, pictures, and symbols, but not numbers.
2. It is also known as Categorical Data as the information can be sorted by category, not by number.
3. These can answer the questions like:
- “how this has happened”, or
- “why this has happened”.
Examples of qualitative data:
- Colors e.g. the color of the sea
- Popular holiday destinations such as Switzerland, New Zealand, South Africa, etc.
- Ethnicity such as American Indian, Asian, etc.
In general, there are 2 types of qualitative data:
- Nominal data
- Ordinal data.
Nominal Data
1. This data type is used just for labeling variables, without having any quantitative value. Here, the term ‘nominal’ comes from the Latin word “nomen” which means ‘name’.
2. It just names a thing without applying for any particular order. The nominal data sometimes referred to as “labels”.
Examples of Nominal Data:
- Gender (Women, Men)
- Hair color (Blonde, Brown, Brunette, Red, etc.)
- Marital status (Married, Single, Widowed)
As you can observe from the examples there is no intrinsic ordering to the variables.
Eye color is a nominal variable having a few levels or categories such as Blue, Green, Brown, etc and there is no possible way to order these categories in a rank-wise manner i.e, from highest to lowest or vice-versa.
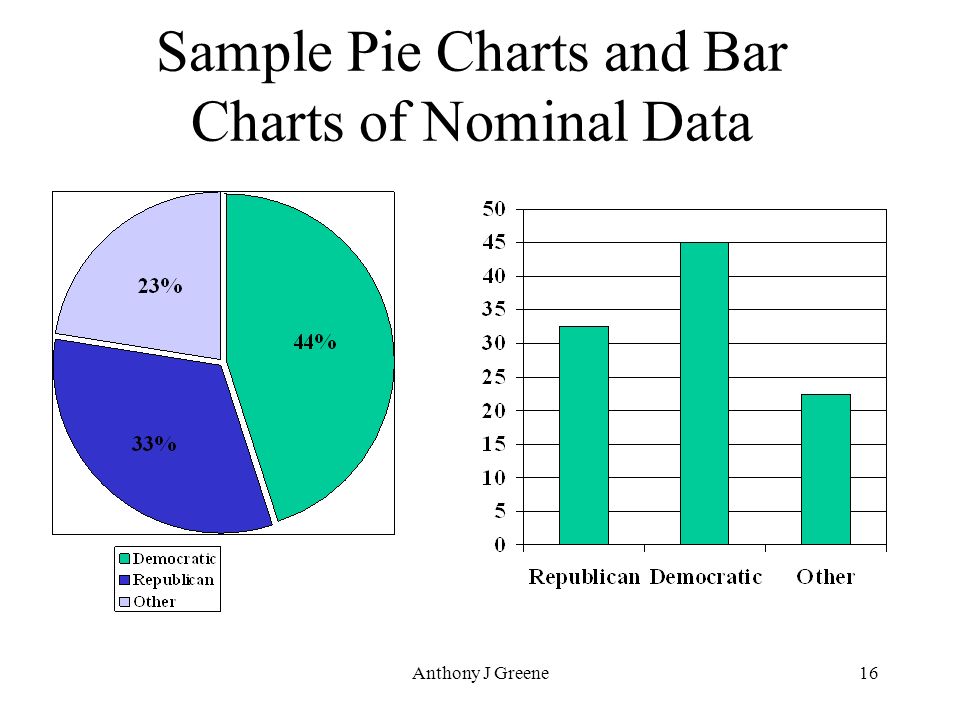
Image Source: Google Images
Ordinal Data
1. The crucial difference from nominal types of data is that Ordinal Data shows where a number is present in a particular order.
2. This type of data is placed into some kind of order by their position on a scale. Ordinal data may indicate superiority.
3. We cannot do arithmetic operations with ordinal data because they only show the sequence.
4. Ordinal variables are considered as “in-between” qualitative and quantitative variables.
5. In simple words, we can understand the ordinal data as qualitative data for which the values are ordered.
6. In comparison with nominal data, the second one is qualitative data for which the values cannot be placed in an order.
7. Based on the relative position, we can also assign numbers to ordinal data. But we cannot do math with those numbers. For example, “first, second, third…etc.”
Examples of Ordinal Data:
- Ranking of users in a competition: The first, second, and third, etc.
- Rating of a product taken by the company on a scale of 1-10.
- Economic status: low, medium, and high.
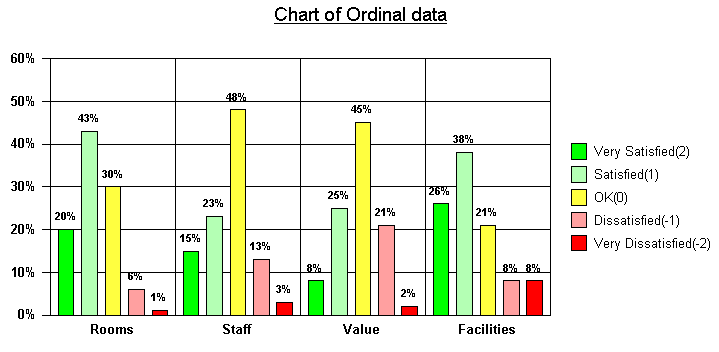
Image Source: Google Images
Quantitative Data
Discrete Data
1. It shows the count that involves only integers and we cannot subdivide the discrete values into parts.
For Example, the number of students in a class is an example of discrete data since we can count whole individuals but can’t count like 2.5, 3.75, kids.
2. In simple words, discrete data can take only certain values and the data variables cannot be divided into smaller parts.
3. It has a limited number of possible values e.g. days of the month.
Examples of discrete data:
- The number of students in a class.
- The number of workers in a company.
- The number of test questions you answered correctly.
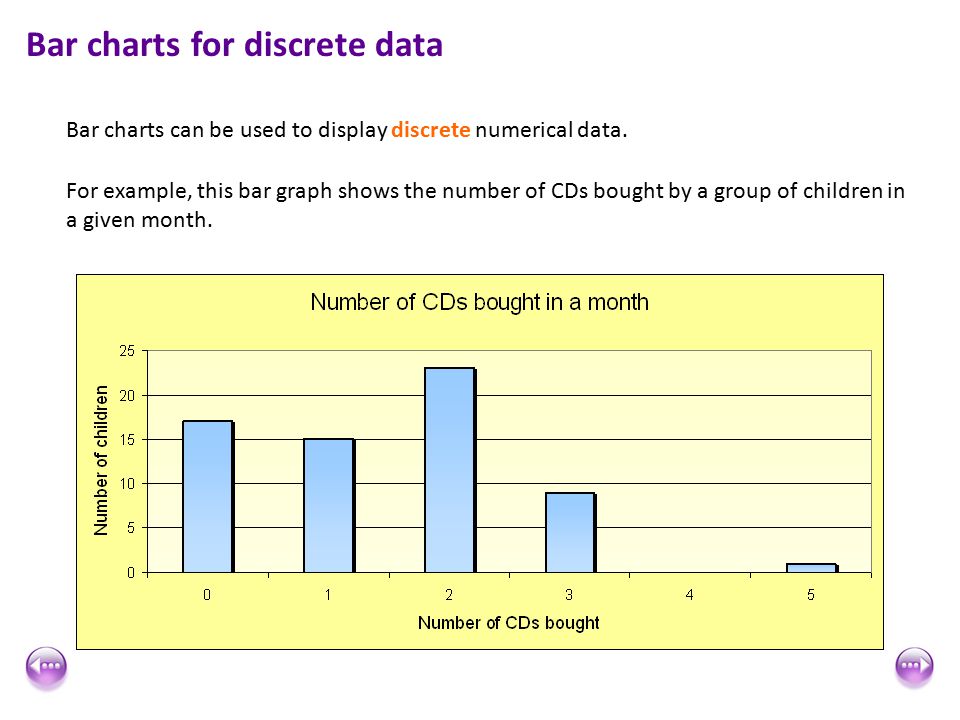
Image Source: Google Images
Continuous Data
1. It represents the information that could be meaningfully divided into its finer levels. It can be measured on a scale or continuum and can have almost any numeric value.
For Example, We can measure our height at very precise scales in different units such as meters, centimeters, millimeters, etc.
2. The key difference between continuous and discrete types of data is that in the former, we can record continuous data at so many different measurements such as width, temperature, time, etc.
3. The continuous variables can take any value between two numbers. For Example, between the range of 60 and 82 inches, there are millions of possible heights such as 62.04762 inches, 79.948376 inches, etc.
4. A good great rule for defining if data is continuous or discrete is that if the point of measurement can be reduced in half and still make sense, the data is continuous.
Examples of continuous data:
- The amount of time required to complete a project.
- The height of children.
- The speed of cars.
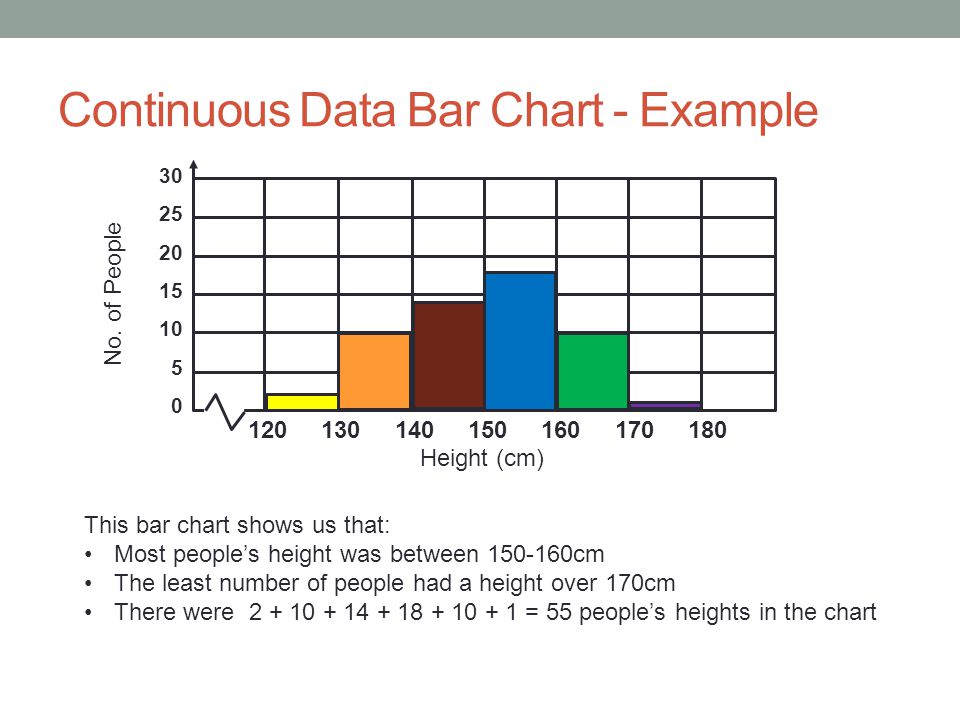 Image Source: Google Images
Interval Data
1. These data types are measurable and ordered with the nearest items but have no meaningful zero.
Let’s understand the meaning of “Interval Scale”:
In the Interval scale, the term ‘Interval’ signifies space in between, which is a significant thing to recall as interval scales not only educate us about the order but in addition, give information about the value between every item.
2. Fundamentally, we can show interval data in the same way as ratio data, but the thing that we have to note is their characterized zero points.
3. Hence, with the help of interval data, we can easily correlate the degrees of the data and also add or subtract the values.
4. There are some descriptive statistics that we can calculate for interval data such as :
- Central measures of tendency (mean, median, mode)
- Range (minimum, maximum)
- Spread (percentiles, interquartile range, and standard deviation).
These are not the only statistical things to be calculated, but we can calculate more things also.
Examples of Interval data:
- Temperature (°C or F, but not Kelvin)
- Dates (1055, 1297, 1976, etc.)
- Time Gap on a 12-hour clock (6 am, 6 pm)
Ratio Data
1. These data are also in the ordered units that have the same difference.
2. Ratio values are the same as interval values, but the only difference is that Ratio data do have an absolute zero. For Example, height, weight, length, etc.
3. These are measured and ordered with equidistant items with a meaningful zero and never be negative like interval data.
Let’s understand this with an outstanding example- Measurement of heights.
Height can be measured in units like centimeters, inches, meters, or feet and it is not possible to have a negative value of height.
4. It enlightens us regarding the order for variables, the contrasts among them, and they have absolutely zero.
5. Ratio data is fundamentally the same as interval data, aside from zero means none.
6. The descriptive statistics which we can calculate for ratio data are the same as interval data such as :
- Central measures of tendency (mean, median, mode)
- Range (minimum, maximum)
- Spread (percentiles, interquartile range, and standard deviation).
Example of Ratio data:
- Age (from 0 years to 100+)
- Temperature (in Kelvin, but not °C or F)
- Time interval (measured with a stop-watch or similar)
For the above examples of ratio data, we see that there is an actual and meaningful zero-point like the age of a person, absolute zero, distance calculated from a specified point or time all have real zeros.
NOTE:
If we picked the zero-point of the scale subjectively, then at that point the data can’t be ratio data and should be interval data.
What makes data types significant?
Data types are like the different languages computers speak. Just as humans have different languages to communicate, computers use data types to understand and process different kinds of information.
Imagine you’re talking to a friend who only speaks Spanish. If you want them to understand you, you need to speak Spanish, too. Similarly, if you want a computer to understand your data, you need to provide it in the right data type.
For example, if you tell a computer that your age is 25, but you provide it as a text string instead of a number, the computer might not understand what you mean. It might think you’re saying “twenty-five” as a word, not as a number.
That’s why data types are so important. They make sure that computers understand the information we give them, just like languages help us understand each other.
Qualitative or Categorical Data
Qualitative or categorical data refers to information that describes qualities or characteristics rather than quantities or numerical values. This type of data is non-numeric and can be divided into different categories or groups based on similar attributes. Examples include gender, marital status, hair color, and types of fruits. This data is often represented using labels or words rather than numbers. When analyzing qualitative data, it’s crucial to employ methods tailored to its nature, unlike the statistical data often associated with numerical value, raw or structured data.
Endnotes
Understanding data types in statistics is fundamental for effective analysis. Distinguishing between quantitative and qualitative data, and further categorizing them into nominal, ordinal, discrete, continuous, interval, and ratio types, facilitates precise interpretation and decision-making. The significance lies in accurately representing and analyzing real-world phenomena across diverse fields. Incorporating statistical methods into programming languages enhances the ability to manipulate and analyze data, ensuring robust analysis and informed decision-making.
Thanks for reading!
I hope you enjoyed the article and increased your knowledge about Data Types in Statistics.
Please feel free to contact me on Email
Something not mentioned or want to share your thoughts? Feel free to comment below And I’ll get back to you.
For the remaining articles, refer to the link.
FAQs
Nominal data is categorical data with no inherent order or ranking. Examples include hair color, gender, and religious affiliation.
Ordinal data is categorical data that can be ranked or ordered, but the intervals between the values are not necessarily equal. Examples include shoe size, level of education, and customer satisfaction rating.
Interval data can be ranked or ordered, and the intervals between the values are equal, but there is no true zero point. Examples include temperature, IQ scores, and standardized test scores.
Ratio data can be ranked or ordered, the intervals between the values are equal, and there is a true zero point. Examples include height, weight, and time.
The type of statistical methods you can use will depend on the type of data you are working with. For example, you can calculate the mean, median, and standard deviation of ordinal, interval, and ratio data, but you cannot calculate these measures for nominal data.
Data types are important in statistics because they ensure accurate analysis, enable appropriate data processing, facilitate comparisons, promote reproducibility, and enhance communication.
The media shown in this article on Data Types in Statistics are not owned by Analytics Vidhya and are used at the Author’s discretion.


