Latest Guide on Confusion Matrix for Multi-Class Classification
Every data science researcher must possess knowledge of data analytics, exploratory data analysis, machine learning, and deep learning. They must also know how to use multiclass classification to determine the performance of a machine learning algorithm. This classification is represented in a matrix form known as the confusion matrix. In this tutorial, you will learn all about confusion matrices – what they are, where to use them, and how to implement them.
Learning Objectives
- Understand what a confusion matrix is and what it looks like.
- Learn how to implement a confusion matrix in python using scikit-learn.
- Also, learn plenty of ways to gauge the model performance of a classification model.
This article was published as a part of the Data Science Blogathon
Table of contents
- What Is a Confusion Matrix?
- How to Create a 2X2 Confusion Matrix?
- Confusion Matrix for Binary Classification Example
- Confusion Matrix Using Scikit-learn in Python
- Confusion Matrix for Multi-Class Classification
- Confusion Matrix for a 3-Class Classification
- How to Calculate FN, FP, TN, and TP Values?
- What Are Precision and Recall?
- What Is F1-Score?
- Conclusion
- Frequently Asked Questions
What Is a Confusion Matrix?
- The confusion Matrix gives a comparison between actual and predicted values.
- It is used for the optimization of machine learning models.
- The confusion matrix is a N x N matrix, where N is the number of classes or outputs.
- For 2 classes, we get a 2 x 2 confusion matrix.
- For 3 classes, we get a 3 X 3 confusion matrix.
How to Create a 2X2 Confusion Matrix?
Below is the representation of the confusion matrix:

There are 4 terms you must understand in order to correctly interpret or read a Confusion Matrix:
- True Positive(TP)
- False Positive(FP)
- True Negative(TN)
- False Negative(FN)
Confusion Matrix for Binary Classification Example
Let us understand the confusion matrix for a simple binary classification example.
Binary classification has 2 outputs. The inputs for this classification will fall in either of the 2 outputs or classes.
Example: Based on certain inputs, we have to decide whether the person is sick or not, diabetic or not.
Let us see how to construct a confusion matrix and understand its terminologies. Consider we have to model a classifier that classifies 2 kinds of fruits. We have 2 types of fruits – apples and grapes – and we want our machine-learning model to identify or classify the given fruit as an apple or grape.
So we take 15 samples of 2 fruits, out of which 8 belong to Apples, and 7 belong to the Grapes class. Class is nothing but the output, in this example, we have 2 output classes – Apples and Grapes. We will represent Apple as 1 and Grape as 0 class.
The actual class for 8 apples and 7 grapes can be represented as:
Actual = [1,1,1,1,1,1,1,1,0,0,0,0,0,0,0]
The classifier model predicts 1 for Apple and 0 for grape.
Assume that the classifier takes all 15 inputs and makes the following predictions:
- Out of 8 apples, it will classify 5 correctly as apples and wrongly predict 3 as grapes.
- Out of 7 grapes, it will classify 5 correctly as grapes and wrongly predicts 2 as apples
The prediction of the classifier may be as follows:
Prediction = [1,0,0,0,1,1,1,1,0,0,0,0,0,1,1]
Visualized Confusion Matrix Example

For our example, the positive value is Apple, and the negative value is Grapes.
- True Positive: It means the actual value and also the predicted values are the same. In our case, the actual value is also an apple, and the model prediction is also an apple. If you observe the TP cell, the positive value is the same for Actual and predicted.
- False Negative: This means the actual value is positive. In our case, it is apple, but the model has predicted it as negative, i.e., grapes. So the model has given the wrong prediction. It was supposed to give a positive (apple), but it has given a negative (grape). So whatever the negative output we got is false; hence the name False Negative.
- False Positive: This means the actual value is negative. In our case, it is grapes, but the model has predicted it as positive, i.e., apple. So the model has given the wrong prediction. It was supposed to give a negative (grape), but it has given a positive (apple), so whatever the positive output we got is false, hence the name False Positive.
- True Negative: It means the actual value and also the predicted values are the same. In our case, the actual values are grapes, and the prediction is also Grapes. The values for the above example are: TP=5, FN=3, FP=2, TN=5.
Confusion Matrix Using Scikit-learn in Python
You know the theory – now let’s put it into practice. Let’s code a confusion matrix with the Scikit-learn (sklearn) library in Python.
Sklearn has two great functions: confusion_matrix() and classification_report().
- Sklearn confusion_matrix() returns the values of the Confusion matrix. The output is, however, slightly different from what we have studied so far. It takes the rows as Actual values and the columns as Predicted values. The rest of the concept remains the same.
- Sklearn classification_report() outputs precision, recall, and f1-score for each target class. In addition to this, it also has some extra values: micro avg, macro avg, and weighted avg
Mirco average is the precision/recall/f1-score calculated for all the classes.
Macro average is the average of precision/recall/f1-score.
Weighted average is just the weighted average of precision/recall/f1-score.
Confusion Matrix for Multi-Class Classification
The above example is a binary classification model with only 2 outputs, so we got a 2 X 2 matrix.
Now, what if the outputs are greater than 2 classes, i.e., Multi-class classification?
How to calculate TP, FN, FP, and TN?
Confusion Matrix for a 3-Class Classification
Let’s try to understand the confusion matrix for 3 classes and the confusion matrix for multiple classes with a popular dataset – the IRIS DATASET.
The dataset has 3 flowers as outputs or classes, Versicolor, Virginia, and Setosa.

With the help of petal length, petal width, sepal length, and sepal width, the model has to classify the given instance as Versicolor or Virginia, or Setosa flower.
Let’s apply a classifier model here. We can use logistic regression, but a decision tree classifier is applied to the above dataset. The dataset has 3 classes; hence we get a 3 X 3 confusion matrix.
But how to know the TP, TN, FP, and FN values?
In the multi-class classification problem, we won’t get TP, TN, FP, and FN values directly as in the binary classification problem. For validation, we need to calculate for each class.
#importing packages
import pandas as pd
import numpy as np
import seaborn as sns
import matplotlib.pyplot as plt
#Importing of dataset to dataframe.
df = pd.read_csv("../input/iris-flower-dataset/IRIS.csv")
#To see first 5 rows of the dataset
df.head()
#To know the data types of the variables.
df.dtypes#Speceis is the output class,to know the count of each class we use value_counts()
df['Species'].value_counts()#Separating independant variable and dependent variable("Species")
X = df.drop(['Species'], axis=1)
y = df['Species']
# print(X.head())
print(X.shape)
# print(y.head())
print(y.shape)# Splitting the dataset to Train and test
from sklearn.model_selection import train_test_split
X_train, X_test, y_train, y_test = train_test_split(X, y, test_size=0.3, random_state=0)#to know the shape of the train and test dataset.
print(X_train.shape)
print(y_train.shape)
print(X_test.shape)
print(y_test.shape)#We use Support Vector classifier as a classifier
from sklearn.svm import SVC
from sklearn.metrics import confusion_matrix#training the classifier using X_Train and y_train
clf = SVC(kernel = 'linear').fit(X_train,y_train)
clf.predict(X_train)#Testing the model using X_test and storing the output in y_pred
y_pred = clf.predict(X_test)# Creating a confusion matrix,which compares the y_test and y_pred
cm = confusion_matrix(y_test, y_pred)# Creating a dataframe for a array-formatted Confusion matrix,so it will be easy for plotting.
cm_df = pd.DataFrame(cm,
index = ['SETOSA','VERSICOLR','VIRGINICA'],
columns = ['SETOSA','VERSICOLR','VIRGINICA'])#Plotting the confusion matrix
plt.figure(figsize=(5,4))
sns.heatmap(cm_df, annot=True)
plt.title('Confusion Matrix')
plt.ylabel('Actal Values')
plt.xlabel('Predicted Values')
plt.show()
How to Calculate FN, FP, TN, and TP Values?
As discussed earlier, FN: The False-negative value for a class will be the sum of values of corresponding rows except for the TP value. FP: The False-positive value for a class will be the sum of values of the corresponding column except for the TP value. TN: The True-negative value for a class will be the sum of the values of all columns and rows except the values of that class that we are calculating the values for. And TP: the True-positive value is where the actual value and predicted value are the same.
The confusion matrix for the IRIS dataset is as below:

Let us calculate the TP, TN, FP, and FN values for the class Setosa using the Above tricks:
TP: The actual value and predicted value should be the same. So concerning Setosa class, the value of cell 1 is the TP value.
FN: The sum of values of corresponding rows except for the TP value
FN = (cell 2 + cell3)
= (0 + 0)
= 0
FP: The sum of values of the corresponding column except for the TP value.
FP = (cell 4 + cell 7)
= (0 + 0)
= 0
TN: The sum of values of all columns and rows except the values of that class that we are calculating the values for.
TN = (cell 5 + cell 6 + cell 8 + cell 9)
= 17 + 1 +0 + 11
= 29
Similarly, for the Versicolor class, the values/metrics are calculated as below:
TP: 17 (cell 5)
FN : 0 + 1 = 1 (cell 4 +cell 6)
FP : 0 + 0 = 0 (cell 2 + cell 8)
TN : 16 +0 +0 + 11 =27 (cell 1 + cell 3 + cell 7 + cell 9).
You can try for the Virginia class.
Why Use Confusion Matrix?
The confusion Matrix allows us to measure Recall and Precision, which, along with Accuracy and the AUC-ROC curve, are the metrics used to measure the performance of ML models.
What Are Precision and Recall?
In pattern recognition, object detection, and classification task(ML), precision and recall are performance metrics that use to retrieve data from training data.
Precision (positive predicted) is the fraction of relevant data among the retrieved data. On the other hand, recall (sensitivity) is the fraction of relevant data that were retrieved. Both precision and recall are based on relevance.
What Is F1-Score?
In practice, when we try to increase the precision of our model, the recall goes down, and vice-versa. The F1-score captures both the trends in a single value:
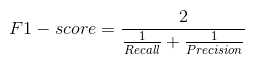
F1-score is a harmonic mean of Precision and Recall, and so it gives a combined idea about these two metrics. It is maximum when Precision is equal to Recall.
But there is a catch here. The interpretability of the F1-score is poor. This means that we don’t know what our classifier is maximizing – precision or recall. So, we use it in combination with other evaluation metrics which gives us a complete picture of the result.
The F1 score is the weighted average of precision and recall. In both precision and recall, there is false positive and false negative, so it also considers both. F1 score is more useful than accuracy, especially when you have an uneven class distribution.
Conclusion
The confusion matrix is a powerful tool for assessing the performance of classification algorithms in machine learning. Providing a comprehensive comparison between actual and predicted values enables us to evaluate our models’ accuracy, precision, recall, and other performance metrics. With this knowledge, we can make informed decisions and fine-tune our algorithms for optimal results.
If you’re passionate about advancing your machine learning and data science skills, consider joining our Blackbelt program. This flagship program offers a deep dive into various advanced topics, including classification algorithms, model evaluation, etc. Gain hands-on experience, learn from industry experts, and unlock the full potential of your data science journey.
Frequently Asked Questions
A. Yes, a confusion matrix can be used for multiclass classification for 3-class classification ML models.
A. There are 2 ways to calculate accuracy from the confusion matrix for multiclass.
1. Macro averaged precision: calculate precision for all the classes individually & then average them.
2. Micro averaged precision: calculate class-wise true positive and false positive & then use that to calculate overall precision.
A. Precision tells us how good the model is at predicting a specific class. Recall tells you how many times the model was able to detect a specific class.
The media shown in this article are not owned by Analytics Vidhya and are used at the Author’s discretion.


How to count the accuracy of confusion matrix as a whole, I mean is, if we calculated each class, the result would be better, because the formula (TP+TN)/ALL If it using whole dataset the accuracy will goes down because the TN is not exist, do you have any solutions? Thanks in advance