This article was published as a part of the Data Science Blogathon
1. INTRODUCTION
Data visualization is one of the important aspects of Data Science Projects. Before applying any machine learning model, it is always beneficial to perform Exploratory Data Analysis on the available dataset which can help dig deeper into the problem in consideration. There are various tools that are available to perform the analysis on the data like Tableau, Excel, etc.
Power BI is the analytics service provided by Microsoft which aims to help the users to provide interactive visualizations. The best part of Power-BI is its ease of use and the UI is simple enough that users can create their own dashboards or reports. It supports various features which include running python script or R script etc.
In this article, we will focus on embedding the report in the Jupyter notebook using powerbiclient provided by Microsoft.
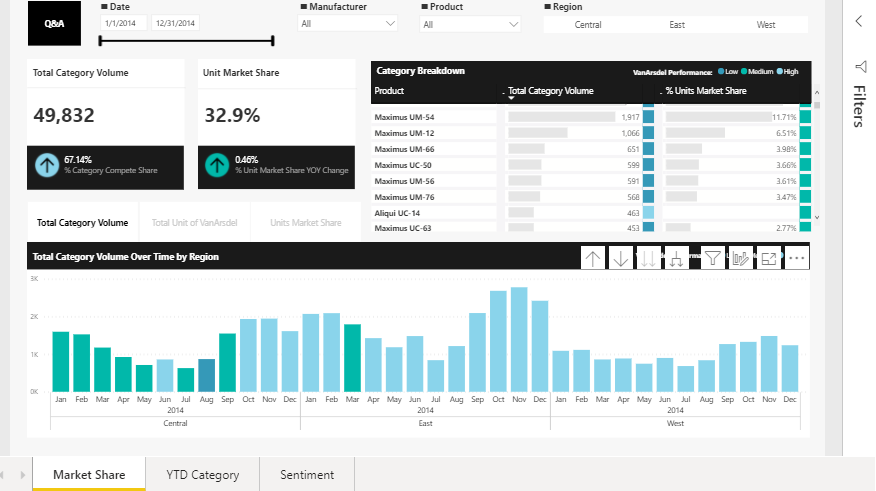
Below is the sample Power BI report which is publicly accessible and is provided by Microsoft for demos. We will be using this report for trying out different scenarios in this article.
In this article, we will explore how we can integrate any Power BI report with Jupyter notebook using python. LET’s GO!
2. Embed the report in the notebook
2.A. Install PowerBI Client
Let’s first install the library which will be used to integrate the report into the notebook
pip install powerbiclient
PowerBI report embedding utility class
The library exposes a class Report which will be used to integrate the report. Let’s talk about different parameters which are taken by this class :
– access_token: Token to authenticate to PowerBI service while embedding the report.
– embed_url: Embed URL of the Power BI report.
– token_type: It’s an Enum with values — AAD, EMBED, with default value as AAD.
– group_id: Id of Power BI Group or Workspace where the report resides.
– report_id: Id of Power BI report.
– auth: Authentication object. It will be used if ‘access_token’ is not provided.
2.B. Ways through which we can integrate a report:
1. Using Report URL
2. Using Report ID and Group ID
For the article, we will be using the publicly accessible report: https://playgroundbe-bck-1.azurewebsites.net/Reports/SampleRepo
2.B.1. Using Report URL
Step: 1 – Get the embed URL and the access token for the report:
res = requests.get(‘https://playgroundbe-bck-1.azurewebsites.net/Reports/SampleReport')
access_token = res.json()[‘EmbedToken’][‘Token’]
embed_url = res.json()[‘EmbedUrl’]
The above code will get the embed token and the URL and store it in the access_token and embed_url variable.
Step: 2 – Add the report to the notebook :
report=Report(access_token=access_token,embed_url=embed_url, token_type=models.TokenType.EMBED.value)
report
Note: We can make an observation here that to display the report we need to print/display the report object in the notebook.
Voila!, We are successfully able to access the report in the Jupyter notebook.
2.B.2. Using Report Id and Group Id
Let’s talk about the report ID and the group ID which will be used to add the Power BI report in the notebook.
Group ID: Unique identifier of the workspace where the report is published.
Report ID: Unique identifier of the report in the workspace.
Step: 1 – Get the report ID and the group ID for the report: You can get the Ids from the report URL

From the above snapshot, we can get the report ID and the group ID from the embed URL.
group_id=”be8908da-da25–452e-b220–163f52476cdd”
report_id=”f6bfd646-b718–44dc-a378-b73e6b528204″
Basically, the report with Id “f6bfd646-b718–44dc-a378-b73e6b528204” resides in the work space with unique id ”be8908da-da25–452e-b220–163f52476cdd”.
Step: 2 – Add the report to the notebook :
report = Report(access_token=access_token, embed_url=embed_url, token_type=models.TokenType.EMBED.value, group_id = group_id, report_id = report_id)
report
Cool!, We are able to successfully add the report using the report ID and the group ID as well. What Next?
2.C. Manage the report using python
Apart from just visualizing the Power BI report, we can also manage it using python. Let’s simply try to add a filter to the report. In the above outputs, we can see that we have a view where the market share data is visualized based on Regions —
def filter_report(Region):
    region_filter = {
        '$schema': "http://powerbi.com/product/schema#basic",
        'target': {
            'table': "Geo",
            'column': "Region"
        },
        'operator': "In",
        'values': [Region]
    }
    report.remove_filters()
    report.update_filters([region_filter])
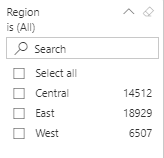
In the above method, we are trying to add Filter on Region Column in Geo Table. The filter values are provided as input to this function.
To get an interactive utility to apply filters, we will use interact utility from ipywidgets.
interact(filter_report, Region=[‘Central’, ‘East’, ‘West’]);
Awesome! We are now not only able to add the report in the Jupyter notebook we can add widgets to interact with it.
3. Conclusion
In this article, we utilized the powerbiclient to embed the report in the Jupyter notebook using URL and report/group ID.
We also tried to manage the report using python, where we added a filter to the report. You can get the complete code from GitHub.
Let me talk a little about authentication. In this article, I have used a publicly accessible report, however in the actual case, the report may be confidential and in that case, you would need secured access to embed the report in Jupyter notebook.
This is where you can use the ‘auth’ parameter in the Report class.
There are two basic types of authentication that you can use :
1. Device flow authentication — Here, the token is retrieved using the identity of the machine where the notebook is running like a virtual machine.
2. Interactive authentication — The user is prompted to enter the credentials in the local browser and the token retrieved is used to talk to the Power BI service.
To get details on using the authentication, please refer to this link.
You can get more details about the powerbiclient from its official repo.
Thank you for reading this article. Gracias!
The media shown in this article on Deploying Machine Learning Models leveraging CherryPy and Docker are not owned by Analytics Vidhya and are used at the Author’s discretion.


