This article was published as a part of the Data Science Blogathon
Introduction
Hey Guys, Hope you are doing well.
This article will be about improving the standard k-means clustering algorithm by applying Transfer Learning techniques for better classification of images from an unlabeled dataset. In the first section, the article will focus on the basics of k-means and how we use it for unsupervised learning. In the next section, we will look at how we can use Transfer Learning Techniques to improve k-means for image classification.
This article focuses on all categories of viewers (beginner, Intermediate, Expert). So in case, you know the standard k-means algorithm you can skip the first section and jump to the second section. But I will advise you to read the complete article.
Table of Content
Section – 1
1.1 Introduction to problem
1.2. What is k-means clustering?
1.3 k-means clustering Algorithm
1.4 Elbow method
1.5 Standard code for image classification
1.6 Code for Elbow Method
Section – 2
2.1 Transfer Learning
2.2 Code Explanation for k-mean + Transfer learning
2.3 Important links
Let’s first try to understand what is our problem.
Problem: Classification of images from Unlabeled dataset.
This category of problem falls under Unsupervised Learning. So what is Unsupervised Learning?
Unsupervised Learning is a type of machine learning algorithm where models take inference from untagged data without any supervision. This means that only data will be given to the model without any more information and it may have to find meaningful patterns, group data, or extract generative features.
Unsupervised Learning is further divided into two types :
Clustering :
A technique that is used to segregate data into various groups with similar features or characteristics. A common example can be a folder with 10000 images and you want to create different folders with similar images. Can you do that in 1-2 days? Hard! But Clustering can.
Common Clustering algorithms are K-Means, Hierarchical, BiClustering. Clustering has a large number of applications in the real world.
Association :
This technique tries to find relationships between different entities. A common example for this type of problem is Super Market Bucket analysis, suppose a customer generally buys a drink with potato chips and burgers. This insight can be used by supermarkets to increase their sales. How? They can put up pamphlets for free drinks with 10 burgers or something. Association also has application in the real world.
That was enough for the introduction lets improve k-means. But What is K-means? Let’s see.
What is K-Means Clustering?
K-Means clustering is a method to divide n observations into k predefined non-overlapping clusters / sub-groups where each data point belongs to only one group. In simple terms, we are trying to divide our complete data into similar k-clusters. ‘Similar’ can have different meanings with different use cases. Similar can mean the same size, the same color in the image, same features, or anything you can think of.
K-Means is a centroid-based algorithm where we assign a centroid to a cluster and the whole algorithm tries to minimize the sum of distances between the centroid of that cluster and the data points inside that cluster.
Algorithm of K-Means
1. Select a value for the number of clusters k
2. Select k random points from the data as a center
3. Associate each data point with the nearest center calculating the Euclidean Distance.
4. Calculate the centroid and mean of all data points in the cluster.
5. Repeat 2,3,4 until stopping criteria.
Stopping Criteria:
1. the Maximum number of iterations is reached.
2. Centroid of the newly formed cluster does not change.
3. Data points remain in the same cluster.
This algorithm aims at minimizing an Objective Function known as squared error function given by:
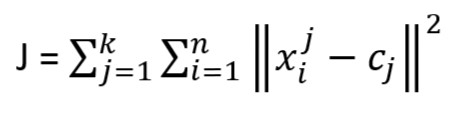
k = number of cluster
n = number of observations/cases
xij = case i belong to cluster j
cj = centroid for cluster j
So you might have got an idea of what is happening in k-means. Now let’s make things more clear with the below Visualization.
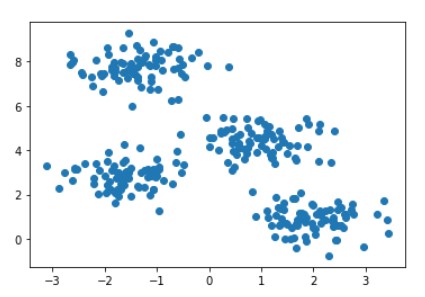
RAW data points are shown in the below image
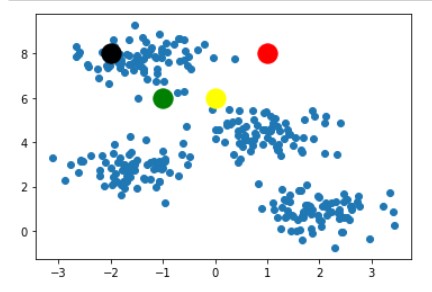
Following step-1 we randomly picked k=4 and plotted it in the below image.
Following steps 3 and 4 we get the below images after 2-3 iterations
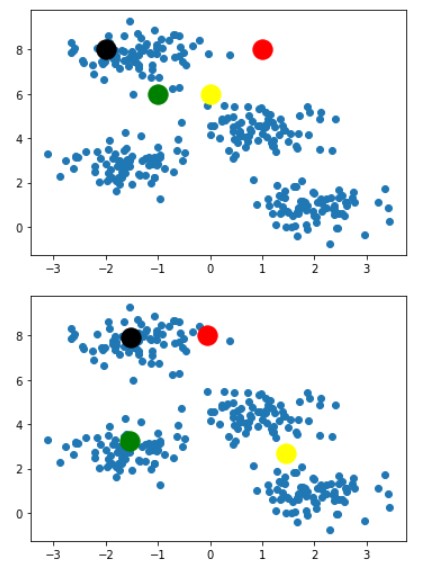
For saving space this blog will contain images of only 2 iterations. Our algorithm ended at the image below
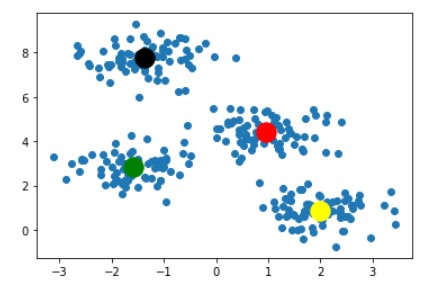
With this last image as result, we can clearly say that this is the best combination of k-clusters points for given dataset points and any other combination of k-cluster points would not be as good as this one. So this ends the working of the K-Means algorithm.
You might be wondering if we have unlabeled data and we do not know anything about it then how can we decide on a good value of k. This is the most genuine question that arises when we use K-Means on the unknown dataset. The first idea that strike to mind for this problem is to brute force all the values within a range and choose one with the best accuracy.
Yeah, you are correct if you were able to think if you are a genius (just kidding). But in real life will we be able to calculate accuracy? NO. So what should we use for judging the best value?
We can use the Objective Function discussed in K-Means Section also known as SSE.
Let’s introduce one such method for finding the good value of ‘k’.
Elbow Method
By using the Elbow method, we can get a notion of what a good ‘k’ would be. This method is based upon the Sum of Squared Distance between data points and their closest centroid. We can pick ‘k’ where these values start to get flatten or start to form an elbow. We will be dealing with the coding part later in this section.
The terminology used for Sum of Squared Distance while dealing with K-Means is called Inertia.
Let’s get our hands dirty with python.
Python Code for Image Classification
We will be using a very popular dataset of Dogs vs Cats, which you can find here. This dataset contains 25,000 images of dogs and cats. We will not be going that far we will be using only 1000 images 500 for each class.
# importing libraries
import os
import zipfile
import glob
import numpy as np
import pandas as pd
import matplotlib.pyplot as plt
import seaborn as sns
import matplotlib.cm as cm
import keras
import cv2
%matplotlib inline
#import K-Means
from sklearn.cluster import KMeans
# important metrics
from sklearn.metrics import accuracy_score
from sklearn.metrics import confusion_matrix
DATA PROCESSING
data = []
label = []
path = "./data/train/"
c = 0
d = 0
IMG_SIZE = 32
for file in os.listdir(path):
    img=cv2.imread(path+file)
    img=cv2.resize(img,(IMG_SIZE,IMG_SIZE))
    img=img.astype('float32')
    if file[:3]=='cat':
        if c==500: continue
        c+=1
        label.append("cat")
    else:
        if d==500: continue
        d+=1
        label.append("dog")
    data.append(img)
data = np.array(data)
data/train/ contains all the images in the system. List data has all the images saved in form of a matrix.
List label contains all the labels in form of a string.
Code above uses image size 32 to make calculations easy. When we convert a 3 channel image to an array it will contain IMG_SIZE*IMG_SIZE*3 values for each image which will increase quite a lot if we increase image size. Even for our case, each entry of the image will have 32*32*3 = 3072 values.
Till now we have our data and labels. Let’s see the preprocessing we need.
PREPROCESSING
data_label = []
for i in label:
    if i=="cat": data_label.append(0)
    else: data_label.append(1)
data_label = np.array(data_label)
We have stored all labels in integer format to data_label. Contents of data_label will be 0 and 1. 0 for the cat and 1 for the dog.
data = data/255.0
reshaped_data = data.reshape(len(data),-1)
Output
reshaped_data.shape = (1000,3072)
With this step we have first normalized the values then we flattened each 32*32*3 image to 3072 values. This step is crucial because k-means does not accept data with more than 2 dimensions. In reshaped_data contains 1000 images of 3072 sizes.
STANDARD KMEANS
kmeans = KMeans(n_clusters=2, random_state=0)
clusters = kmeans.fit_predict(reshaped_data)
kmeans.cluster_centers_.shape
Output
kmeans.cluster_centers_.shape = (2,3072)
This is the standard code for k-means clustering defined in sklearn. kmeans.cluster_centers_ contains 2 centroids with 3072 sizes. These centroids may or may not lie on images from the dataset.
SCATTER PLOT OF CENTROIDS
x_data = [i for i in range(3072)]
plt.scatter(x_data,kmeans.cluster_centers_[0], color = 'red',alpha=0.2,s=70)
plt.scatter(x_data,kmeans.cluster_centers_[1] , color = 'blue',alpha=0.2,s=50)
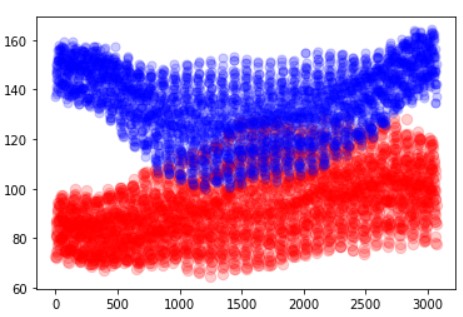
In the above image, we can see that some points are intersecting. This shows that K-Means will be confused while classification. The best value is where they both are completely separated. We have used the x-axis of 3072 because that is the size of our image. And plotted image value in the y-axis.
MAPPING THE LABELS
# mapping labels from cluster to original labels
def get_reference_dict(clusters,data_label):
    reference_label = {}
    # For loop to run through each label of cluster label
    for i in range(len(np.unique(clusters))):
        index = np.where(clusters == i,1,0)
        num = np.bincount(data_label[index==1]).argmax()
        reference_label[i] = num
    return reference_label
# Mapping predictions to original labels
def get_labels(clusters,refernce_labels):
    temp_labels = np.random.rand(len(clusters))
    for i in range(len(clusters)):
        temp_labels[i] = reference_labels[clusters[i]]
    return temp_labels
K-Means do not have any information about the labels of our actual dataset as it works by randomly picking up points and assigning clusters. So we need to map the points such that they match the real labels. get_reference_dict maps the clusters to the original data label while get_labels maps the referenced labels with the predicted values.
With this, our code is completed and we can simply check the accuracy of our code.
reference_labels = get_reference_dict(clusters,data_label)
predicted_labels = get_labels(clusters,reference_labels)
print(accuracy_score(predicted_labels,data_label))
Output
0.532
So we got an accuracy of more than 50 percent with k-means where we do not have to train our model for classification.
ELBOW METHOD
sse = []
list_k = [2,16,64,100,256]
for k in list_k:
    km = KMeans(n_clusters=k)
    clusters = km.fit_predict(reshaped_data)
    sse.append(km.inertia_)
    reference_labels = get_reference_dict(clusters,data_label)
    predicted_labels = get_labels(clusters,reference_labels)
    print(f"Accuracy for k = {k}: ", accuracy_score(predicted_labels,data_label))
# Plot sse against k
plt.figure(figsize=(6, 6))
plt.plot(list_k, sse, '-o')
plt.xlabel(r'Number of clusters *k*')
plt.ylabel('Sum of squared distance');
Output
Accuracy for k = 2:  0.523
Accuracy for k = 16:  0.588
Accuracy for k = 64:  0.612
Accuracy for k = 100:  0.638
Accuracy for k = 256:  0.719
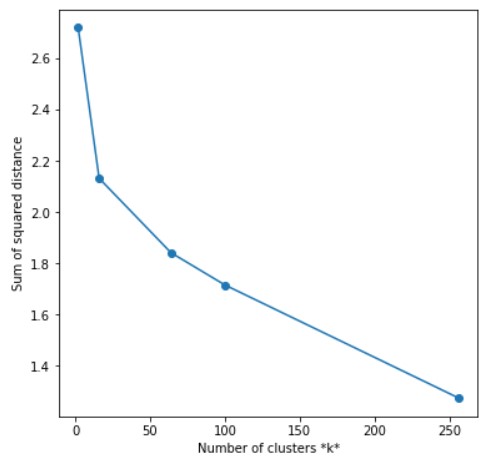
Oh damn! Why are we getting better accuracy at 256 instead of 2 when we know that our data contains only 2 different classes? There could be many reasons for this observation. Maybe some cats look more like dogs or maybe some cats are different from other cats. You can try an experiment to apply k-means to a dataset where you only have one breed of dog and one breed of cat. K-Means will perform pretty awesome in that case. We are getting these many clusters because there could beside photos of cats, that will surely look different from the front side. All of this is because our model doesn’t know anything about cats and dogs until we have given it the data to form clusters. It is the same as you do not know about cars and someone wants you to form clusters of cars with the same features (like the same engine power, etc).
Can we do something better? Can we somehow use some previous knowledge? Yes, the answer is Transfer Learning. Let’s have a look at it.
Section – 2
What is Transfer Learning?
Let’s see what Wikipedia thinks
Transfer learning (TL) is a research problem in machine learning (ML) that focuses on storing knowledge gained while solving one problem and applying it to a different but related problem
So basically transfer learning is a way to utilize previous work for the generalization of newer tasks. Let’s say you have created a model and trained it to 100K images and it took almost 1-day for training. And then you encounter a similar problem which might be a subset of the one your model is trained. Will you waste all your efforts of 1-day for training or will you play smart and optimize the same model. This is exactly what we do in transfer learning. We use a prebuilt model which is already trained on some data and we use the weights of that training to solve our problem.
Transfer Learning with K-Means
ALGORITHM
1. Preprocess each image according to the input accepted by the transfer learning model
2. By using the weights from the transfer learning model convert each image to the respective vector.
3. Flatten and store all the image weights in a list.
4. Feed the above-built list to k-means and form clusters.
Putting the above algorithm in simple words we are just extracting weights for each image from a transfer learning model and with these weights as input to the k-means algorithm we are classifying the image.
Python Implementation
IMPORTING LIBRARIES
from keras.applications.resnet50 import preprocess_input
from keras.preprocessing import image
import keras
These are the additional libraries needed except the above discussed.
MODEL
model = keras.applications.ResNet50(weights='imagenet', include_top=False, input_shape=(IMG_SIZE, IMG_SIZE,3))
For Transfer Learning Model we are using ResNet50 with ‘imagenet’ weights because of its simplicity. You can use any model for example VGG16, VGG19, DenseNet whichever you feel like.
FEATURE EXTRACTION
def extract_vector(data_holder):

    resnet_feature_list = []

    for im in data_holder:

        im = image.img_to_array(im)

        img = preprocess_input(np.expand_dims(im.copy(), axis=0))

        resnet_feature = model.predict(img)

        resnet_feature_np = np.array(resnet_feature)

        resnet_feature_list.append(resnet_feature_np.flatten())
    return np.array(resnet_feature_list)

Output
dimensions of im:  (32, 32, 3)
dimensions of img:  (1, 32, 32, 3)
dimensions of resnet_feature_np:  (1, 1, 1, 2048)
In the above code, we are traversing through each image exactly once. Then we are preprocessing it according to the input requirements of our Transfer Learning model. The final preprocessed image is stored in img named variable. After that, we are predicting the image using the model. And storing the predicted features to a list resnet_features_np.
K-means only accepts 1-D array so we need to covert resnet_features_np (4-D) to 1-D which is done by a predefined function flatten().
Now we have created our feature vector/array. It’s time to use it with K-Means
KMEANS MODIFIED
array = extract_vector(data)
kmeans = KMeans(n_clusters=2, random_state=0)
clusters = kmeans.fit_predict(array)
Output
kmeans.cluster_centers.shape == (2,3072)
We will get the array clusters with a prediction that can be mapped in the same way as we did in Standard K-means. What do you think about accuracy? Try Out the code find it yourself.
NOTE: Since we used very little data and only 2 classes it might be possible that the result of applying transfer learning can decrease the result but, with a bigger dataset and more classes this method will perform better than standard k-means.
CODE
Github: Click Here (Star + Fork)
Kaggle: Click Here (Upvote + Follow)
Accuracy that we achieved from Transfer Learning K-Means was higher than standard K-means.
EndNote
In this article, we have discussed one of the most simple approaches to image classification under unsupervised learning. We understood and implemented standard k-means. Then we looked at the elbow curved method for finding ‘k’ (number of good clusters). Then we understood why we need improvement to the classic algorithm.
Finally, we implemented K-Means with Transfer Learning and were successfully able to increase the accuracy of standard k-means.
I Hope You liked the liked.
Thank You for giving this article your precious time.
Happy Leaning!
If you think this article contains mistakes, please let me know through the below links.
Contact Author:
LinkedIn : Click Here
Github: Click Here
Also, check out my other article here.
My Github Repository for Deep Learning is here.
The media shown in this article are not owned by Analytics Vidhya and are used at the Author’s discretion.


