This article was published as a part of the Data Science Blogathon
Introduction
Pandas dataframe is largely used for analyzing data in python. Pandas is a powerful, flexible, and reliable tool for many data analysts. There are some well-known functions present as well as not-so-formal techniques that can make life easier for any data analyst professional and enthusiast.
In this post, I will discuss some useful functions and significant techniques with examples. I am sure, you have used some of these functions frequently. But, some of them may be not so familiar to all. Overall, I believe it will enrich your data analysis arsenal. Though pandas are one of the most frequently used libraries in python for data analysis, still I write down the use of some of my own favorite methods which are helpful for any data analyst.
In this post following topics are included:
- unique and nunique function
- describe function
- sort_values function
- value_counts function
- isnull function to find NULL values
- fillna function to fill NULL values
- groupby function
- map function and its use for categorical encoding
- apply function and lambda function
- pivot function
So, Let’s start
Introduction
Before using the above-mentioned functions I will create my dataframe using the Kaggle Titanic dataset, you can download the same from here. This way, a variety of options can be explored. Alternatively, any dataset from open source can be used for practice.
1. Unique and nunique
Unique function in pandas returns a list of the unique elements based on the appearance. This function is faster than NumPy’s unique and it also includes NA values. This is particularly useful to check the different values in a categorical field.
data['Embarked'].unique()
Output: array([‘S’, ‘C’, ‘Q’, nan], dtype=object)
Nunique function on the other hand counts the distinct values of columns. NaN values can be ignored. This shows only the number of different categories present in a column of a dataframe.
data['Embarked'].nunique()
Output : 3
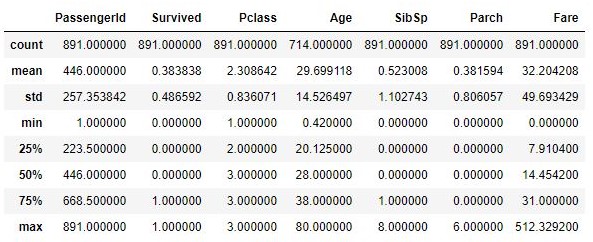
2. Describe
This function shows descriptive statistics like mean, standard deviation, maximum, minimum, and other central tendencies and the shape of the distribution. This excludes NaN values from the summary. This is useful to get an idea about the distribution of data fields and outliers if any. The percentile of the output can be customized by mentioning the percentiles range in the function parameter.
data.describe()
Output:
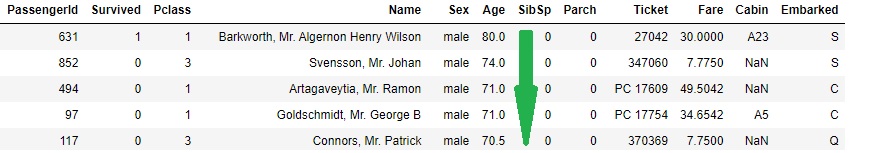
3. Sort_values
This function changes the order of the values in a column by sorting it. So, we can use this to show the dataframe as per our need by sorting ascending or descending order.
We can set the “ascending” parameter true or false, which is by default true. We can also change sorting by index or by column by setting the parameter “axis” 0 or 1. We can also sort for multiple columns by mentioning them within a list (e.g. data.sort_values(by=[‘Age’,’Pclass’, ascending=[False,True]).
data.sort_values(by='Age', ascending=False)
Output:
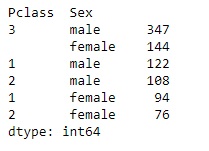
4. Value_counts
This function returns the value of the count for every unique item present in the column. The values are showing in descending order so that the most frequent element comes first. This excludes the null values. Here we will see the number of males and females onboard in different classes by calling the value_counts() function in the following way.
data[['Pclass','Sex']].value_counts()
Output:
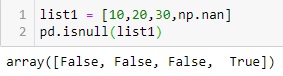
5. Isnull
This function finds if there are any missing values present in an array-like object. This function returns boolean values after checking for missing values. We are creating a list with one null value and when it is passed through the isnull() function, it gives output with a boolean list.
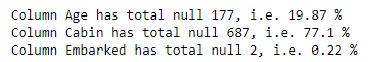
This can also come in handy when we check for missing values in a large dataframe. We can compute the total number of missing values of a column by adding sum() function at the end of isnull() function. Here we are taking our dataset and check for each column if there is any missing value and show the same.
#taking each column out of dataframe

for col in data.columns:

    #checking if there is any null in the column

    if data[col].isnull().sum()>0:

        # if null present, total number of null in the column stores here

        total_null = data[col].isnull().sum()

        print('Column {} has total null {}, i.e. {} %'.format(col,total_null,round(total_null*100/len(data),2))) #output
Output:
6. Fillna
This function is used to fill missing values based on the specified method. Fillna takes parameters such as value (a value which is used to fill the missing value) and method (such as bfill, ffill, etc). In our example dataset, the field “Age” has a total of 177 missing values. Let’s fill it with the median of “Age” using fillna() function.
data['Age'].fillna(value=data['Age'].median(),inplace=True)
data['Age'].isnull().sum()
Output:
0
The parameter “value” of fillna() can also be obtained from other complex groupby or dataframe or dictionary.
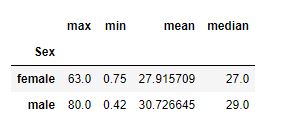
7. Groupby
Pandas groupby() function is used to split the data and apply some function to it and at the end combine the result to another object. often we need to split the data and apply some aggregation (e.g. sum, mean, count, etc) to it or transform it (e.g. for filling missing values or standardize data), groupby function comes helpful in these situations.
#we want to see for each gender maximum, minimum, average and median of age field
data.groupby(['Sex'])['Age'].agg(['max','min','mean','median'])
Output:
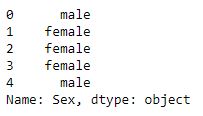
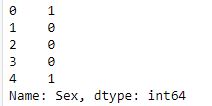
8. Map
Map function in pandas is used to map series and replace values of one series with another value associated with a dictionary, a series, or a function. This function is often used for substituting values of a column of a dataframe or a series, but the values of the caller map function and the values of the column passed as series must be the same.
In our dataset suppose we want to convert the gender field as a binary field i.e. to replace “male” with value 1 and female with value 0. The same can be done easily by following way.
data['Sex'].head()
Output:
gender = {'male':1, 'female':0} #create a dictionary to replace values
data['Sex'].map(gender).head() #call map function and pass the dictionary to map the values of the column
Output:
9. Apply
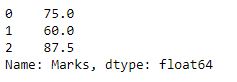
Pandas apply function certainly one of the most useful functions among all. We can pass a function inside apply and it’ll apply on the entire dataframe or a particular series as per need. It helps to modify the data according to the condition in a much flexible manner. Let’s see a simple example, here we have a dataframe and one of the columns has marks that we want to convert into a percentage –
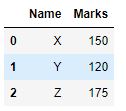
df = pd.DataFrame({'Name':['X','Y','Z'], 'Marks':[150,120,175]})
df
Output:
def percentage_marks(x):
    return x/2
df['Marks'].apply(percentage_marks)
Output:
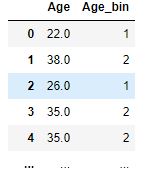
Apply function can also be used with anonymous function or lambda function. Suppose we have to convert a continuous field like “age” to a different age bracket column or convert a categorical field to a label encoded field, then apply function along with lambda function is very much useful in these situations.
data['Age_bin'] = data['Age'].apply(lambda x : 1 if x<=30 else
                                   (2 if x>30 and x<=45 else
                                   (3 if x>45 and x<=60 else 4)))
The Age_bin column will be created as follows
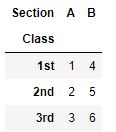
10. Pivot
The pivot function reshapes the dataframe by index or column values. This function is basically similar to the pivot table. It uses the unique value of a column to form an index of a dataframe. Unlike the groupby function, pivot doesn’t support data aggregation. An example is given below
df = pd.DataFrame({'Class':['1st','2nd','3rd','1st','2nd','3rd'],'Section':['A','A','A','B','B','B'],'Gr':[1,2,3,4,5,6]})
df
Output:
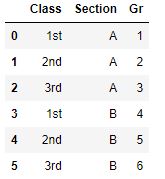
df.pivot(index='Class', columns='Section',values='Gr')
Output:
Conclusion :
I hope all or some of the topics will be helpful for you at the time of EDA and data analysis, especially to everyone who is new to the world of python and pandas. Thank you for reading.
The media shown in this article are not owned by Analytics Vidhya and are used at the Author’s discretion.


