This article was published as a part of the Data Science Blogathon
Overview
In simple words, PyCaret is a machine learning library for lazy people. I highly recommend this library to my fellow lazy ML programmers 🙂 .
All jokes aside, PyCaret is an open-source, low-code(hence the lazy bit) machine learning library in Python, created by Moez Ali, that helps you in preparing your data and deploying single or, multiple models for comparison within seconds. You can view their official website here: PyCaret.org.
This library has extensive applications mainly in the field of Business Intelligence. It’ll help you and your team to create end-to-end ML experiments, spend less time coding and focus on the business problems. PyCaret integrates seamlessly with other tools like PowerBI and Tableau. It can run in any choice of notebooks like Jupyter, Google Colab, Azure notebooks, etc.
Both classification and regression models can be prepared using PyCaret. In this article, we will be working with a Regression problem, and you will see how easy and hassle-free it becomes to code using Pycaret. We will use the Housing Prices Dataset which you can find on Kaggle here: Housing Prices – Advanced Regression techniques. You can find more about the dataset later on in the article.
Objectives
The objective of this article is to help you get started with the pycaret.regression module pf PyCaret, assuming you are a beginner. Another article will be soon published to cover some of the more complicated topics, but for this article, we will cover:
Getting Data: Importing data from Kaggle
Setting up the environment: Setting up an environment in PyCaret to run regression models hasslefree
Create Model: Creation of a model, perform cross-validation, and evaluate the regression metrics.
Tune Model: Automatically tuning the hyperparameters of a regression model.
Plot Model: plotting the performance of various models.
Finalize model: How to select and finalize the best model at the end of the experiment.
Predict Model: making predictions on new data.
Save Model: Saving the model for future use.
Installation
Installing on Google Colab, Azure Notebooks or Kaggle
!pip install pycaret
Installing in local Jupyter notebooks
pip install pycaret
Pre-Requisites
Python 3.6 or higher
PyCaret 2.0 or higher
Stable internet connection to load the data
Basic knowledge of Regression
What is Regression?
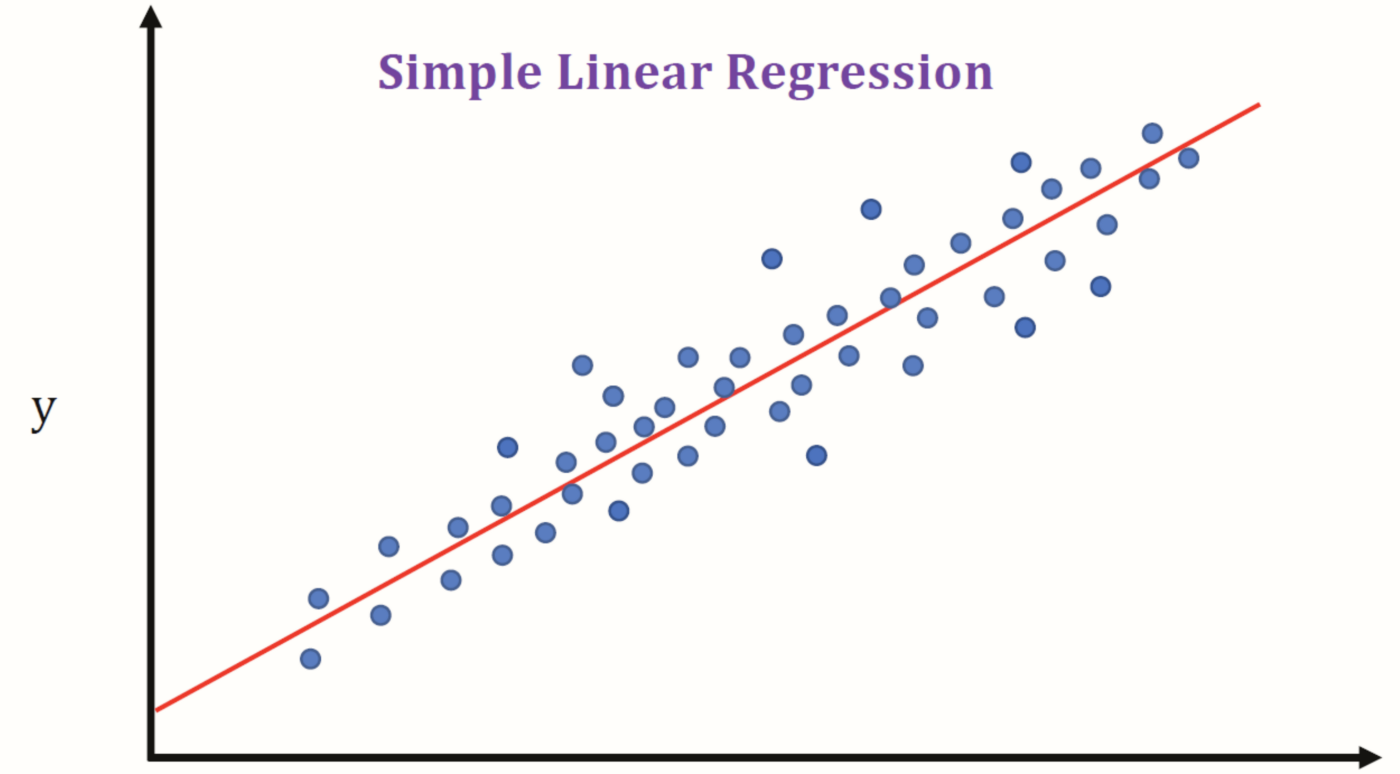
Image Source: Intro to Linear Regression – ML 101 | Martin Tin
The origin of Regression or regression analysis is from statistics and is described as a process to estimate the relationships between a dependable variable(aka ‘outcome variable’ or ‘target’) and one or more independent variables (aka ‘features’, ‘predictors’ or ‘covariates’). The objective of regression analysis in ML is to predict the outcome of some continuous values for example sales amount, quantity, temperature, etc. You can learn more about regression here.
The Regression Module in PyCaret
PyCaret’s regression module pycaret.regression is a supervised machine learning module used for predicting values or outcomes using various algorithms and techniques. It has over 25 algorithms and 10 plots to analyze the performance of the models. Be it ensembling, hyper-parameter tuning, or advanced tuning like stacking, PyCaret is your one-stop for all ML solutions.
Dataset

Image Source: Castles Unlimited
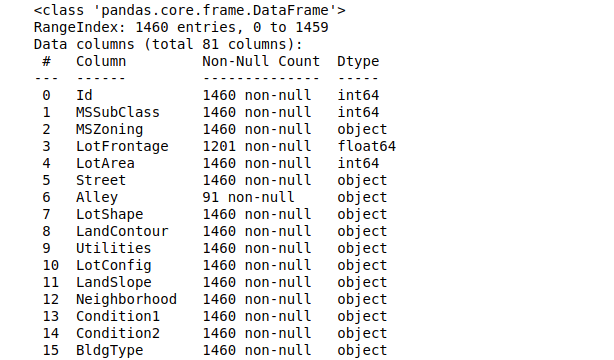
In this article, we shall use the popular “House Prices” dataset, which is a very popular dataset for beginners looking for datasets to apply their newly learned Machine learning concepts. With over 81 columns and 1400 entries, this dataset covers almost all the aspects of a property.
Some of the aspects are LotFrontage, LotArea, Street, Alley, LotShape, LandContour, Utilities, Neighbourhood, YearBuilt, etc. A brief description of every column can be found here.
Importing Libraries
Python Code:
import pandas as pd

test = pd.read_csv("test.csv")
train = pd.read_csv("train.csv")

print(train.shape)
print(test.shape)
print(train.head())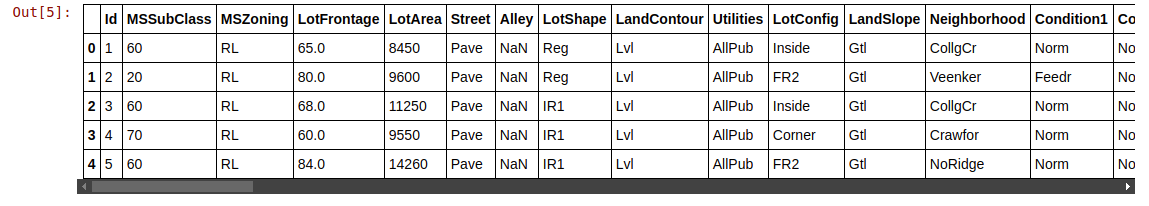
(Note: Since there are a large number of columns, only a fraction of it is included in the snapshot above and the next ones too.)
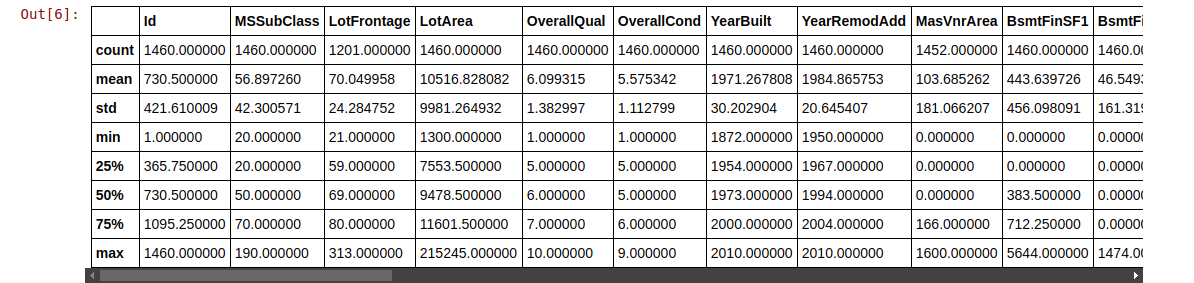
train.describe()
train.info()
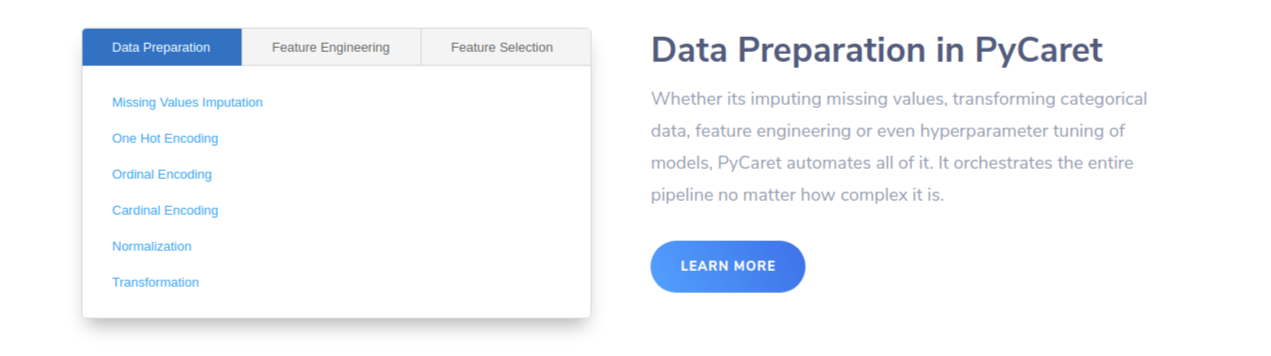
Setting up the environment in PyCaret
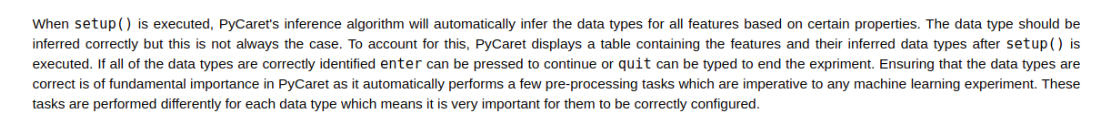
The transformation pipeline is created to prepare the data for modeling and deployment, after the setup() function is initiated. setup() must be called before any other function is executed in PyCaret. There are 2 mandatory parameters for setup(): a pandas DataFrame and the name of the label column. Here is an important excerpt about setup() from the PyCaret official website:
Here I’ve separated the categorical columns manually because the PyCaret algorithm wasn’t able to do it properly. This might seem like a lot of work but trust me, this is the only part where you have to type so much code.
#list of columns that are categorical
cat_f = ['MSZoning','Exterior1st','Exterior2nd','KitchenQual','Functional','SaleType',
                                     'Street','LotShape','LandContour','LotConfig','LandSlope','Neighborhood',
                                     'Condition1','Condition2','BldgType','HouseStyle','RoofStyle','RoofMatl',
                                     'MasVnrType','ExterQual','ExterCond','Foundation','BsmtQual','BsmtCond',
                                     'BsmtExposure','BsmtFinType1','BsmtFinType2','Heating','HeatingQC','CentralAir',
                                     'Electrical','GarageType','GarageFinish','GarageQual','GarageCond','PavedDrive',
                                     'SaleCondition']
exp_reg101 = setup(data = train, target = 'SalePrice', categorical_features = cat_f,
                   ignore_features= ['Alley','PoolQC','MiscFeature','Fence','FireplaceQu','Utilities'],
                   normalize = True,session_id = 123)
Now our environment is fully functional.
Comparing all Regression models
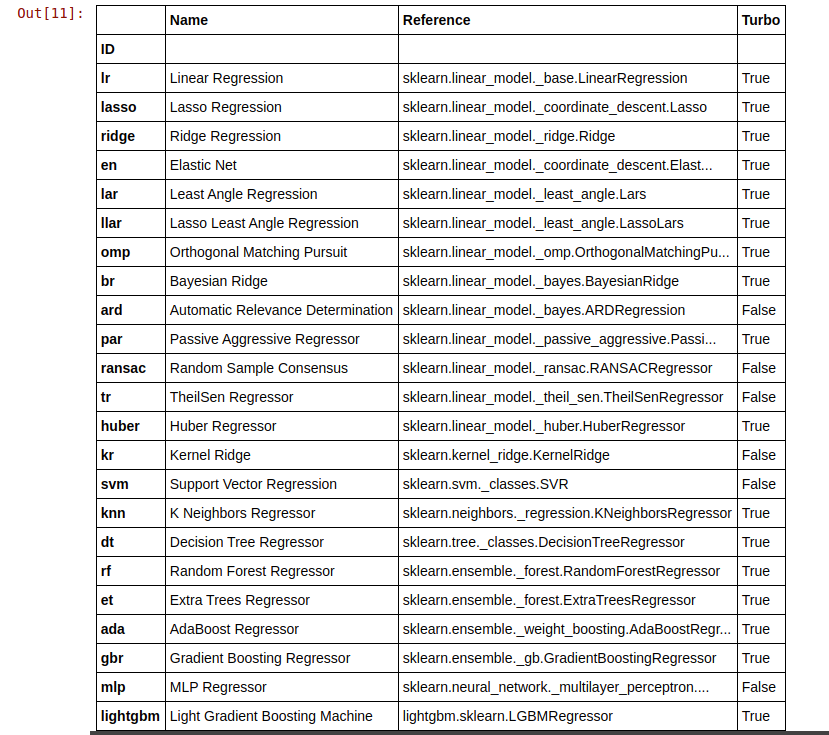
This is where the magic happens. With just a single line of code, you can run your training set on all of the available models in PyCaret. You can view the models available by typing:
# all the models that are available are
 models()
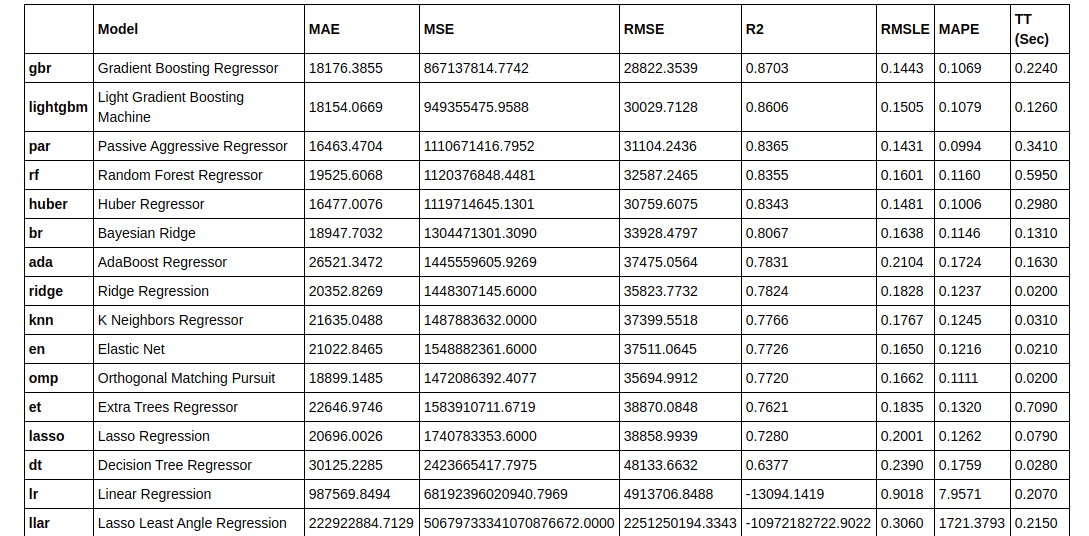
Now we train all the models and select the best one according to the R2 score:
best = compare_models(exclude = ['ransac'])
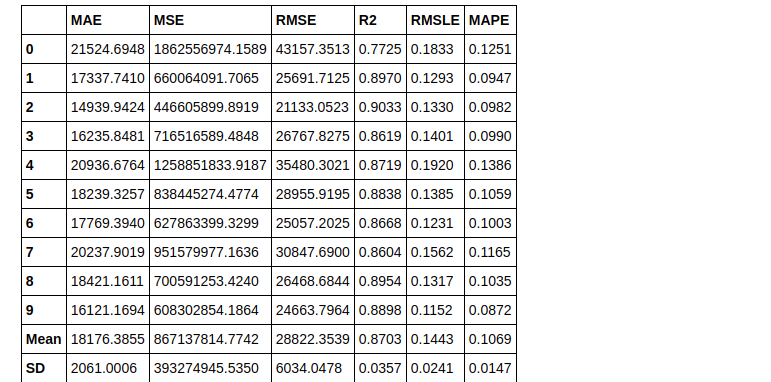
Creating the model
Since Gradient boosting regressor has the highest R2 Score, we’ll use that:
gbr = create_model('gbr')
Now we tune our model
tuned_gbr = tune_model(gbr)
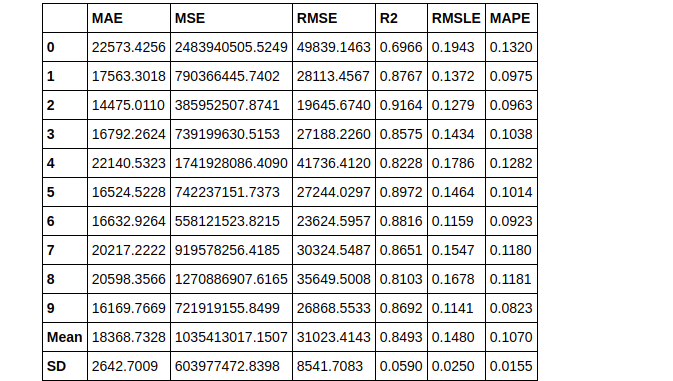
print(tuned_gbr)
> GradientBoostingRegressor(alpha=0.9, ccp_alpha=0.0, criterion='friedman_mse',
                          init=None, learning_rate=0.15, loss='ls', max_depth=7,
                          max_features=1.0, max_leaf_nodes=None,
                          min_impurity_decrease=0.02, min_impurity_split=None,
                          min_samples_leaf=5, min_samples_split=5,
                          min_weight_fraction_leaf=0.0, n_estimators=230,
                          n_iter_no_change=None, presort='deprecated',
                          random_state=123, subsample=0.85, tol=0.0001,
                          validation_fraction=0.1, verbose=0, warm_start=False)
Plotting the Model
Before finalizing the model, the plot_model() function can be used to evaluate the performance of the model across different aspects such as Residual Plots, Prediction Error, Feature Importance, etc.
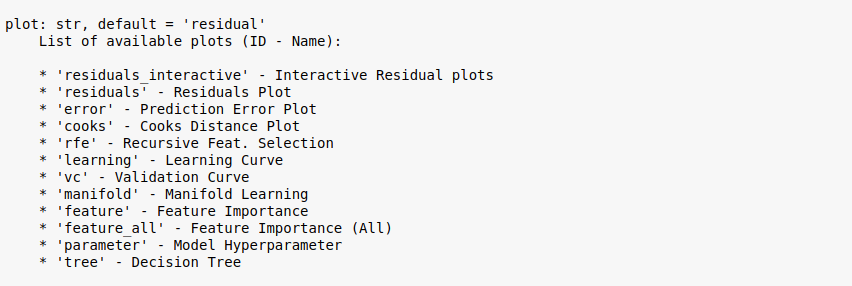
There are over 10 plots available under plot_model(), which you can view by typing:
plot_model?
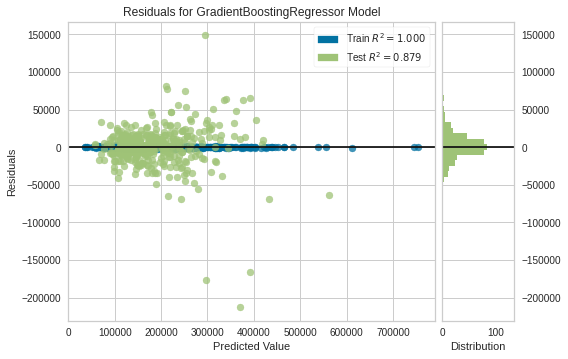
Residual Plot
plot_model(tuned_gbr)
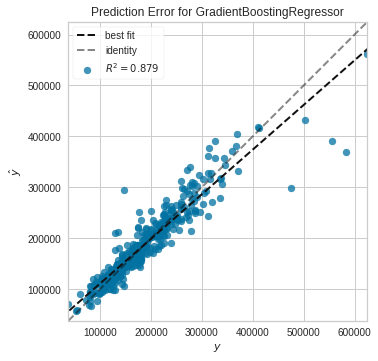
Prediction error plot
plot_model(tuned_gbr, plot = 'error')
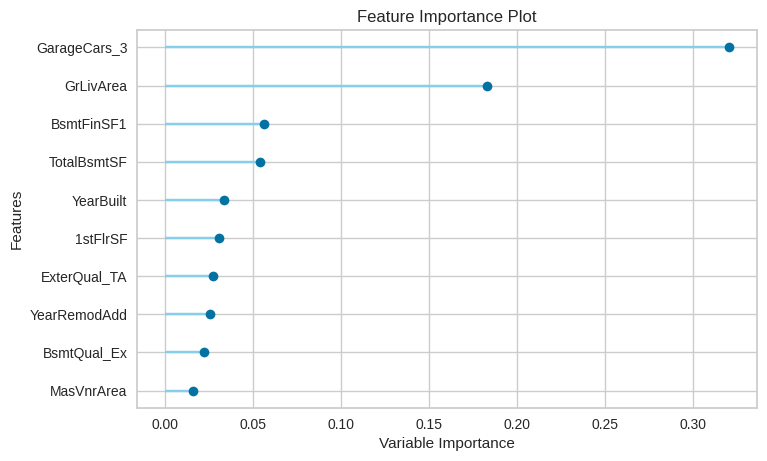
Feature importance plot
plot_model(tuned_gbr, plot = 'feature')
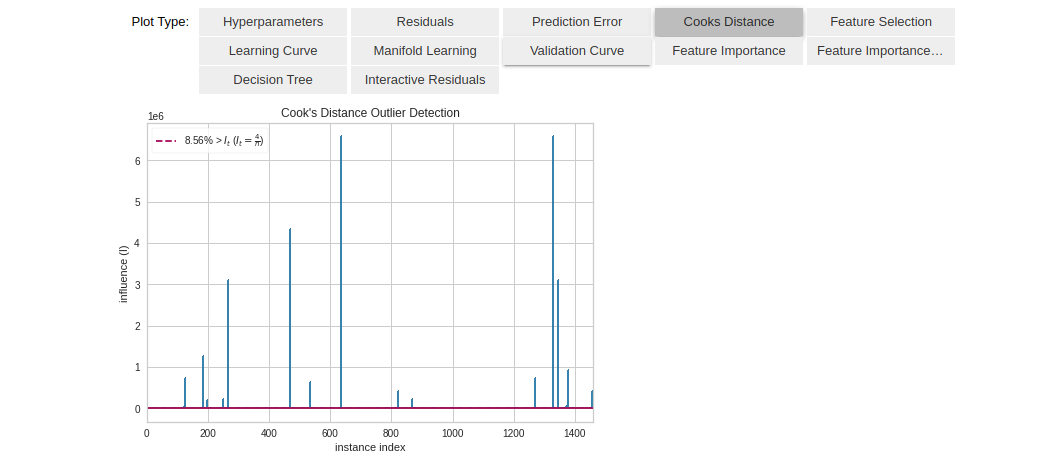
Another nice way of analyzing the model is to use the evaluate_model() function which creates an Interactive dashboard with all the available plots to choose from. The user can easily select an option and view the plot of their choice. The plot_model() function is used internally. For example, here I’ve chosen the ‘Cooks Distance’ plot:
evaluate_model(tuned_gbr)
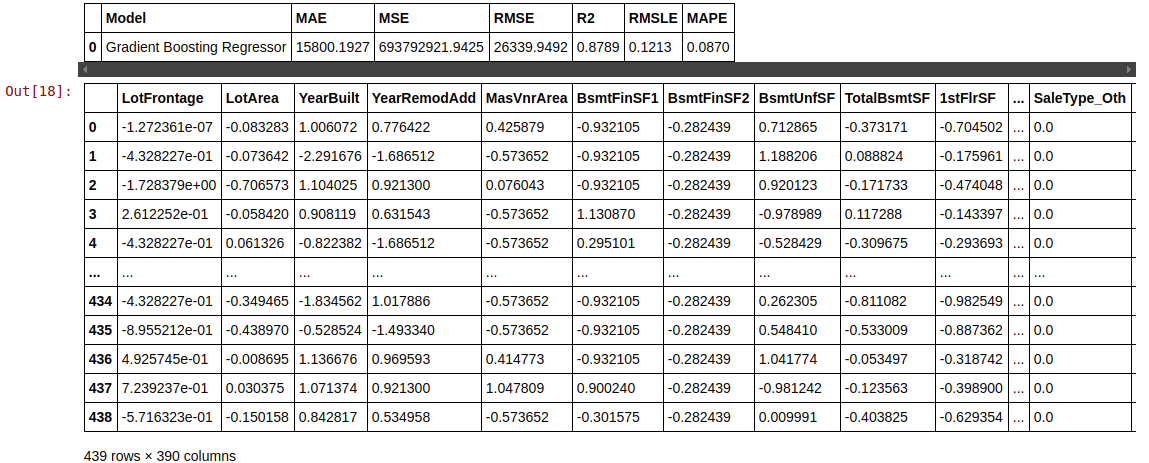
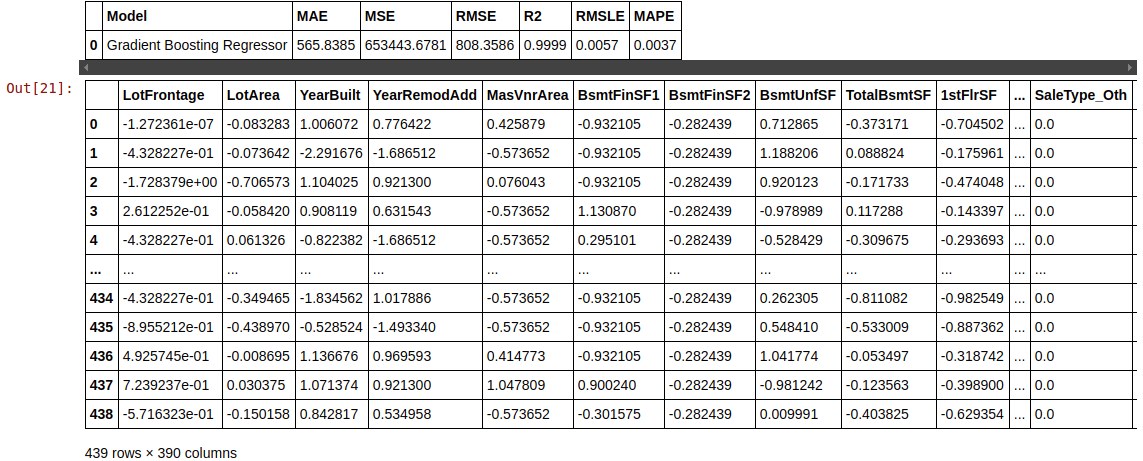
Prediction on Test Data
predict_model(tuned_gbr)
Finalizing model for deployment
final_gbr = finalize_model(tuned_gbr)
print(final_gbr)
> GradientBoostingRegressor(alpha=0.9, ccp_alpha=0.0, criterion='friedman_mse',
                          init=None, learning_rate=0.15, loss='ls', max_depth=7,
                          max_features=1.0, max_leaf_nodes=None,
                          min_impurity_decrease=0.02, min_impurity_split=None,
                          min_samples_leaf=5, min_samples_split=5,
                          min_weight_fraction_leaf=0.0, n_estimators=230,
                          n_iter_no_change=None, presort='deprecated',
                          random_state=123, subsample=0.85, tol=0.0001,
                          validation_fraction=0.1, verbose=0, warm_start=False)
predict_model(final_gbr)
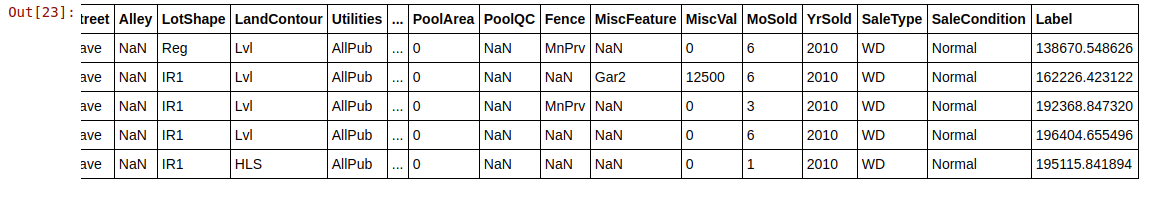
Predicting on the Test set
What the below code does is adds the predicted value to a new column called “Label” at the end of the DataFrame.
unseen_predictions = predict_model(final_gbr, data=test)
unseen_predictions.head()
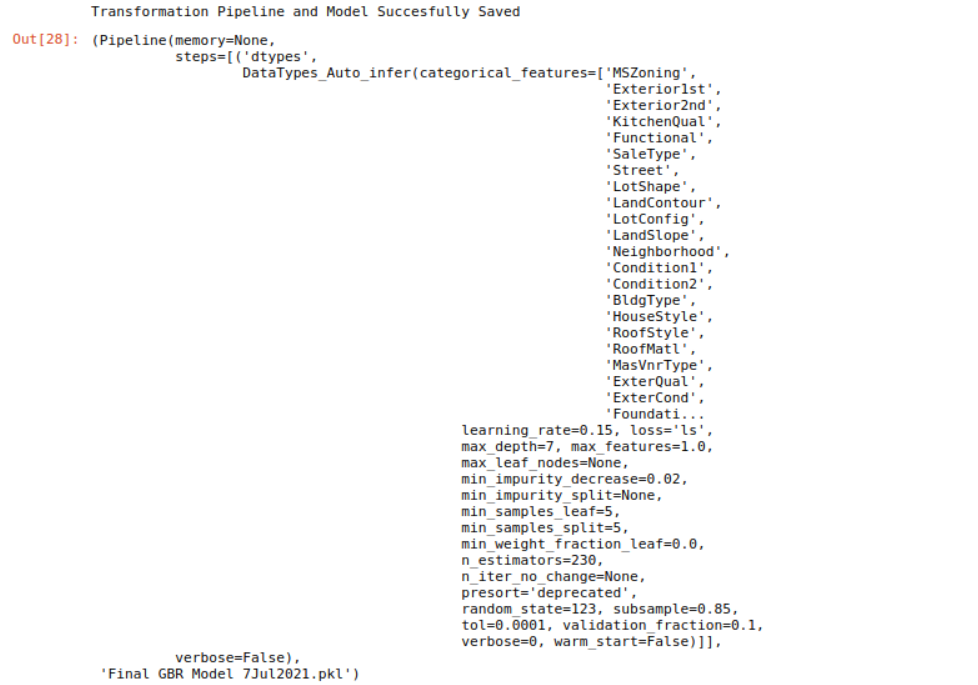
Saving the model
We have now finished the experiment, and have used the stored model called final_gbr to predict the unseen data. But what happens when we have new data to predict? Do we have to start from scratch and create a model again? Well, the answer is obviously No. PyCaret’s inbuilt save_model() allows us to save this already trained model for future use.
save_model(final_gbr,'Final GBR Model 7Jul2021')
Conclusion
This article covered the entire machine learning pipeline starting from loading the data, pre-processing the data, training model, hyperparameter tuning, and at last the prediction and saving of the trained model. All this is done in less than 10 commands which are intuitive and easy to remember. Recreating this whole process without the use of PyCaret would’ve taken 100s of lines of codes using the normal libraries, but these are only the basics of the pycaret.regression module. My next article will about Intermediate level AutoML regression using PyCaret. You can read that once it’s published, and my other articles at the following link :
Sion | Author at analytics Vidhya
You can connect with me on LinkedIn, or follow me on Github, where you can find the notebook for this article. Cheers!


